
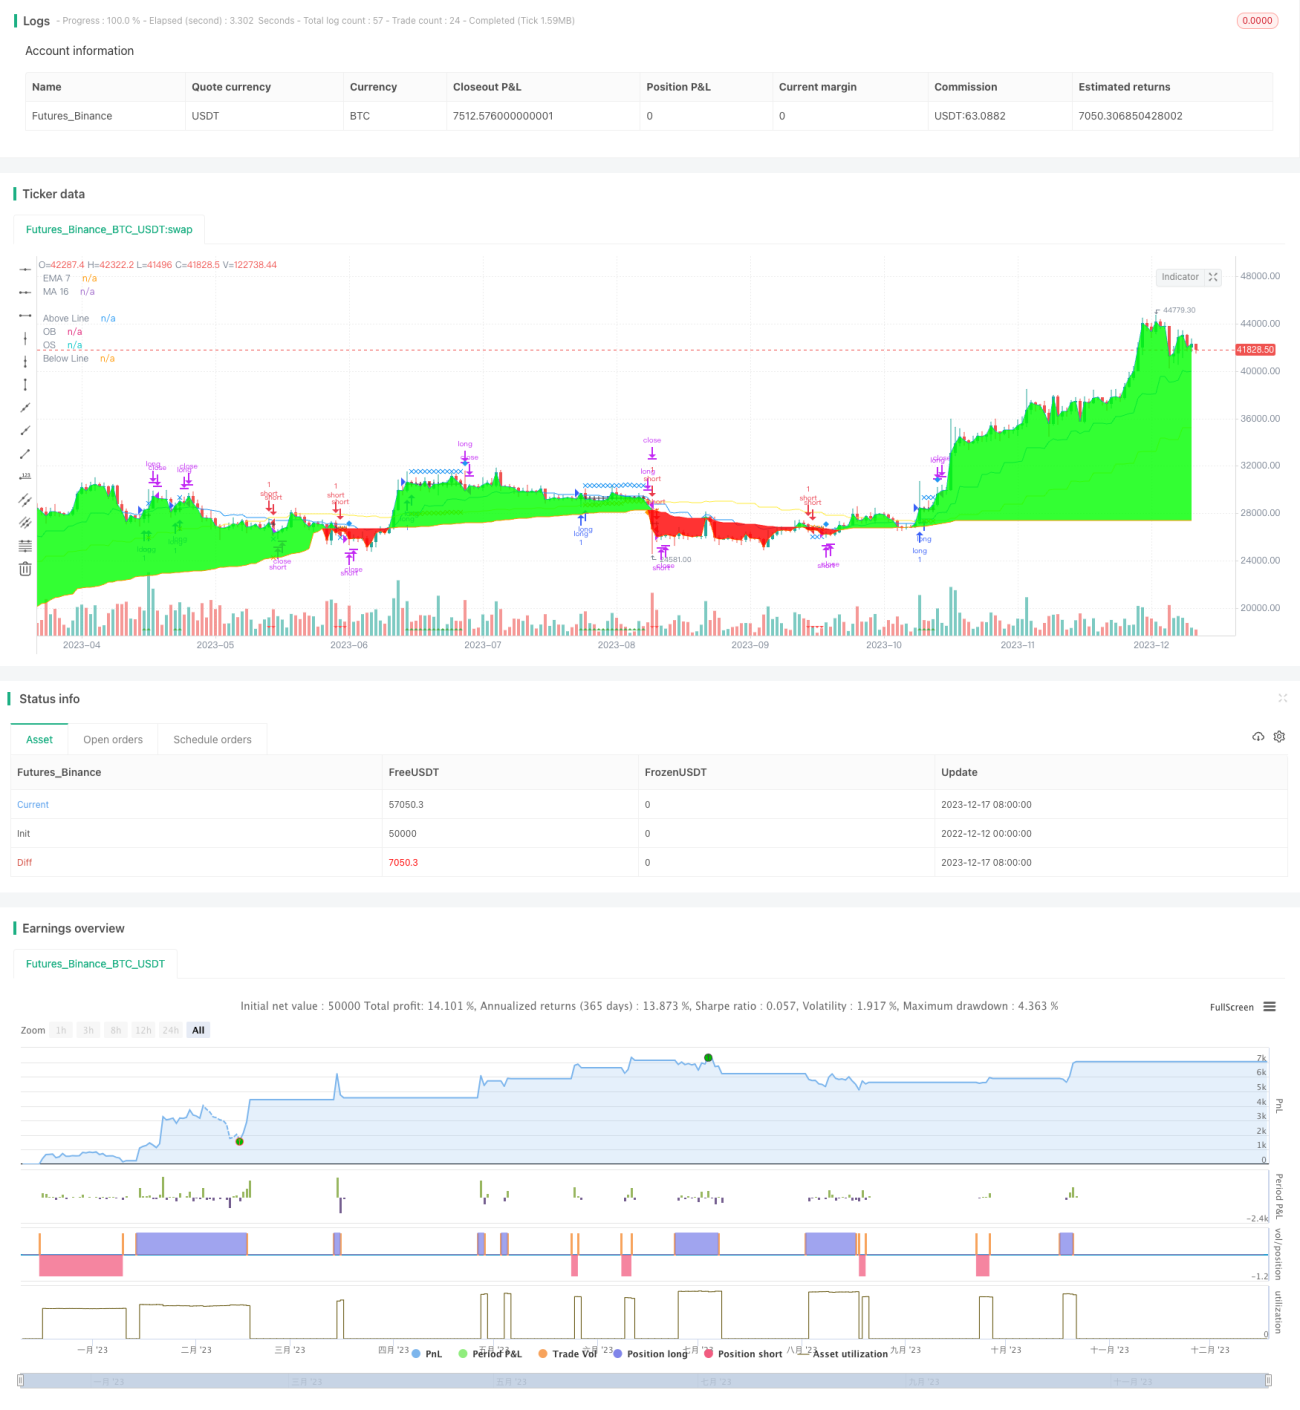
Chiến lược này dựa trên sự giao thoa của vùng hỗ trợ kháng động và đường trung bình MA làm tín hiệu đầu vào, sử dụng phương pháp dừng theo dõi xu hướng để thực hiện lợi nhuận theo dõi đường dài.
Sử dụng phương pháp thống kê phần trăm để tính toán các điểm kháng cự và hỗ trợ động để xây dựng các khu vực đảo ngược có thể.
Khi giá đi vào vùng đảo ngược, đánh giá đường MA nhanh hoặc đường MA chậm, tạo ra tín hiệu giao dịch.
Khởi động hệ thống theo dõi dừng lỗ sau khi tham gia, sử dụng phương thức dừng lỗ động để khóa lợi nhuận và theo dõi xu hướng thu lợi nhuận.
Khi giá kích hoạt điểm dừng lỗ hoặc điểm dừng, vị thế bằng phẳng sẽ thoát ra.
Động lực chống đỡ có thể nhận diện khu vực đảo ngược có thể, tăng độ chính xác vào.
MA trung bình giao nhau với kênh phần trăm, tránh tín hiệu giả.
Phương pháp theo dõi dừng lỗ có thể khóa lợi nhuận một cách hiệu quả và ngăn chặn sự mở rộng rút tiền.
Có thể cấu hình nhiều tham số để thích ứng với các môi trường thị trường khác nhau.
Trong trường hợp không có xu hướng, có nguy cơ phát sinh tín hiệu sai.
Thiết lập tham số không chính xác có thể dẫn đến quá tải vào sân, nên được nới lỏng thích hợp.
Dữ liệu phản hồi nên bao gồm chu kỳ hành động đầy đủ, tránh hạn chế.
Trong quá trình thực thi, nên tăng mức độ dừng thiệt hại thích hợp để ngăn chặn nhảy vọt.
Kiểm tra hiệu quả kết hợp của các tham số khác nhau của chu kỳ MA.
Điều chỉnh các tham số hỗ trợ kháng động, tối ưu hóa hiệu quả nhận diện đảo ngược.
Đánh giá tác động của các tham số theo dõi dừng khác nhau đối với đường cong lợi nhuận của chiến lược.
Cố gắng kết hợp các chỉ số khác để lọc tín hiệu và tăng sự ổn định.
Chiến lược này có ý tưởng tổng thể rõ ràng, sử dụng các vùng hỗ trợ kháng cự động để xác định khu vực có thể đảo ngược như bộ lọc tín hiệu, và sử dụng MA để đánh giá xu hướng xu hướng để tạo ra tín hiệu giao dịch, theo dõi dừng lỗ để kiểm soát rủi ro hiệu quả, có thể liên tục nâng cao hiệu quả chiến lược thông qua tối ưu hóa tham số, đáng để nghiên cứu và tối ưu hóa hơn nữa.
/*backtest
start: 2022-12-12 00:00:00
end: 2023-12-18 00:00:00
period: 1d
basePeriod: 1h
exchanges: [{"eid":"Futures_Binance","currency":"BTC_USDT"}]
*/
// This source code is subject to the terms of the Mozilla Public License 2.0 at https://mozilla.org/MPL/2.0/
// © allanster
//@version=4
strategy("MA-EMA Crossover LT", shorttitle="MA-EMA XO", overlay=true)
//==================== STRATEGY CODE ======================
tradeType = input("BOTH", title="Trade Type ", options=["LONG", "SHORT", "BOTH"])
// === BACKTEST RANGE ===
FromMonth = 01//input(defval=01, title="From Month", minval=1)
FromDay = 01//input(defval=01, title="From Day", minval=1)
FromYear = input(defval=2017, title="From Year", minval=2000)
ToMonth = 12//input(defval=12, title="To Month", minval=1)
ToDay = 31//input(defval=31, title="To Day", minval=1)
ToYear = input(defval=9999, title="To Year", minval=2000)
testPeriod() =>
time > timestamp(FromYear, FromMonth, FromDay, 00, 00) and
time < timestamp(ToYear, ToMonth, ToDay, 23, 59)
stopLossPercent = input(1.00, "Stop Loss Percent")
profitPercent_long = input(3.50, "Profit Percent LONG")
profitPercent_short = input(3.0, "Profit Percent SHORT")
atr_multi_PT = input(1.50, "ATR Multiple for PT")
atr_multi_SL = input(1.50, "ATR Multiple for SL")
//////////////////////////////
isLongOpen = false
isShortOpen = false
//Order open on previous ticker?
isLongOpen := nz(isLongOpen[1])
isShortOpen := nz(isShortOpen[1])
/////////////////////
//Trailing and Profit variables
trigger = 0.0
trigger := na
profitTrigger = 0.0
profitTrigger := na
//obtain values from last ticker
entryPrice = 0.0
entryPrice := nz(entryPrice[1])
stopLossLevel = 0.0
stopLossLevel := nz(stopLossLevel[1])
profitPriceLevel = 0.0
profitPriceLevel := nz(profitPriceLevel[1])
//If in active trade, lets load with current value
if isLongOpen
profitTrigger := profitPriceLevel ? high : na
trigger := stopLossLevel ? ohlc4 : na
trigger
if isShortOpen
profitTrigger := profitPriceLevel ? low : na
trigger := stopLossLevel ? ohlc4 : na
trigger
isStopLoss = isLongOpen ? trigger < stopLossLevel :
isShortOpen ? trigger > stopLossLevel : na
isProfitCatch = isLongOpen ? profitTrigger > profitPriceLevel :
isShortOpen ? profitTrigger < profitPriceLevel : na
//=================== Optional Entry Condition ============
src = close
len = input(defval = 128, title = "DZ Length", type = input.integer, minval = 1)
// use_dz = input(false, title="Use Dynamic Zone")
pcntAbove = input(defval = 40, title = "Hi is Above X% of Sample", type = input.float, minval = 0, maxval = 100, step = 1.0)
pcntBelow = input(defval = 60, title = "Lo is Below X% of Sample", type = input.float, minval = 0, maxval = 100, step = 1.0)
smplAbove = percentile_nearest_rank(src, len, pcntAbove)
smplBelow = percentile_nearest_rank(src, len, 100 - pcntBelow)
above = plot(src > smplAbove ? src : smplAbove, title = "Above Line", color = na)
probOB = plot(smplAbove, title = "OB", color = color.green)
probOS = plot(smplBelow, title = "OS", color = color.red)
below = plot(src < smplBelow ? src : smplBelow, title = "Below Line", color = na)
fill(above, probOB, color = #00FF00, transp = 80)
fill(below, probOS, color = #FF0000, transp = 80)
// long_dz = close > smplAbove
// short_dz = close < smplBelow
//============== Entry Conditions =====================
timeframe = input("5D", title="MA16 Resolution", type=input.resolution)
_ma = sma(hlc3, 16)
ma=security(syminfo.tickerid, timeframe, _ma, barmerge.gaps_off, barmerge.lookahead_on)
_ema=ema(hlc3,7)
ema=security(syminfo.tickerid, timeframe, _ema, barmerge.gaps_off, barmerge.lookahead_on)
long = ma[1] > ema[1] ? crossover(ema, ma) : abs(ma - ema)/ma > 0.025 ? crossover(close, ema) : false
short = ma[1] < ema[1] ? crossunder(ema,ma) : abs(ma - ema)/ma > 0.025 ? crossunder(close, ema): false //:crossunder(close, ema)
longEntry = (tradeType == "LONG" or tradeType == "BOTH") and long
shortEntry = (tradeType == "SHORT" or tradeType == "BOTH") and short
//Upon Entry, do this.
if longEntry or shortEntry
entryPrice := ohlc4
entryPrice
//set price points for new orders
use_dz_sl = input(true, title="Use DZ SL")
if isLongOpen
stopLossLevel := use_dz_sl? max(smplAbove, ma) : ema - 0.25*atr_multi_PT* atr(32) //ma
profitTrail = ma + atr_multi_PT* atr(32)
profitPriceLevel := max( (1 + 0.01 * profitPercent_long) * entryPrice, profitTrail)
profitPriceLevel
if isShortOpen
stopLossLevel := use_dz_sl? min(smplBelow, ma) : ema + 0.25*atr_multi_PT* atr(32) //ma
profitTrail = ma - atr_multi_PT* atr(32)
profitPriceLevel := min( (1 - 0.01 * profitPercent_short) * entryPrice, profitTrail)
profitPriceLevel
shortExit = isShortOpen[1] and (isStopLoss or isProfitCatch or longEntry)
longExit = isLongOpen[1] and (isStopLoss or isProfitCatch or shortEntry)
if (longExit or shortExit) and not(longEntry or shortEntry)
trigger := na
profitTrigger := na
entryPrice := na
stopLossLevel := na
profitPriceLevel := na
// highest := na
// lowest := na
// lowest
if testPeriod() and (tradeType == "LONG" or tradeType == "BOTH")
strategy.entry("long", strategy.long, when=longEntry)
strategy.close("long", when=longExit)
if testPeriod() and (tradeType == "SHORT" or tradeType == "BOTH")
strategy.entry("short", strategy.short, when=shortEntry)
strategy.close("short", when=shortExit)
//If the value changed to invoke a buy, lets set it before we leave
isLongOpen := longEntry ? true : longExit == true ? false : isLongOpen
isShortOpen := shortEntry ? true : shortExit == true ? false : isShortOpen
plotshape(isShortOpen, title="Short Open", color=color.red, style=shape.triangledown, location=location.bottom)
plotshape(isLongOpen, title="Long Open", color=color.green, style=shape.triangleup, location=location.bottom)
plotshape(entryPrice ? entryPrice : na, title="Entry Level", color=color.black, style=shape.cross, location=location.absolute)
plotshape(stopLossLevel ? stopLossLevel : na, title="Stop Loss Level", color=color.orange, style=shape.xcross, location=location.absolute)
plotshape(profitPriceLevel ? profitPriceLevel : na, title="Profit Level", color=color.blue, style=shape.xcross, location=location.absolute)
plotshape(profitTrigger[1] ? isProfitCatch : na, title="Profit Exit Triggered", style=shape.diamond, location=location.abovebar, color=color.blue, size=size.small)
plotshape(trigger[1] ? isStopLoss : na, title="Stop Loss Triggered", style=shape.diamond, location=location.belowbar, color=color.orange, size=size.small)
plot(ma, title="MA 16", color=color.yellow)
plot(ema, title="EMA 7", color=color.blue)