Chiến lược phá vỡ nến Ichimoku
Tổng quan
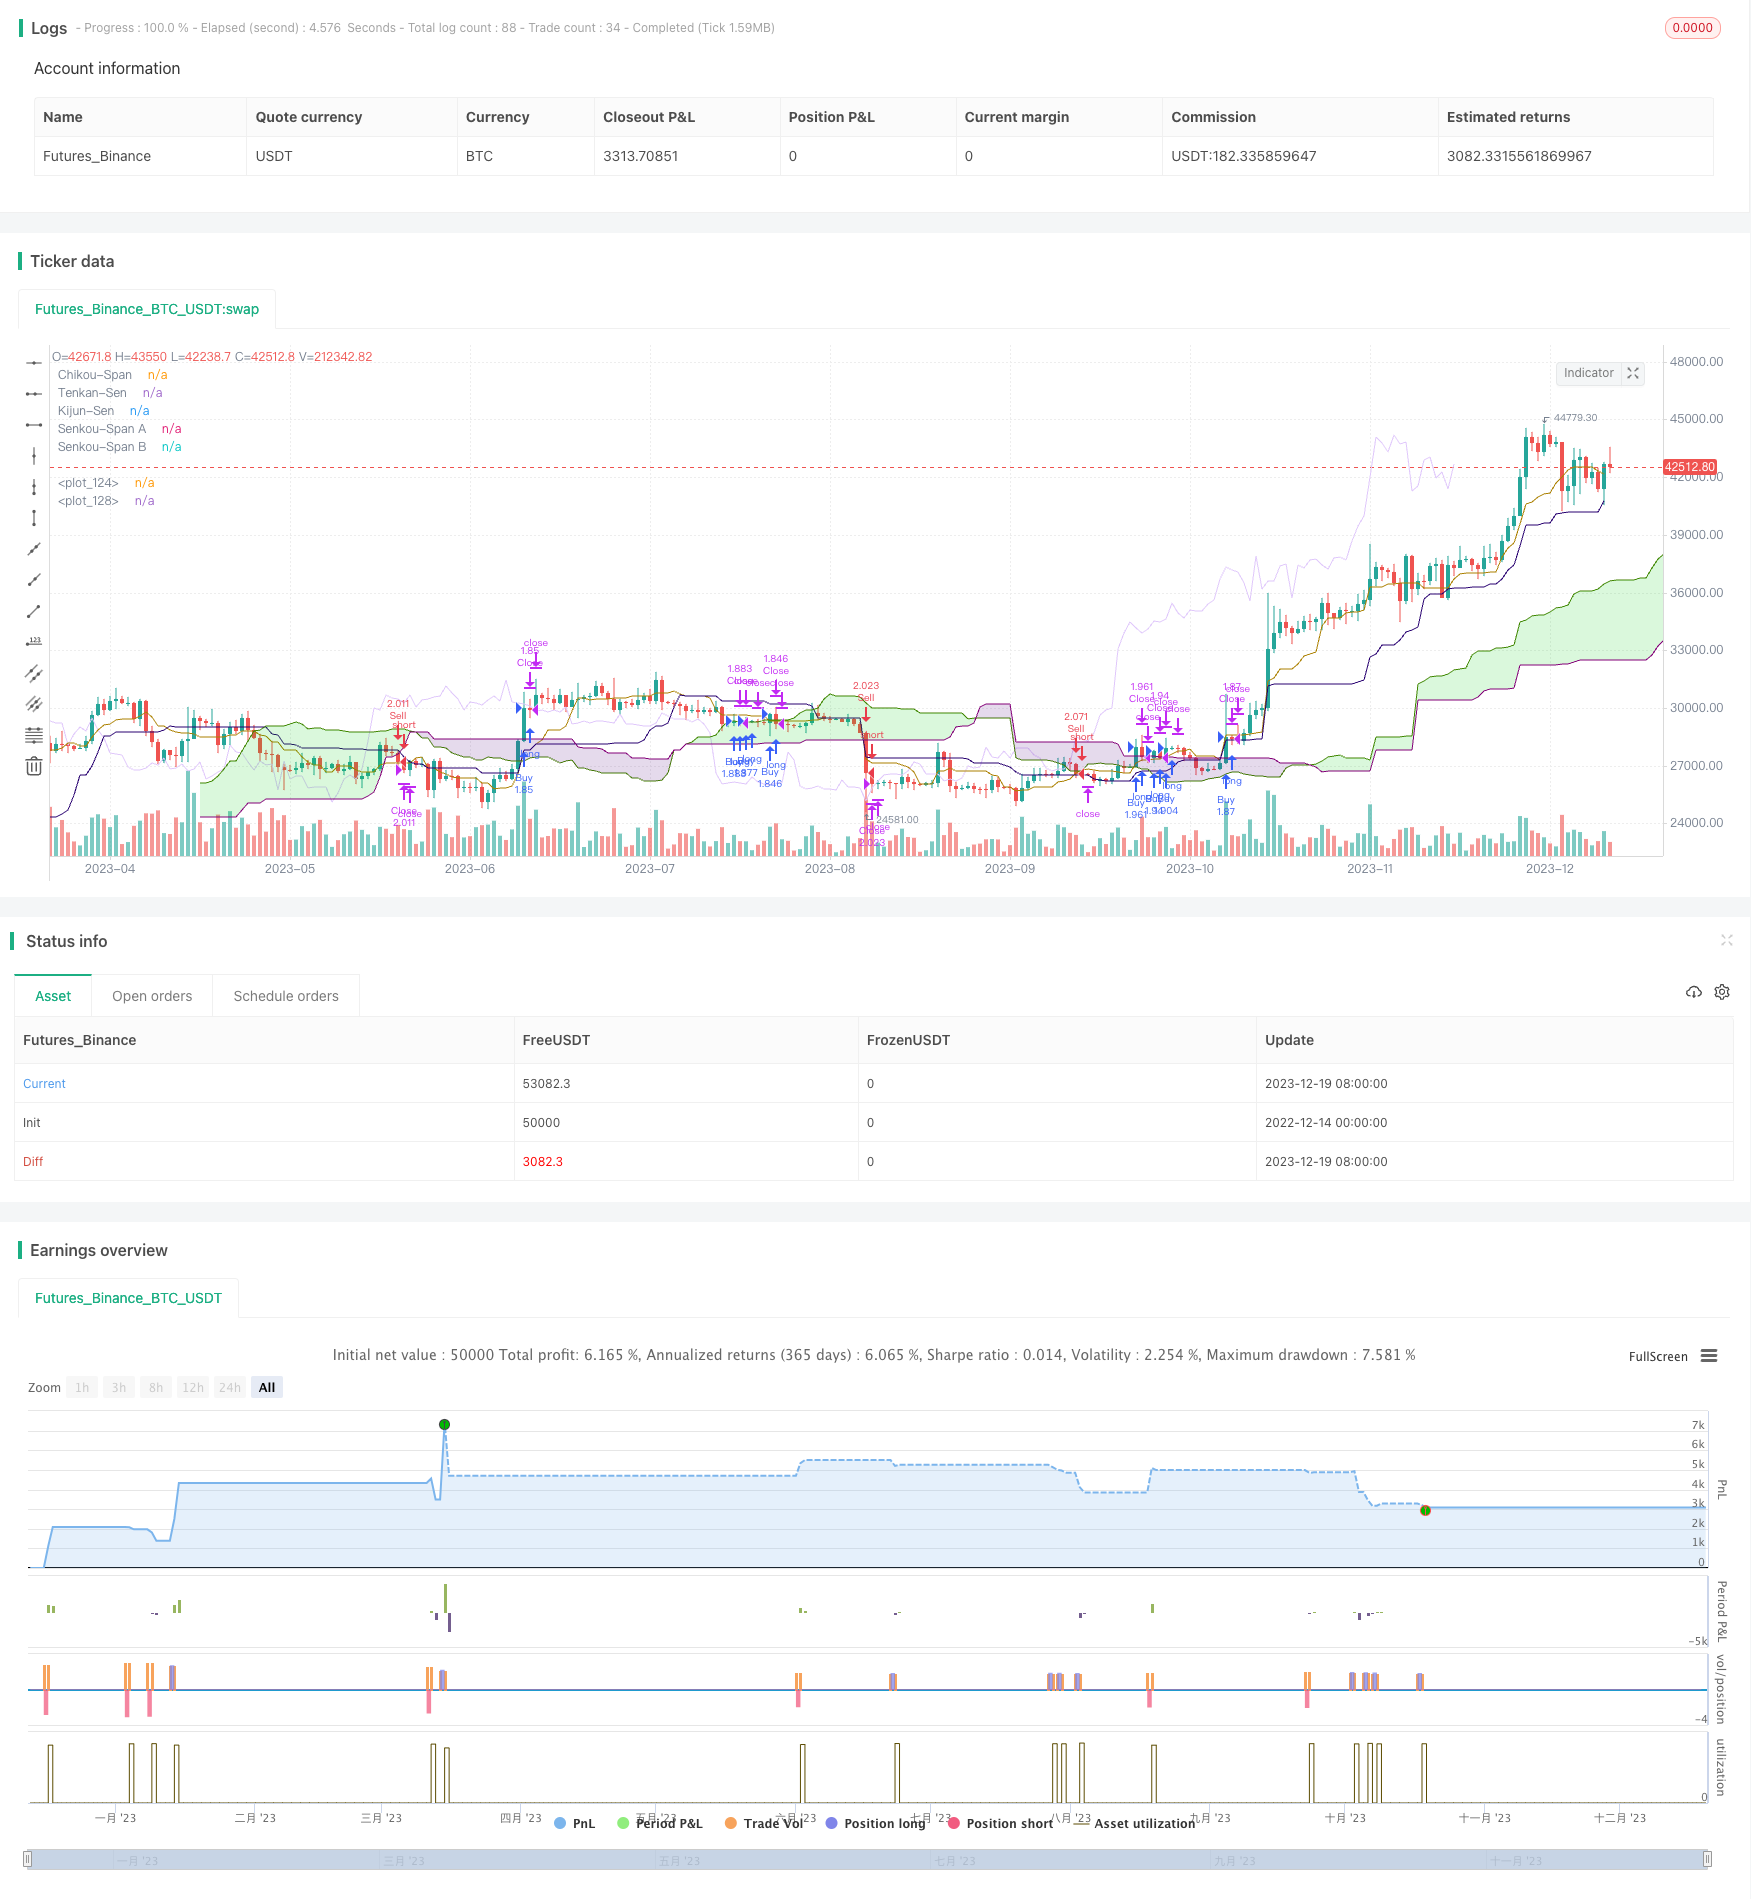
Chiến lược này dựa trên một chỉ số rất nổi tiếng trong phân tích kỹ thuật thị trường, chỉ số Ichimoku Kinko Hyo, sử dụng hình dáng đám mây và mối quan hệ của giá với đám mây để đánh giá xu hướng để phát hiện cơ hội giao dịch.
Nguyên tắc chiến lược
Chiến lược này sử dụng một số thành phần của chỉ số Ichimoku Kinko Hyo, bao gồm đường chuyển đổi ((Tenkan-Sen), đường chuẩn ((Kijun-Sen), đường dẫn đầu ((Senkou Span A), đường dẫn đầu ((Senkou Span B) và đường tụt hậu ((Chikou Span). Các đường này kết hợp để tạo ra cái gọi là đám mây Ichimoku.
Cụ thể, chiến lược để xác định giá có phá vỡ đám mây hay không chủ yếu dựa trên hai đường Senkou Span A và Senkou Span B. Khu vực giữa hai đường này tạo thành đám mây.
Ngoài ra, chiến lược cũng đặt giá dừng và dừng. Sử dụng syminfo.pointvalue và thông tin vị trí chiến lược để tính toán số điểm lỗ và chuyển đổi thành giá cụ thể.
Phân tích lợi thế
Chiến lược này có một số lợi thế:
- Sử dụng chỉ số Ichimoku để đánh giá xu hướng, có thể lọc hiệu quả tiếng ồn thị trường, xác định xu hướng đường dài
- Tạo tín hiệu phá vỡ đám mây để tránh thiệt hại do phá vỡ giả
- Kết hợp với các thiết lập dừng lỗ và dừng lại, bạn có thể hạn chế tổn thất đơn lẻ và khóa lợi nhuận
- Các tham số có thể được điều chỉnh để kiểm tra tác động của các tham số khác nhau đối với hiệu suất chiến lược
- Mây được hình dung và các thành phần khác của Ichimoku tạo thành tín hiệu giao dịch đồ họa trực quan
Phân tích rủi ro
Chiến lược này cũng có một số rủi ro:
- Các nhà đầu tư có thể sẽ mất nhiều tiền nếu họ giữ vị thế trung bình và dài hạn.
- Tín hiệu đột phá có thể bị chậm trễ và bỏ lỡ điểm vào tốt nhất
- Một vụ đột nhập giả có thể gây ra tín hiệu sai và thiệt hại.
- Thời gian nắm giữ quá dài, chi phí dẫn xuất cao
- Giá dừng và giá dừng được thiết lập có thể bị phá vỡ
Phản ứng:
- Giảm thời gian nắm giữ để giảm rủi ro lỗ hổng
- Kết hợp với các chỉ số khác để đánh giá hiệu quả của tín hiệu đột phá
- Tăng hiệu quả của hệ thống chống hư hỏng, tránh bị mắc kẹt
- Tối ưu hóa thời hạn giữ và giảm chi phí
Hướng tối ưu hóa
Chiến lược này có thể được tối ưu hóa theo các khía cạnh sau:
- Kiểm tra các tổ hợp tham số khác nhau để tìm ra tham số tối ưu
- Kiểm tra tín hiệu kết hợp với các chỉ số khác để tránh đột phá giả
- Hoạt động điều chỉnh mức dừng lỗ, trails stop loss
- Các điều kiện thoát tùy chỉnh: Đột phá tín hiệu đảo ngược đám mây, kích hoạt giá rút lui
- Thêm cơ chế quản lý vị trí
Tóm tắt
Chiến lược phá vỡ đường nắng mặt trời của Ichimoku nói chung là một chiến lược phá vỡ điển hình sử dụng chỉ số Ichimoku Kinko Hyo để xác định hướng xu hướng đường dài. Nó có các ưu điểm như khả năng điều chỉnh tham số, hình dạng trực quan, tín hiệu trực quan, cũng có một số rủi ro phá vỡ giả, rủi ro giữ vị trí.
/*backtest
start: 2022-12-14 00:00:00
end: 2023-12-20 00:00:00
period: 1d
basePeriod: 1h
exchanges: [{"eid":"Futures_Binance","currency":"BTC_USDT"}]
*/

//@version=5
// This source code is subject to the terms of the Mozilla Public License 2.0 at https://mozilla.org/MPL/2.0/
// © moneyofthegame
// Basado en estrategias con el indicador ICHIMOKU KINKO HIYO
// El tiempo es oro colega :)

//@version=5
strategy('Ichimoku Cloud Estrategia Ruptura Nubes SWING TRADER  (By Insert Cheese)', shorttitle='Ichimoku Cloud Estrategia Ruptura Nubes SWING TRADER  (By Insert Cheese)',

         overlay=true,
         initial_capital=500,
         process_orders_on_close=true,
         default_qty_type=strategy.percent_of_equity,
         default_qty_value=100,
         commission_type=strategy.commission.percent,
         commission_value=0.05,
         currency=currency.NONE)


// Inputs: Ichimoku parametros
ts_bars =   input.int(9,  minval=1, title='Tenkan-Sen ',          group='Parámetros Ichimoku')
ks_bars =   input.int(26, minval=1, title='Kijun-Sen ',           group='Parámetros Ichimoku')
ssb_bars =  input.int(52, minval=1, title='Senkou-Span B ',       group='Parámetros Ichimoku')
cs_offset = input.int(26, minval=1, title='Chikou-Span',          group='Parámetros Ichimoku')
ss_offset = input.int(26, minval=1, title='Senkou-Span A',        group='Parámetros Ichimoku')

middle(len) => // LONGITITUD Ichimoku (SenkouB)
    math.avg(ta.lowest(len), ta.highest(len))

// Ichimoku Componentes
tenkan = middle (ts_bars)
kijun   = middle (ks_bars)
senkouA = math.avg(tenkan, kijun)
senkouB = middle (ssb_bars)


// Plot Ichimoku Kinko Hyo
plot(tenkan,                                     color=color.rgb(171, 128, 0),                              title="Tenkan-Sen",    display = display.none)
plot(kijun,                                      color=color.rgb(39, 0, 112),                               title="Kijun-Sen",     display = display.none)
plot(close, offset=-cs_offset+1,                 color=color.rgb(224, 200, 251),                            title="Chikou-Span",   display = display.none)
sa=plot(senkouA, offset=ss_offset-1,             color=color.rgb(68, 128, 0),                               title="Senkou-Span A", display = display.none)
sb=plot(senkouB, offset=ss_offset-1,             color=color.rgb(131, 0, 120),                              title="Senkou-Span B", display = display.none)
fill(sa, sb, color = senkouA > senkouB ?         color.rgb(0, 211, 11, 82) : color.rgb(75, 0, 126, 82),   title="Cloud color")

// Calculating
ss_high = math.max(senkouA[ss_offset - 1], senkouB[ss_offset - 1])  //parte alta de la nube
ss_low = math.min(senkouA[ss_offset - 1], senkouB[ss_offset - 1])   //parte baja de la nube
ss_medium = ss_low + (ss_high - ss_low) / 2                         //parte intermedia


// Input para seleccionar largos o cortos
long_entry_enable =  input.bool(true, title='Entradas Largo',   group='Backtest Operativa', inline='SP20')
short_entry_enable = input.bool(true, title='Entradas Corto',   group='Backtest Operativa', inline='SP20')

// Input backtest rango de fechas
fromMonth =  input.int  (defval=1,     title='Desde Mes',  minval=1,     maxval=12,      group='Backtest rango de fechas')
fromYear  =  input.int  (defval=2000,  title='Desde Año',  minval=1970,                  group='Backtest rango de fechas')
fromDay   =  input.int  (defval=1,     title='Desde Día',  minval=1,     maxval=31,      group='Backtest rango de fechas')
thruDay   =  input.int  (defval=1,     title='Hasta Día',  minval=1,     maxval=31,      group='Backtest rango de fechas')
thruMonth =  input.int  (defval=1,     title='Hasta Mes',  minval=1,     maxval=12,      group='Backtest rango de fechas')
thruYear  =  input.int  (defval=2099,  title='Hasta Año',  minval=1970,                  group='Backtest rango de fechas')

inDataRange = time >= timestamp(syminfo.timezone, fromYear, fromMonth, fromDay, 0, 0) and time < timestamp(syminfo.timezone, thruYear, thruMonth, thruDay, 0, 0)


//Estrategia

// Señales de entrada y salida

price_above_kumo = close  > ss_high // precio cierra arriba de la nube
price_below_kumo = close  < ss_low // precio cierra abajo de la nube
price_cross_above_kumo = ta.crossover  (close  , ss_high )   //precio cruza la nube parte alta
price_cross_below_kumo = ta.crossunder (close  , ss_low )     // precio cruza la nube parte baja

bullish = (price_above_kumo and price_cross_above_kumo)
bearish = (price_below_kumo and price_cross_below_kumo)

comprado = strategy.position_size > 0
vendido = strategy.position_size  < 0

sl_long =  price_above_kumo
sl_short = price_below_kumo


if ( not comprado and bullish and inDataRange and long_entry_enable)
//realizar compra
    strategy.entry("Buy", strategy.long)

//realizar salida long
if (comprado and bearish and inDataRange and long_entry_enable)
    strategy.close ("Buy", comment = "cerrado")

if ( not vendido and bearish and inDataRange and short_entry_enable)
//realizar venta
    strategy.entry("Sell", strategy.short)

//realizar salida long
if (vendido  and bullish and inDataRange and short_entry_enable)
    strategy.close ("Buy", comment = "cerrado")

// Función Calcular TP y SL

// Inputs para SL y TP


tpenable = input.bool(true, title =  "SL y TP metodo")


moneyToSLPoints(money)  =>
    strategy.position_size !=0 and tpenable ?  (money / syminfo.pointvalue / math.abs (strategy.position_size)) / syminfo.mintick : na

p = moneyToSLPoints(input.float(  100.0, minval=0.1, step=10.0, title = "Take Profit $$"))
l = moneyToSLPoints(input.float(  100.0, minval=0.1, step=10.0, title = "Stop Loss $$"))
strategy.exit("Close", profit = p, loss = l)


// debug plots for visualize SL & TP levels
pointsToPrice(pp) =>
    na(pp) ? na : strategy.position_avg_price + pp * math.sign(strategy.position_size) * syminfo.mintick

pp = plot(pointsToPrice(p),color = color.rgb(76, 175, 79, 96), style = plot.style_linebr )
lp = plot(pointsToPrice(-l),color = color.rgb(76, 175, 79, 96), style = plot.style_linebr )
avg = plot( strategy.position_avg_price, color = color.rgb(76, 175, 79, 96), style = plot.style_linebr )
fill(pp, avg, color = color.rgb(76, 175, 79, 96))
fill(avg, lp, color = color.rgb(255, 82, 82, 97))