Chiến lược theo dõi xu hướng K-line cuối cùng
Tổng quan
Chiến lược K-line cuối cùng là một chiến lược theo dõi xu hướng, nó phân tích mối quan hệ giữa giá đóng cửa và giá mở cửa của K-line cuối cùng để đánh giá xu hướng thị trường và tạo ra tín hiệu giao dịch.
Nguyên tắc chiến lược
Lập luận cốt lõi của chiến lược này là:
- Tính toán giá mở và giá đóng của dòng K cuối cùng
- Nếu giá mở cửa thấp hơn giá đóng cửa, đánh giá là xu hướng tăng, tạo ra tín hiệu mua
- Nếu giá mở cửa cao hơn giá đóng cửa, đánh giá là xu hướng giảm, tạo ra tín hiệu bán
- Đặt lệnh mua hoặc bán tùy theo tín hiệu giao dịch phát sinh
- Thiết lập giá dừng và dừng, chiến lược thoát ra
Cụ thể, chiến lược này được xác định theo hướng xu hướng bằng cách yêu cầu dữ liệu giá mở và giá đóng của dòng K cuối cùng. Nếu xu hướng tăng, hãy mở đơn với giá thị trường khi K kết thúc; Nếu xu hướng giảm, hãy mở đơn với giá thị trường khi K kết thúc.
Sau đó, đặt giá dừng và dừng. Giá dừng của nhiều lệnh là giá mở của đường K nhân với một hệ số, giá dừng là giá đóng hiện tại. Trái lại.
Phân tích lợi thế
- Lập luận chiến lược đơn giản, rõ ràng, dễ hiểu và thực hiện
- Capture (CAPTURE) sử dụng đường K cuối cùng để đánh giá xu hướng, và Capture (CAPTURE) sử dụng đường K cuối cùng để đánh giá xu hướng thay đổi giá gần đây
- Có cả Stop Loss và Stop Stop để hạn chế rủi ro giảm giá
Phân tích rủi ro
- Dòng K cuối cùng có thể có hồi âm hoặc rung, tăng khả năng của whipsaw
- Chỉ cần đánh giá xu hướng dựa trên đường K cuối cùng có thể bị lắp đặt nên kết hợp với các chỉ số xu hướng
- Dữ liệu phản hồi không đầy đủ có thể dẫn đến quá phù hợp
Có thể giảm rủi ro bằng cách kết hợp các chỉ số xu hướng xác nhận, tối ưu hóa logic dừng lỗ, mở rộng chu kỳ đo đạc và môi trường thị trường.
Hướng tối ưu hóa
- Có thể kết hợp MA, MACD và các chỉ số khác để lọc thời gian nhập cảnh
- Có thể thiết lập mức dừng lỗ theo ATR
- Có thể đưa vào mô hình học máy để xác định xu hướng
- Có thể tối ưu hóa các chiến lược dừng lỗ như di chuyển dừng lỗ, ngăn chặn hàng loạt
Tóm tắt
Chiến lược đường K cuối cùng là một chiến lược theo dõi xu hướng đơn giản. Nó nhanh chóng đánh giá xu hướng và giao dịch thông qua đường K cuối cùng. Lý luận của chiến lược đơn giản, dễ thực hiện, phù hợp với tư duy theo dõi xu hướng.
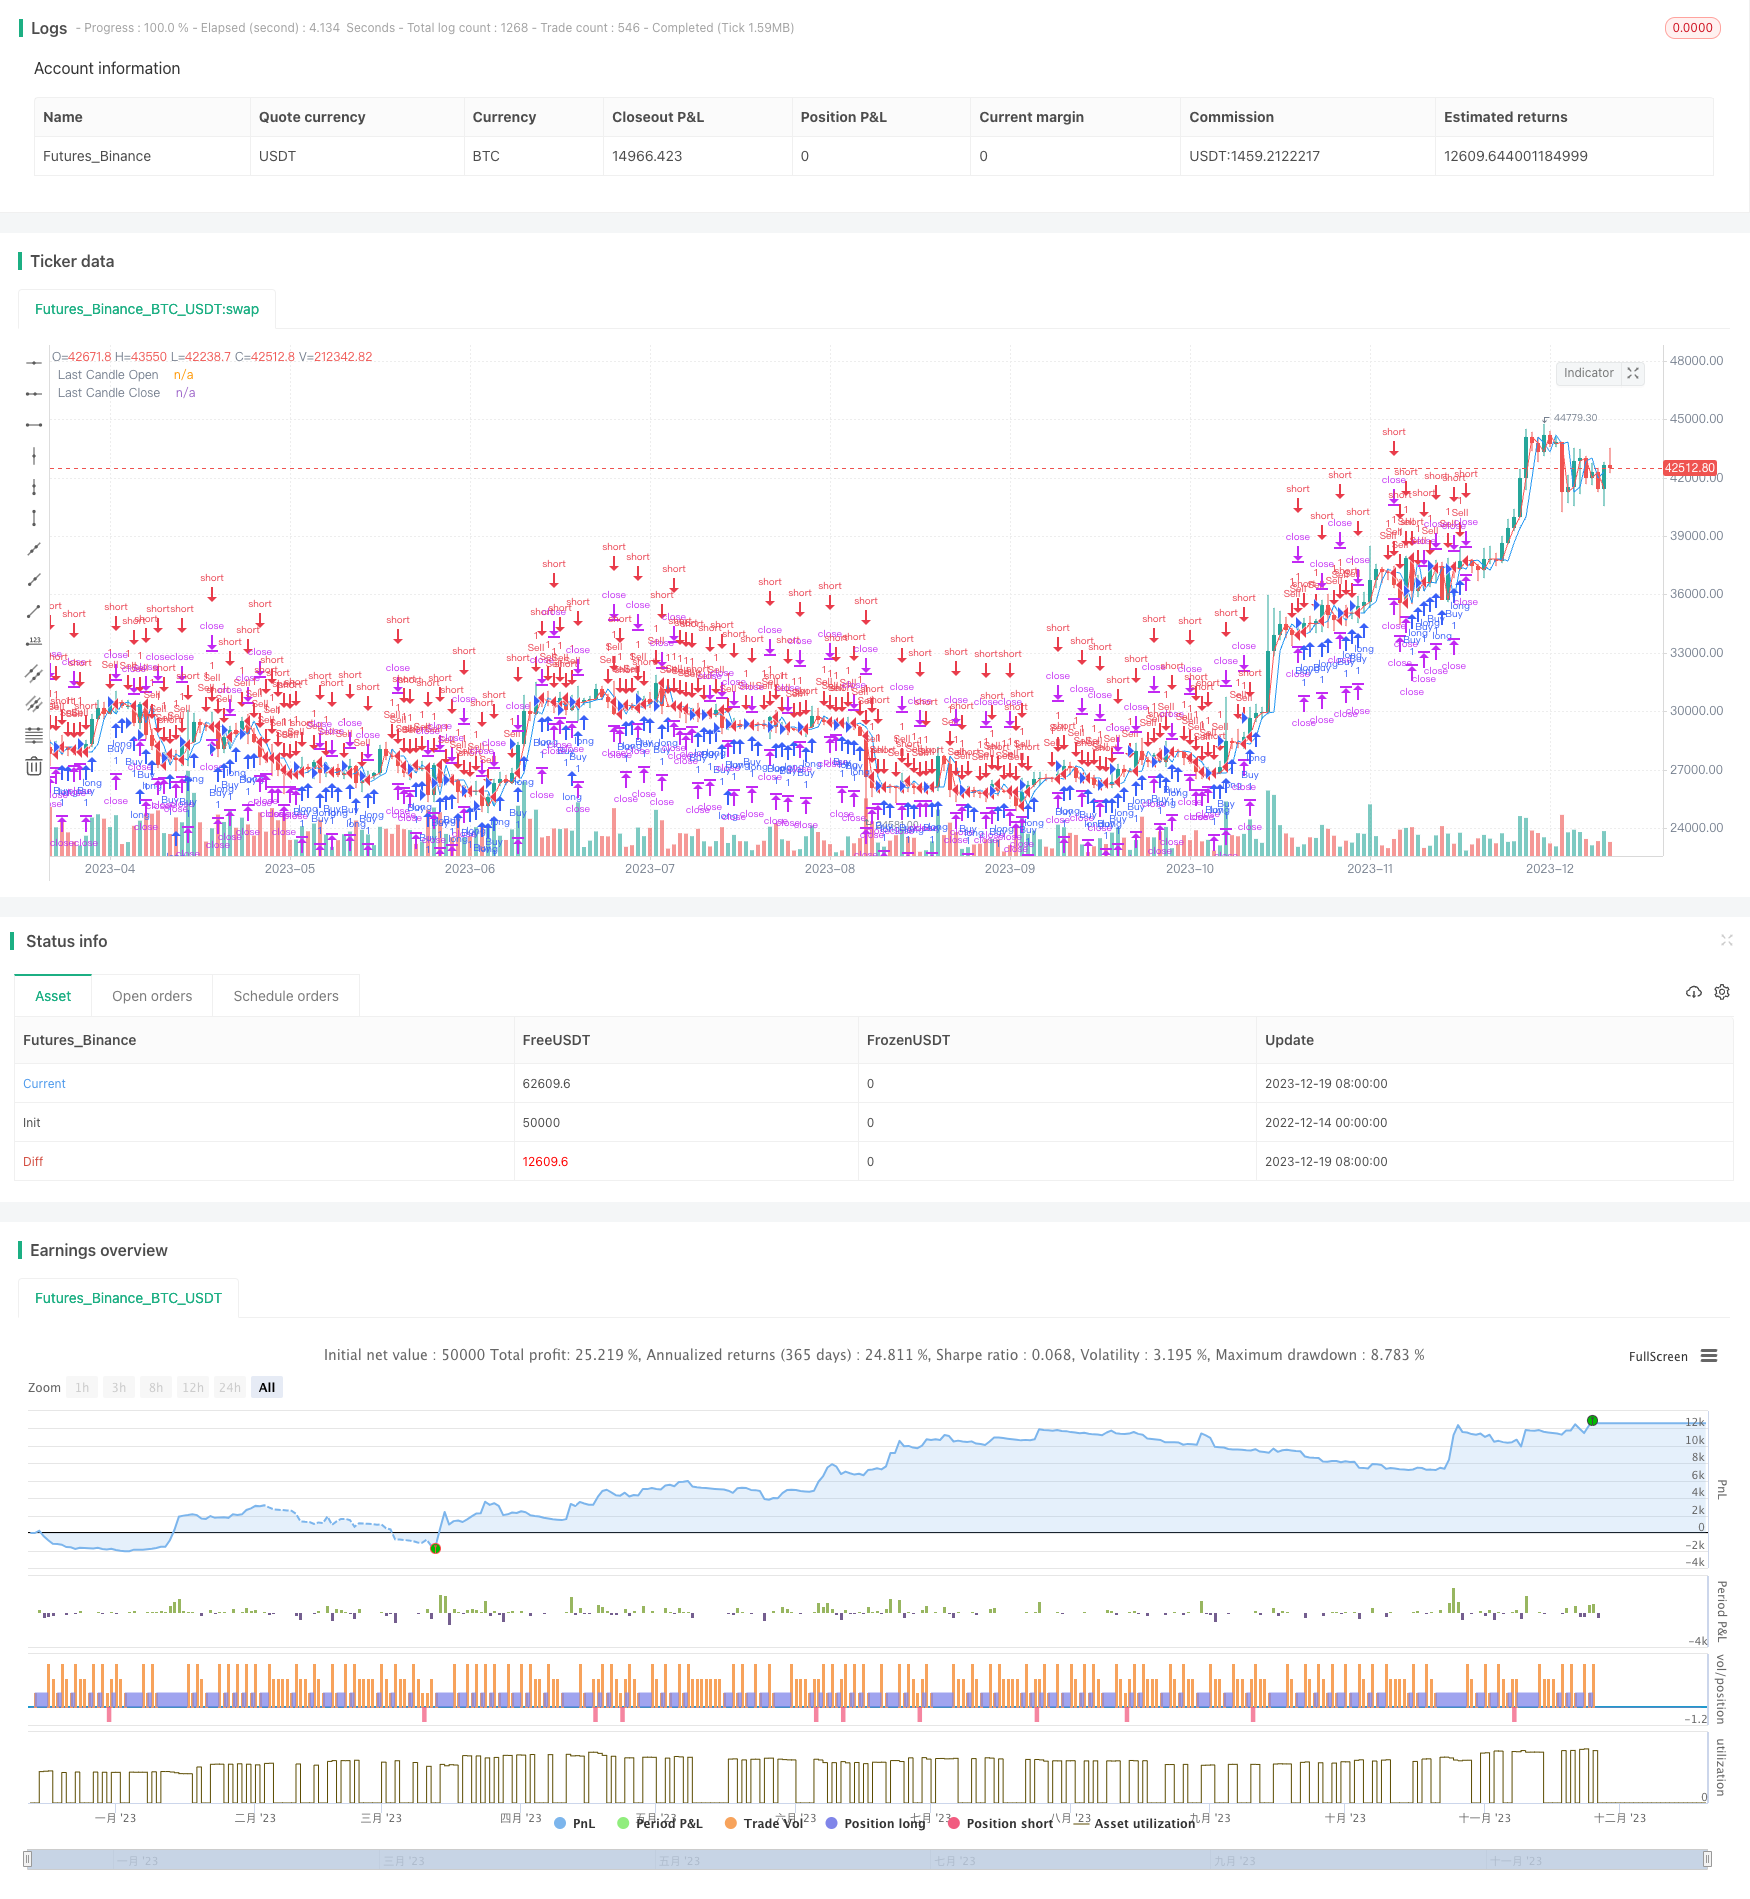
/*backtest
start: 2022-12-14 00:00:00
end: 2023-12-20 00:00:00
period: 1d
basePeriod: 1h
exchanges: [{"eid":"Futures_Binance","currency":"BTC_USDT"}]
*/

//@version=5
strategy("Last Candle Strategy with Date Range", overlay=true)

// Define the start and end dates for the backtest
startDate = timestamp(2015, 01, 01, 00, 00)
endDate = timestamp(2023, 11, 24, 23, 59)

// Check if the current bar is within the specified date range
withinDateRange = time >= startDate and time <= endDate

// If outside the date range, skip the strategy logic
if (not withinDateRange)
    strategy.close_all()

// Calculate the opening and closing values for the last candle
lastCandleOpen = request.security(syminfo.tickerid, "D", open[1], lookahead=barmerge.lookahead_on)
lastCandleClose = request.security(syminfo.tickerid, "D", close[1], lookahead=barmerge.lookahead_on)

// Determine the trade direction based on the last candle
tradeDirection = lastCandleOpen < lastCandleClose ? 1 : -1  // 1 for buy, -1 for sell

// Plot the last candle's opening and closing values on the chart
plot(lastCandleOpen, color=color.blue, title="Last Candle Open")
plot(lastCandleClose, color=color.red, title="Last Candle Close")

// Execute strategy orders
if (withinDateRange)
    if (tradeDirection == 1)
        strategy.entry("Buy", strategy.long)

    if (tradeDirection == -1)
        strategy.entry("Sell", strategy.short)

// Set stop loss and take profit
stopLoss = 0.01 * lastCandleOpen
takeProfit = close

// Exit strategy
strategy.exit("StopLoss/Profit", from_entry="Buy", loss=stopLoss, profit=takeProfit)
strategy.exit("StopLoss/Profit", from_entry="Sell", loss=stopLoss, profit=takeProfit)