Mô hình đột phá đáy đôi cho chiến lược động lượng
Tổng quan
Chiến lược này dựa trên mô hình hai đáy của chỉ số kỹ thuật, tìm kiếm tín hiệu đột phá hình dạng hai đáy được hình thành ở khu vực đáy khi thị trường ở trạng thái quá bán để thực hiện giao dịch mua. Chiến lược này kết hợp nhiều chỉ số đồng thời đánh giá tình trạng quá bán và quá mua của thị trường, phát ra tín hiệu mua khi hình thành hai đáy. Chiến lược này chủ yếu áp dụng cho giao dịch đường ngắn trung bình.
Nguyên tắc chiến lược
Chiến lược này chủ yếu đánh giá liệu giá có hình thành hai đáy gần mức hỗ trợ quan trọng hay không và liệu thị trường có đang bán quá mức hay không. Cụ thể, chiến lược sử dụng các chỉ số sau để đánh giá:
Chỉ số RSI: Khi chỉ số RSI cho thấy thị trường đang bán tháo, nó được coi là tín hiệu mua.
Chỉ số RVI: Khi chỉ số RVI cho thấy thị trường đang bán tháo, nó được coi là tín hiệu mua.
Chỉ số MFI: Khi chỉ số MFI cho thấy thị trường đang bán tháo, nó được coi là tín hiệu mua.
Chỉ số SAR: Khi giá tăng vượt qua chỉ số SAR, coi đó là tín hiệu mua.
Chỉ số SMA500: Khi giá tăng vượt qua chỉ số SMA500, được coi là tín hiệu mua.
Chiến lược này tổng hợp kết quả phán đoán của nhiều chỉ số trên và phát ra tín hiệu mua khi hình thành hình dạng hai đáy gần các mức hỗ trợ quan trọng.
Lợi thế chiến lược
Chiến lược này có những ưu điểm sau:
Kết hợp nhiều chỉ số để đánh giá tình trạng thị trường, tín hiệu sẽ đáng tin cậy hơn.
Một tín hiệu mua được phát ra khi hình thành hai đáy, có xác suất lợi nhuận cao hơn.
Sử dụng các chỉ số kết hợp để đánh giá tình trạng quá bán quá mua, tránh bỏ lỡ thời điểm mua.
Phương pháp này kết hợp mô hình phá vỡ hai đáy với chiến lược chỉ số, kết hợp các lợi ích của theo dõi xu hướng và giao dịch đảo ngược.
Các tham số chiến lược có thể được tối ưu hóa và điều chỉnh theo thị trường khác nhau.
Rủi ro chiến lược
Chiến lược này cũng có những rủi ro sau:
Tỷ lệ tín hiệu giả của chỉ số dẫn đến rủi ro mua thua lỗ. Bạn có thể giảm tín hiệu giả bằng cách tối ưu hóa tham số.
Rủi ro không thành công trong việc phá vỡ. Bạn có thể đặt điểm dừng để giảm tổn thất đơn lẻ.
Các tham số có chiều cao rất khó tối ưu hóa, cần có nhiều dữ liệu lịch sử để hỗ trợ. Có thể tối ưu hóa từng bước bằng thuật toán tiến bộ.
Hiệu quả của đĩa cứng có thể khác nhau tùy thuộc vào hiệu quả thử nghiệm dữ liệu lịch sử.
Hướng tối ưu hóa
Các hướng tối ưu hóa chính của chiến lược bao gồm:
Tối ưu hóa trọng lượng của chỉ số mua để xác định sự kết hợp trọng lượng tối ưu.
Tối ưu hóa tham số chỉ số, xác định sự kết hợp tham số tốt nhất.
Thêm chiến lược dừng lỗ để giảm tổn thất đơn lẻ.
Thêm một mô-đun quản lý vị trí để tạo ra lợi nhuận ổn định hơn.
Kết hợp các thuật toán học máy để xây dựng cơ chế tối ưu hóa tham số thích ứng.
Tóm tắt
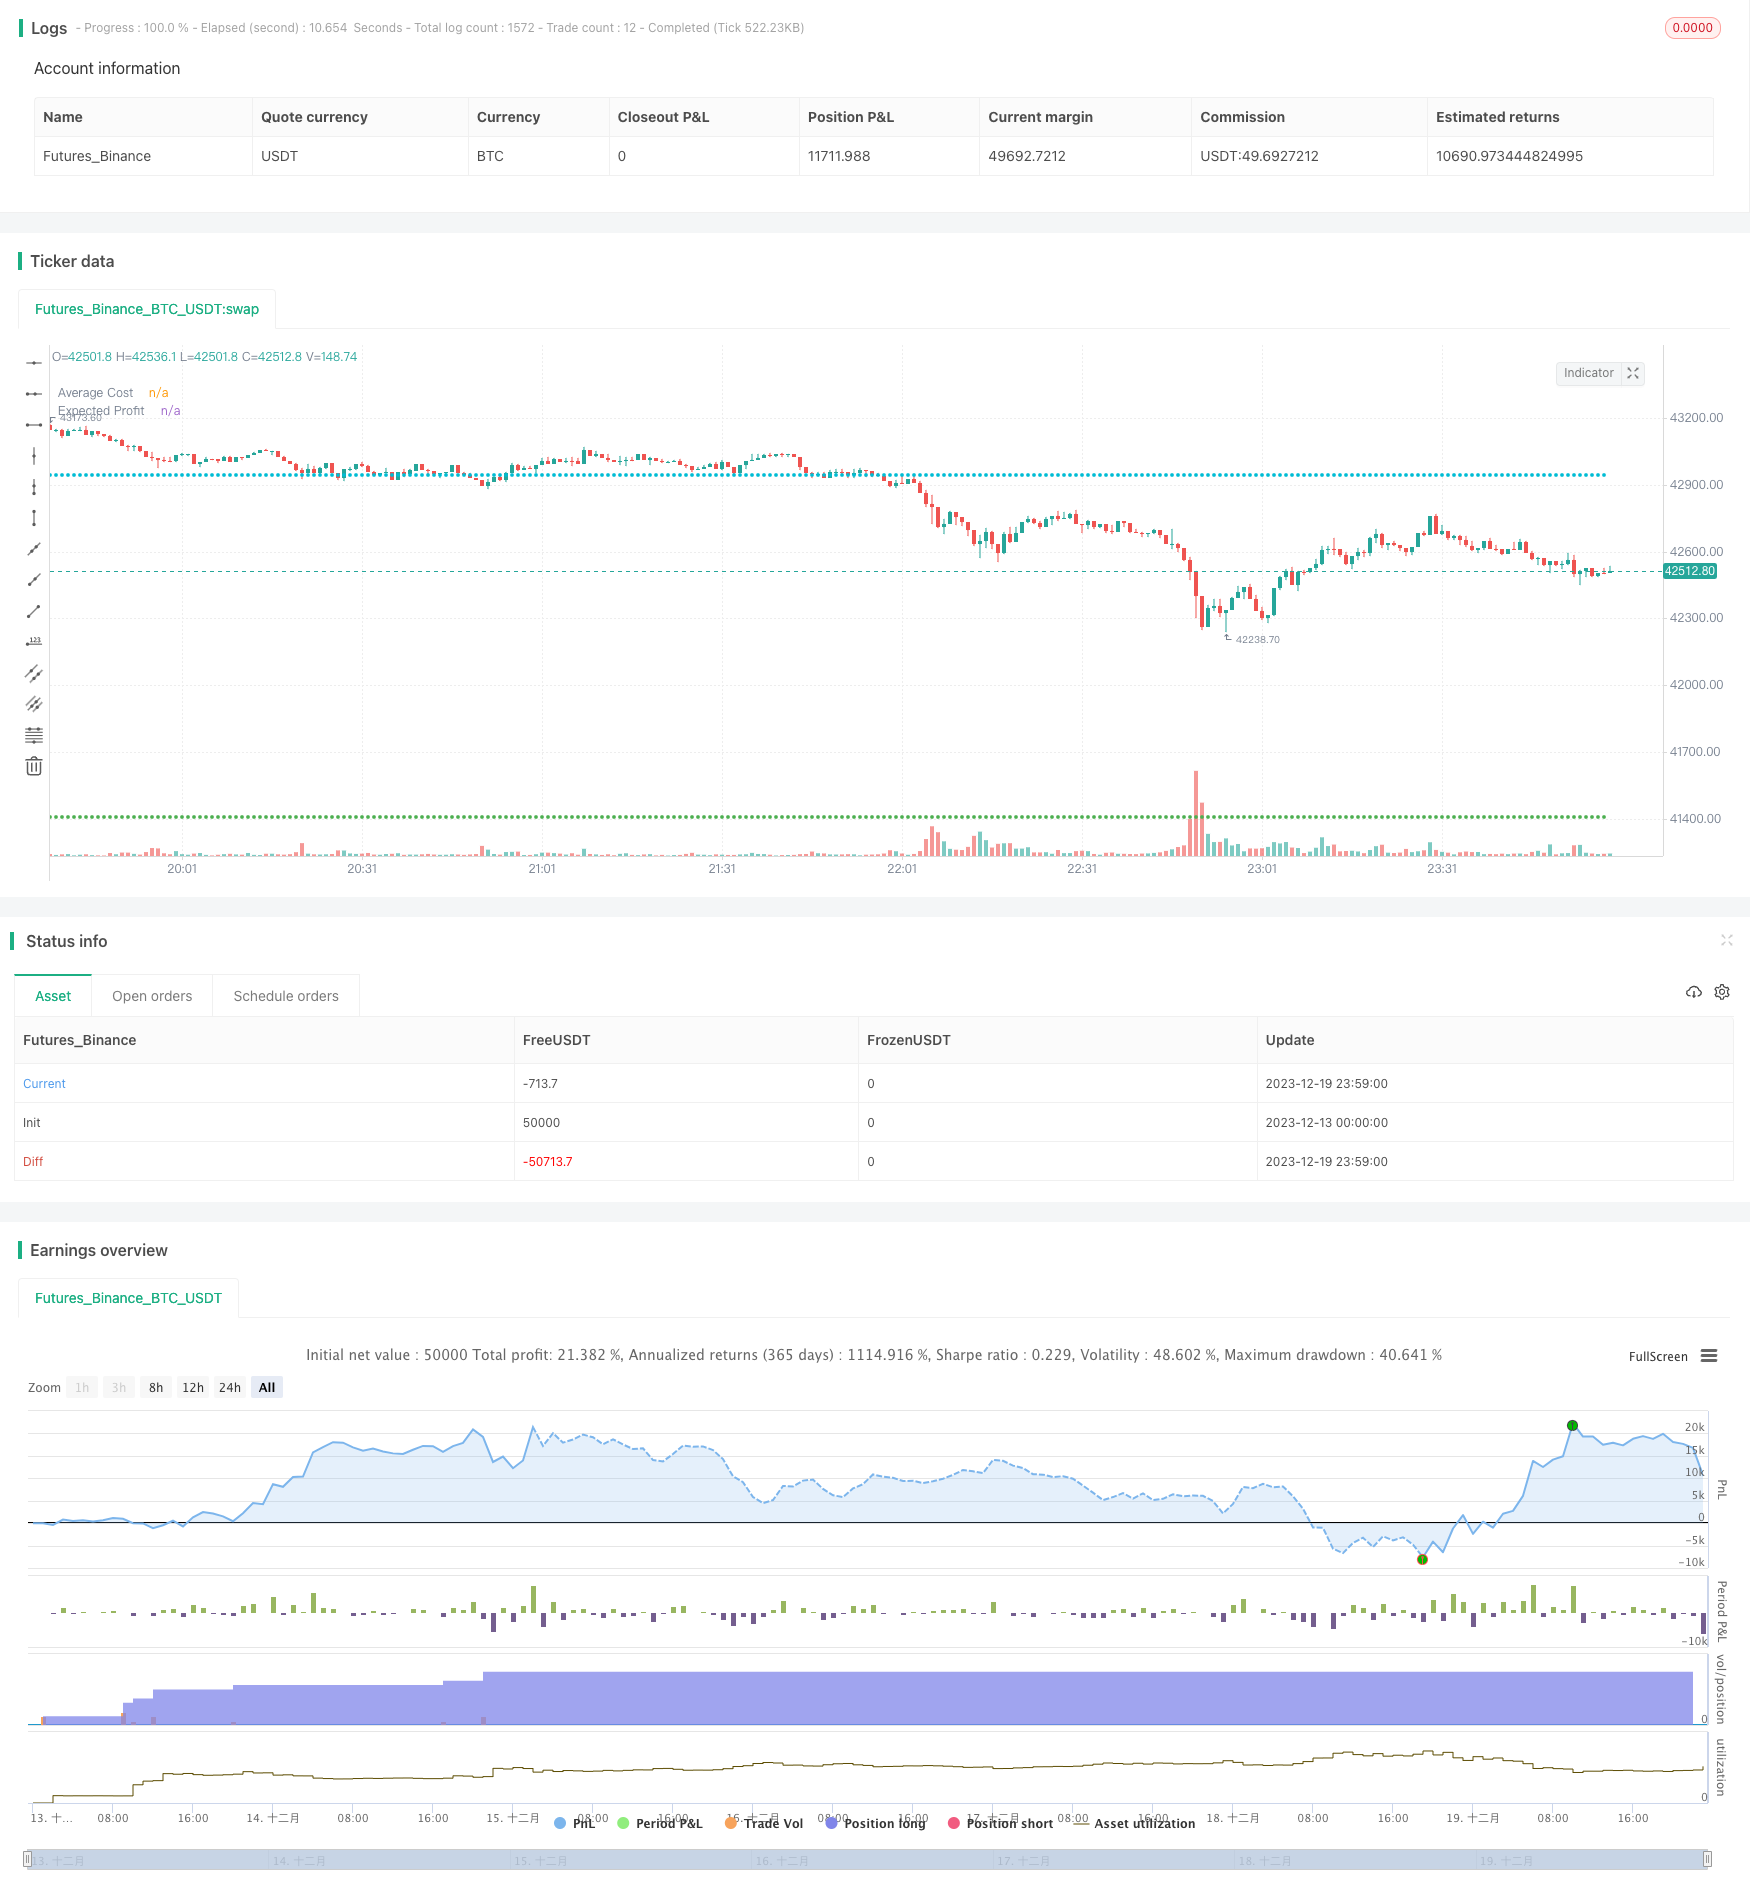
Chiến lược này tích hợp mô hình phá vỡ hai đáy với phán đoán chỉ số bán tháo, phát ra tín hiệu mua khi hình thành hai đáy gần mức hỗ trợ quan trọng. Không gian tối ưu hóa lớn, có thể điều chỉnh trọng lượng, tham số, dừng lỗ, vị trí, v.v. làm cho chiến lược ổn định và đáng tin cậy hơn. Có giá trị thực tế cao hơn.
/*backtest
start: 2023-12-13 00:00:00
end: 2023-12-20 00:00:00
period: 1m
basePeriod: 1m
exchanges: [{"eid":"Futures_Binance","currency":"BTC_USDT"}]
*/


//@version=5

strategy("UP & DOWN -  BNB/USDT 15min", shorttitle="U&D - BNB 15min", overlay=true, calc_on_order_fills=true, calc_on_every_tick=true, initial_capital = 1000,pyramiding = 40,backtest_fill_limits_assumption = 1, process_orders_on_close=true, currency = currency.USD, default_qty_type = strategy.cash, default_qty_value = 25, commission_type = strategy.commission.percent, commission_value = 0.1)

// This startergy optimized to BNB 15 min standerd candlestic chart and buy & sell signals were based on technical analysis.

UP_DOWN = input.string( title='Trade in', options=['Only on Up Trends', 'Uptrend and down trend'], defval='Uptrend and down trend')
var profit_cal = input.float( defval = 3.7, title = "Expected profit %", minval = 0.2, step = 0.1)

//Backtest dates
fromMonth = input.int(defval = 10,title = "From Month", minval = 1, maxval = 12, group = 'Time Period Values')
fromDay   = input.int(defval = 1,    title = "From Day", minval = 1, maxval = 31, group = 'Time Period Values')
fromYear  = input.int(defval = 2021, title = "From Year", minval = 1970, group = 'Time Period Values')
thruMonth = input.int(defval = 1,    title = "Thru Month", minval = 1, maxval = 12, group = 'Time Period Values')
thruDay   = input.int(defval = 1,    title = "Thru Day", minval = 1, maxval = 31, group = 'Time Period Values')
thruYear  = input.int(defval = 2112, title = "Thru Year", minval = 1970, group = 'Time Period Values')

//showDate  = input(defval = true, title = "Show Date Range", group = 'Time Period Values')

start     = timestamp(fromYear, fromMonth, fromDay, 00, 00)        // backtest start window
finish    = timestamp(thruYear, thruMonth, thruDay, 23, 59)        // backtest finish window
window()  => true

// inputs
//Inputs of SAR Indicator
sar1 = input.float(defval=0.0002, title='SAR value 1',step=0.0001, group = 'SAR Values')
sar2 = input.float(defval=0.0004, title='SAR value 2',step=0.0001, group = 'SAR Values')
sar3 = input.float(defval=0.1, title='SAR value 3',step=0.1, group = 'SAR Values')
src_close = input(close, "SAR Source - close", group = 'SAR Values')
src_open = input(open, "SAR Source - open", group = 'SAR Values')
bool sar_visible = input(false, "Show SAR",group = 'SAR Values' )
// Inputs of Super trend indicator
ST_T = input.int(defval=16, title = 'Supertrend - Trend', step =1, group = 'Super Trend')
ST_D = input.int(defval=7, title = 'Supertrend - Direction', step =1, group = 'Super Trend')
ST_SMA = input.int(defval=1, title = 'Supertrend - SMA', step = 1, group = 'Super Trend')
bool ST_visible = input(false, "Show Super Trend",group = 'Super Trend' )
//Inputs of SMA500 indicator
src_sma500 = input(high, 'SMA500 - Source', group = 'SMA500')
lb_sma500 = input.int(defval = 143, title = 'SMA500 - Look back period', step=10, group = 'SMA500')
bool sma500_visible = input(false, "Show SMA500",group = 'SMA500' )


// Calculations
// SMA500 Indicator
SMA500 = ta.sma(src_sma500,lb_sma500)
SMA700 = ta.sma(close,700)
SMA_Open = ta.sma(open,9)
//SMA9 Indicator
SMA9 = ta.sma((high+low)/2,5)
risingSMA9 = ta.rising(SMA9,1)
fallingSMA9 = ta.falling(SMA9,1)
color  plotcolor1 = color.black
if risingSMA9
    plotcolor1 := color.green

// SAR Indicator
sar = ta.sar(sar1, sar2, sar3)
sma2_close = ta.sma(src_close,1)
sma2_open = ta.sma(src_open,1)

//Supertrend
[supertrend, direction] = ta.supertrend(ST_T, ST_D)
up_trend = ta.sma(direction < 0 ? supertrend : na,ST_SMA)
down_trend = ta.sma(direction < 0? na : supertrend, ST_SMA)

// Color change
color  plotcolor2 = color.green
if open>down_trend or close>down_trend
    plotcolor2 := color.lime
if open<down_trend or close<down_trend
    plotcolor2 := color.red

color plotcolor3 = color.green
if open>up_trend or close>up_trend
    plotcolor3 := color.yellow
if open<up_trend or close<up_trend
    plotcolor3 := color.red

color plotcolor4 = color.black
if (open>sar or close>sar)
    plotcolor4 := color.white
if (open<sar or close<sar)
    plotcolor4 := color.red

color plotcolor5 = color.black
if (open>SMA500 or close>SMA500)
    plotcolor5 := color.green
if (open<SMA500 or close<SMA500)
    plotcolor5 := color.red

color plotcolor6 = color.green
rising_taalma = ta.rising (ta.alma(open,10,.99,1),1)
falling_taalma = ta.falling (ta.alma(open,10,.99,1),1)

if rising_taalma
    plotcolor6 := color.green
if falling_taalma
    plotcolor6 := color.red

// buy and sell conditions for uptrend

longCondition1 = (open >= down_trend or high>= down_trend or ta.crossover(open,down_trend)or ta.crossover(high,down_trend))
longCondition2 = (open >= up_trend or high>= up_trend or ta.crossover(open,up_trend)or ta.crossover(high,up_trend))
longCondition3 = (open >= SMA500 or high>= SMA500 or ta.crossover(open,SMA500)or ta.crossover(high,SMA500))
longCondition4 = (open >= sar or high>= sar or ta.crossover(open,sar)or ta.crossover(high,sar))
longCondition5 = rising_taalma

shortCondition1 = (close < down_trend or low< down_trend or ta.crossunder(close,down_trend)or ta.crossunder(low,down_trend))
shortCondition2 = (close < up_trend or low< up_trend or ta.crossunder(close,up_trend)or ta.crossunder(low,up_trend))
shortCondition3 = (close < SMA500 or low< SMA500 or ta.crossunder(close,SMA500)or ta.crossunder(low,SMA500))
shortCondition4 = (close < sar or low< sar or ta.crossunder(close,sar)or ta.crossunder(low,sar))
shortCondition5 = falling_taalma

comp_buy1 = longCondition1 and longCondition2 and longCondition3 and longCondition4 and longCondition5
op_buy1 = shortCondition3 and longCondition1 and longCondition2 and longCondition4
op_buy2 = shortCondition1 and shortCondition2 and longCondition3 and longCondition4 and longCondition5

comp_sell1 = shortCondition1 and shortCondition2 and shortCondition3 and shortCondition4 and shortCondition5
op_sell1 = shortCondition3 and shortCondition4 and longCondition1 and longCondition2
op_sell2 = shortCondition4 and longCondition1 and longCondition2 and longCondition3
op_sell3 = longCondition2 and shortCondition1 and shortCondition4 and shortCondition3
op_sell4 = longCondition2 and shortCondition1 and shortCondition4

var b1 = 0
var b2 = 0
var b3 = 0

if comp_buy1 == true and comp_buy1[1] == false
    b1 := 1
else
    b1 := 0


if op_buy1 == true and op_buy1[1] == false
    b2 := 1
else
    b2 := 0


if op_buy2 == true and op_buy2[1] == false
    b3 := 1
else
    b3 := 0

// DCA method based on indicators

//RSI Indicator
len_rsi_10 = input.int(10,  title="Length", group = "RSI Indicator - 10", minval=1, maxval = 10, step = 1)
src_rsi_10 = input(ohlc4, "Source", group = "RSI Indicator - 10")
up_rsi_10 = ta.rma(math.max(ta.change(src_rsi_10), 0), len_rsi_10)
down_rsi_10 = ta.rma(-math.min(ta.change(src_rsi_10), 0), len_rsi_10)
rsi_10 = down_rsi_10 == 0 ? 100 : up_rsi_10 == 0 ? 0 : 100 - (100 / (1 + up_rsi_10 / down_rsi_10))

var p_rsi = 0

if rsi_10>= 0 and rsi_10<10
    p_rsi := 0
else if rsi_10>= 10 and rsi_10<20
    p_rsi := 10
else if rsi_10>= 20 and rsi_10<30
    p_rsi := 20
else if rsi_10>= 30 and rsi_10<40
    p_rsi := 30
else if rsi_10>= 40 and rsi_10<50
    p_rsi := 40
else if rsi_10>= 50 and rsi_10<60
    p_rsi := 50
else if rsi_10>= 60 and rsi_10<70
    p_rsi := 60
else if rsi_10>= 70 and rsi_10<80
    p_rsi := 70
else if rsi_10>= 80 and rsi_10<90
    p_rsi := 80
else if rsi_10>= 90 and rsi_10<100
    p_rsi := 90

len_rsi_50 = input.int(50, title="Length", group = "RSI Indicator - 50", minval=11, maxval = 50, step = 1)
src_rsi_50 = input(high, "Source", group = "RSI Indicator - 50")
up_rsi_50 = ta.rma(math.max(ta.change(src_rsi_50), 0), len_rsi_50)
down_rsi_50 = ta.rma(-math.min(ta.change(src_rsi_50), 0), len_rsi_50)
rsi_50 = down_rsi_50 == 0 ? 100 : up_rsi_50 == 0 ? 0 : 100 - (100 / (1 + up_rsi_50 / down_rsi_50))

var p_rsi_50 = 0

if rsi_50>= 0 and rsi_50<10
    p_rsi_50 := 0
else if rsi_50>= 10 and rsi_50<20
    p_rsi_50 := 10
else if rsi_50>= 20 and rsi_50<30
    p_rsi_50 := 20
else if rsi_50>= 30 and rsi_50<40
    p_rsi_50 := 30
else if rsi_50>= 40 and rsi_50<50
    p_rsi_50 := 40
else if rsi_50>= 50 and rsi_50<60
    p_rsi_50 := 50
else if rsi_50>= 60 and rsi_50<70
    p_rsi_50 := 60
else if rsi_50>= 70 and rsi_50<80
    p_rsi_50 := 70
else if rsi_50>= 80 and rsi_50<90
    p_rsi_50 := 80
else if rsi_50>= 90 and rsi_50<100
    p_rsi_50 := 90

len_rsi_100 = input.int(100, title="Length", group = "RSI Indicator - 100", minval=51, maxval = 200, step = 10)
src_rsi_100 = input(ohlc4, "Source", group = "RSI Indicator - 100")
up_rsi_100 = ta.rma(math.max(ta.change(src_rsi_100), 0), len_rsi_100)
down_rsi_100 = ta.rma(-math.min(ta.change(src_rsi_100), 0), len_rsi_100)
rsi_100 = down_rsi_100 == 0 ? 100 : up_rsi_100 == 0 ? 0 : 100 - (100 / (1 + up_rsi_100 / down_rsi_100))

var p_rsi_100 = 0

if rsi_100>= 0 and rsi_100<10
    p_rsi_100 := 0
else if rsi_100>= 10 and rsi_100<20
    p_rsi_100 := 10
else if rsi_100>= 20 and rsi_100<30
    p_rsi_100 := 20
else if rsi_100>= 30 and rsi_100<40
    p_rsi_100 := 30
else if rsi_100>= 40 and rsi_100<50
    p_rsi_100 := 40
else if rsi_100>= 50 and rsi_100<60
    p_rsi_100 := 50
else if rsi_100>= 60 and rsi_100<70
    p_rsi_100 := 60
else if rsi_100>= 70 and rsi_100<80
    p_rsi_100 := 70
else if rsi_100>= 80 and rsi_100<90
    p_rsi_100 := 80
else if rsi_100>= 90 and rsi_100<100
    p_rsi_100 := 90

// Relative Volatility Indicator
length_rvi_10 = input.int(defval = 10, minval=1, maxval = 10, step = 1, title="Length - RVI", group = "RVI Indicator - 10")
len_rvi_10 = input.int(defval = 10, minval=1, maxval = 10, step = 1, title="Length - EMA", group = "RVI Indicator - 10")
src_rvi_10 = input(high, title = "Source", group = "RVI Indicator - 10")
stddev_rvi_10 = ta.stdev(src_rvi_10, length_rvi_10)
upper_rvi_10 = ta.ema(ta.change(src_rvi_10) <= 0 ? 0 : stddev_rvi_10, len_rvi_10)
lower_rvi_10 = ta.ema(ta.change(src_rvi_10) > 0 ? 0 : stddev_rvi_10, len_rvi_10)
rvi_10 = upper_rvi_10 / (upper_rvi_10 + lower_rvi_10) * 100

var p_rvi_10 = 0

if rvi_10 >= 0 and rvi_10 <10
    p_rvi_10 := 0
else if rvi_10 >= 10 and rvi_10 <20
    p_rvi_10 := 10
else if rvi_10 >= 20 and rvi_10 <30
    p_rvi_10 := 20
else if rvi_10 >= 30 and rvi_10 <40
    p_rvi_10 := 30
else if rvi_10 >= 40 and rvi_10 <50
    p_rvi_10 := 40
else if rvi_10 >= 50 and rvi_10 <60
    p_rvi_10 := 50
else if rvi_10 >= 60 and rvi_10 <70
    p_rvi_10 := 60
else if rvi_10 >= 70 and rvi_10 <80
    p_rvi_10 := 70
else if rvi_10 >= 80 and rvi_10 <90
    p_rvi_10 := 80
else if rvi_10 >= 90 and rvi_10 <100
    p_rvi_10 := 90

length_rvi_50 = input.int(defval = 50, minval=11, maxval = 50, step = 1, title="Length - RVI", group = "RVI Indicator - 50")
len_rvi_50 = input.int(defval = 50, minval=11, maxval = 50, step = 1, title="Length - EMA", group = "RVI Indicator - 50")
src_rvi_50 = input(close, title = "source", group = "RVI Indicator - 50")
stddev_rvi_50 = ta.stdev(src_rvi_50, length_rvi_50)
upper_rvi_50 = ta.ema(ta.change(src_rvi_50) <= 0 ? 0 : stddev_rvi_50, len_rvi_50)
lower_rvi_50 = ta.ema(ta.change(src_rvi_50) > 0 ? 0 : stddev_rvi_50, len_rvi_50)
rvi_50 = upper_rvi_50 / (upper_rvi_50 + lower_rvi_50) * 100

var p_rvi_50 = 0

if rvi_50 >= 0 and rvi_50 <10
    p_rvi_50 := 0
else if rvi_50 >= 10 and rvi_50 <20
    p_rvi_50 := 10
else if rvi_50 >= 20 and rvi_50 <30
    p_rvi_50 := 20
else if rvi_50 >= 30 and rvi_50 <40
    p_rvi_50 := 30
else if rvi_50 >= 40 and rvi_50 <50
    p_rvi_50 := 40
else if rvi_50 >= 50 and rvi_50 <60
    p_rvi_50 := 50
else if rvi_50 >= 60 and rvi_50 <70
    p_rvi_50 := 60
else if rvi_50 >= 70 and rvi_50 <80
    p_rvi_50 := 70
else if rvi_50 >= 80 and rvi_50 <90
    p_rvi_50 := 80
else if rvi_50 >= 90 and rvi_50 <100
    p_rvi_50 := 90


length_rvi_100 = input.int(defval = 100, minval=51, maxval = 200, step = 10, title="Length - RVI", group = "RVI Indicator - 100")
len_rvi_100 = input.int(defval = 100, minval=51, maxval = 200, step = 10, title="Length - EMA", group = "RVI Indicator - 100")
src_rvi_100 = input(close, title = "Source", group = "RVI Indicator - 100")
stddev_rvi_100 = ta.stdev(src_rvi_100, length_rvi_100)
upper_rvi_100 = ta.ema(ta.change(src_rvi_100) <= 0 ? 0 : stddev_rvi_100, len_rvi_100)
lower_rvi_100 = ta.ema(ta.change(src_rvi_100) > 0 ? 0 : stddev_rvi_100, len_rvi_100)
rvi_100 = upper_rvi_100 / (upper_rvi_100 + lower_rvi_100) * 100


var p_rvi_100 = 0

if rvi_100 >= 0 and rvi_100 <10
    p_rvi_100 := 0
else if rvi_100 >= 10 and rvi_100 <20
    p_rvi_100 := 10
else if rvi_100 >= 20 and rvi_100 <30
    p_rvi_100 := 20
else if rvi_100 >= 30 and rvi_100 <40
    p_rvi_100 := 30
else if rvi_100 >= 40 and rvi_100 <50
    p_rvi_100 := 40
else if rvi_100 >= 50 and rvi_100 <60
    p_rvi_100 := 50
else if rvi_100 >= 60 and rvi_100 <70
    p_rvi_100 := 60
else if rvi_100 >= 70 and rvi_100 <80
    p_rvi_100 := 70
else if rvi_100 >= 80 and rvi_100 <90
    p_rvi_100 := 80
else if rvi_100 >= 90 and rvi_100 <100
    p_rvi_100 := 90

// Money flow index
len_mfi_10 = input.int(defval = 10, minval=1, maxval = 10, step = 1, title="Length - MFI", group = "MFI Indicator - 10")
src_mfi_10 = input(high, title = "source", group = "MFI Indicator - 10")
mf_10 = ta.mfi(src_mfi_10, len_mfi_10)

var p_mfi_10 = 0

if mf_10>= 0 and mf_10<10
    p_mfi_10 := 0
else if mf_10>= 10 and mf_10<20
    p_mfi_10 := 10
else if mf_10>= 20 and mf_10<30
    p_mfi_10 := 20
else if mf_10>= 30 and mf_10<40
    p_mfi_10 := 30
else if mf_10>= 40 and mf_10<50
    p_mfi_10 := 40
else if mf_10>= 50 and mf_10<60
    p_mfi_10 := 50
else if mf_10>= 60 and mf_10<70
    p_mfi_10 := 60
else if mf_10>= 70 and mf_10<80
    p_mfi_10 := 70
else if mf_10>= 80 and mf_10<90
    p_mfi_10 := 80
else if mf_10>= 90 and mf_10<100
    p_mfi_10 := 90

len_mfi_50 = input.int(defval = 50, minval=11, maxval = 50, step = 1, title="Length - MFI", group = "MFI Indicator - 50")
src_mfi_50 = input(high, title = "source", group = "MFI Indicator - 50")
mf_50 = ta.mfi(src_mfi_50, len_mfi_50)

var p_mfi_50 = 0

if mf_50>= 0 and mf_50<10
    p_mfi_50 := 0
else if mf_50>= 10 and mf_50<20
    p_mfi_50 := 10
else if mf_50>= 20 and mf_50<30
    p_mfi_50 := 20
else if mf_50>= 30 and mf_50<40
    p_mfi_50 := 30
else if mf_50>= 40 and mf_50<50
    p_mfi_50 := 40
else if mf_50>= 50 and mf_50<60
    p_mfi_50 := 50
else if mf_50>= 60 and mf_50<70
    p_mfi_50 := 60
else if mf_50>= 70 and mf_50<80
    p_mfi_50 := 70
else if mf_50>= 80 and mf_50<90
    p_mfi_50 := 80
else if mf_50>= 90 and mf_50<100
    p_mfi_50 := 90

len_mfi_100 = input.int(defval = 100, minval=51, maxval = 200, step = 10, title="Length - MFI", group = "MFI Indicator - 100")
src_mfi_100 = input(high, title = "source", group = "MFI Indicator - 100")
mf_100 = ta.mfi(src_mfi_100, len_mfi_100)

var p_mfi_100 = 0

if mf_100>= 0 and mf_100<10
    p_mfi_100 := 0
else if mf_100>= 10 and mf_100<20
    p_mfi_100 := 10
else if mf_100>= 20 and mf_100<30
    p_mfi_100 := 20
else if mf_100>= 30 and mf_100<40
    p_mfi_100 := 30
else if mf_100>= 40 and mf_100<50
    p_mfi_100 := 40
else if mf_100>= 50 and mf_100<60
    p_mfi_100 := 50
else if mf_100>= 60 and mf_100<70
    p_mfi_100 := 60
else if mf_100>= 70 and mf_100<80
    p_mfi_100 := 70
else if mf_100>= 80 and mf_100<90
    p_mfi_100 := 80
else if mf_100>= 90 and mf_100<100
    p_mfi_100 := 90

//Balance of power indicator
bop = ((((close - open) / (high - low))*100)+50)
bop_sma_100 = ta.sma(bop,100)


// Buy and Sell lavels based on Indicators
l_val_rsi = input.int (defval = 40, title = "Lower value of RSI", maxval = 100, minval = 0, step = 10, group = 'Indicator Values')
l_val_rvi = input.int (defval = 40, title = "Lower value of RVI", maxval = 100, minval = 0, step = 10, group = 'Indicator Values')
l_val_mfi = input.int (defval = 40, title = "Lower value of MFI", maxval = 100, minval = 0, step = 10, group = 'Indicator Values')

//h_val_rsi = input.int (defval = 60, title = "Higher value of RSI", maxval = 100, minval = 0, step = 10, group = 'Indicator Values')
//h_val_rvi = input.int (defval = 50, title = "Higher value of RVI", maxval = 100, minval = 0, step = 10, group = 'Indicator Values')
//h_val_mfi = input.int (defval = 50, title = "Higher value of MFI", maxval = 100, minval = 0, step = 10, group = 'Indicator Values')

buy_rsi = p_rsi_100 <= l_val_rsi and p_rsi_50<p_rsi_100 and p_rsi<=p_rsi_50
buy_rvi = p_rvi_100 <= l_val_rvi and p_rvi_50<=p_rvi_100 and p_rvi_10<=p_rvi_50
buy_mfi = p_mfi_100 <= l_val_mfi and p_mfi_50<=p_mfi_100 and p_mfi_10<=p_mfi_50

buy_compound = buy_rsi and buy_rvi and buy_mfi ? 100 : 0

var float  buy_compound_f = na
if (buy_compound[1] == 100 and buy_compound == 0) //and open > close
    buy_compound_f := 1
else
    buy_compound_f := na

ma_9 = ta.ema(close,2)
co_l1 = strategy.position_avg_price*0.95
co_l2 = strategy.position_avg_price*0.90
co_l3 = strategy.position_avg_price*0.85
co_l4 = strategy.position_avg_price*0.80

//Take profit in Market bottoms
profit_f = 1.0 + (profit_cal/100)


// Trading
var final_option = UP_DOWN == 'Uptrend and down trend' ? 1 : 2

if final_option == 1
    if  ((buy_compound_f ==1 or ta.crossover(ma_9, co_l1) or ta.crossover(ma_9, co_l2) or ta.crossover(ma_9, co_l3) or ta.crossover(ma_9, co_l4)) and window())
        strategy.entry("long", strategy.long,comment = "BUY")
    else if ( comp_sell1 and window()) and strategy.position_avg_price * profit_f < close
        strategy.close("long", qty_percent = 100, comment = "SELL")
else if final_option == 2
    if (b1 or b2 or b3) and window()
        strategy.entry("long", strategy.long, comment = "BUY")
    else if (comp_sell1 or op_sell1 or op_sell2 or op_sell3 or op_sell4 ) and window()
        strategy.close("long", qty_percent = 100, comment = "SELL")


bool PM_visible = input(false, "Show Profit marjin and average price", group = 'Safty Margins')
bool SM_visible = input(false, "Show Safty Grids", group = 'Safty Margins' )


//Graphs

plot(PM_visible or final_option == 1 ? strategy.position_avg_price : na, color = color.green, title = "Average Cost", style = plot.style_circles)
plot(PM_visible or final_option == 1 ? strategy.position_avg_price* profit_f :na, color = color.aqua, title = "Expected Profit", style = plot.style_circles)
plot(SM_visible ? strategy.position_avg_price*0.95 : na, color = color.gray, title = "SAFTY MARGIN - 95%", linewidth = 1, style = plot.style_circles)
plot(SM_visible ? strategy.position_avg_price*0.90 : na, color = color.gray, title = "SAFTY MARGIN - 90%", linewidth = 1, style = plot.style_circles)
plot(SM_visible ? strategy.position_avg_price*0.85 : na, color = color.gray, title = "SAFTY MARGIN - 85%", linewidth = 1, style = plot.style_circles)
plot(SM_visible ? strategy.position_avg_price*0.80 : na, color = color.gray, title = "SAFTY MARGIN - 80%", linewidth = 1, style = plot.style_circles)

plot(ST_visible or final_option == 2 ? down_trend:na, "Down trend", color = plotcolor2,  linewidth=2)
plot(ST_visible or final_option == 2 ? up_trend: na , "Up direction", color = plotcolor3, linewidth=2)
plot(sar_visible or final_option == 2 ? sar:na, title='SAR', color=plotcolor4, linewidth=2)
plot(sma500_visible or final_option == 2 ? SMA500:na,title='SMA500', color=plotcolor5, linewidth=3)