Chiến lược chuyển đổi chỉ số dao động
Tổng quan
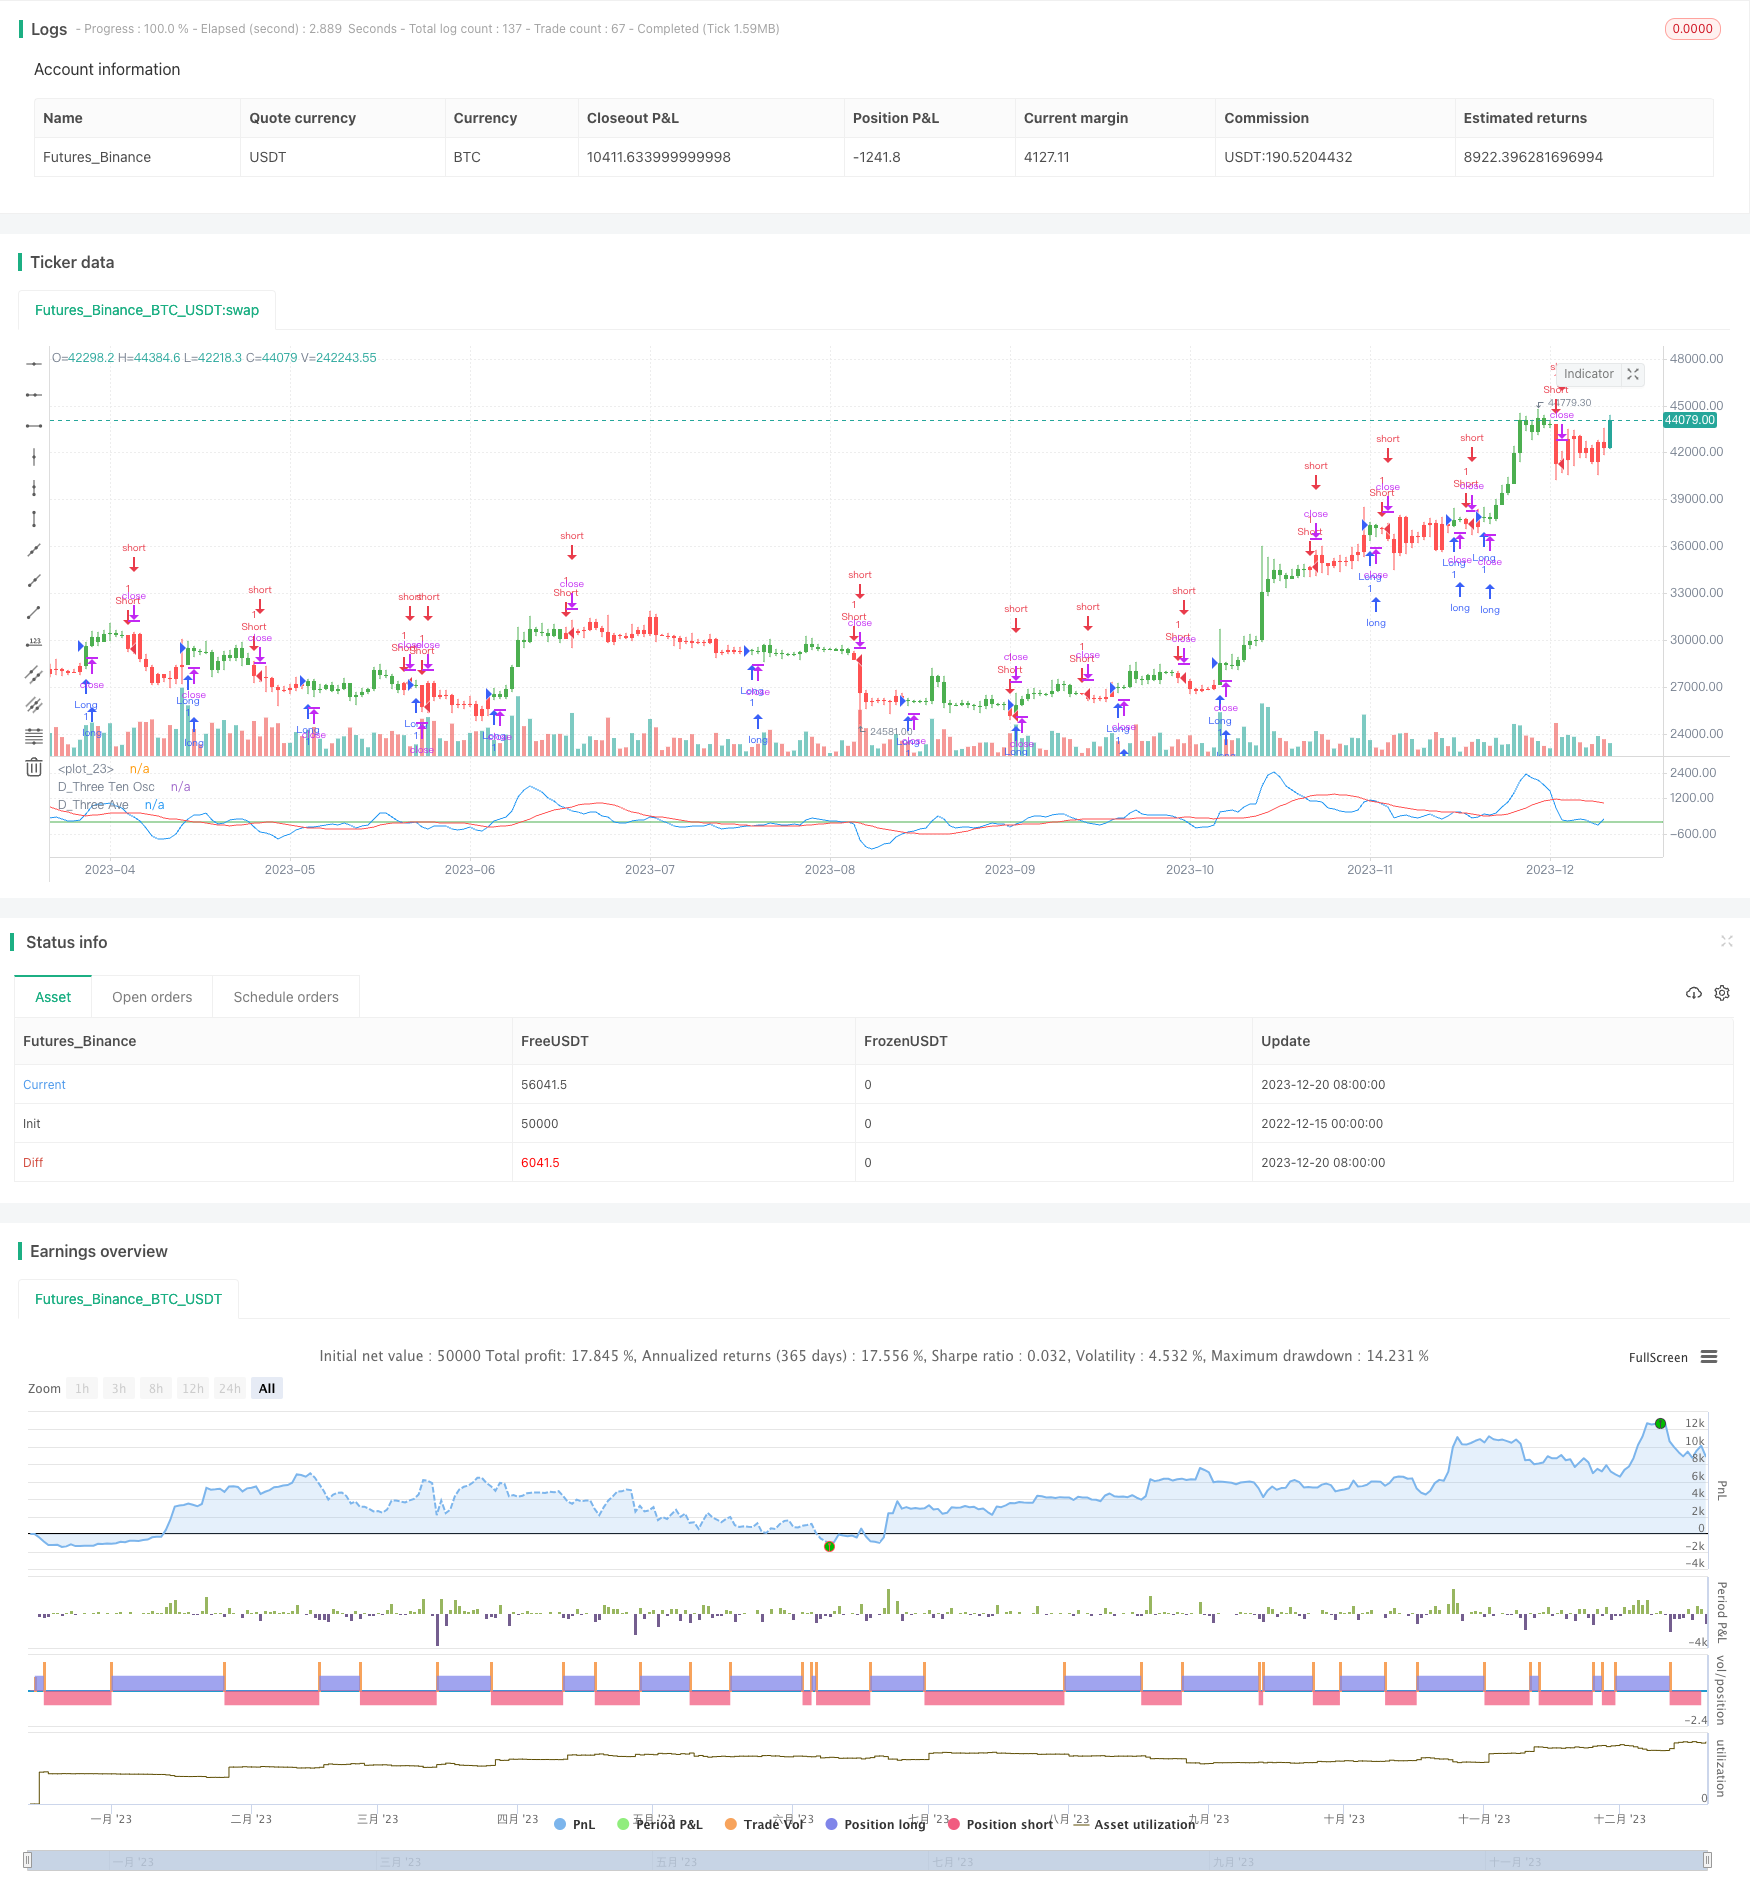
Chiến lược chuyển đổi chỉ số dao động sử dụng các chỉ số dao động 3-10 của Bressert và đường trung bình di chuyển đơn giản 16 ngày của nó để tạo ra tín hiệu giao dịch. Chiến lược này áp dụng cho giao dịch trong ngày và qua đêm.
Nguyên tắc chiến lược
Chiến lược này dựa trên chỉ số dao động 3-10 của Bressert, chỉ số là sự chênh lệch giữa chỉ số di chuyển trung bình 3 ngày và chỉ số di chuyển trung bình 10 ngày.
Cụ thể, chiến lược đầu tiên tính EMA 3 ngày, EMA 10 ngày và sự chênh lệch của chúng làm chỉ số dao động. Sau đó tính trung bình di chuyển đơn giản của chỉ số dao động 16 ngày làm đường tín hiệu.
Phân tích lợi thế
- Sử dụng chỉ số dao động Bressert cổ điển, có một số hiệu quả
- Kết hợp với đường nhanh chậm để tạo ra tín hiệu giao dịch, dễ dàng xác định entry và exit
- Cho phép thực hành ngược lại, có thể thích ứng với các môi trường thị trường khác nhau
- Có thể sử dụng trong giao dịch trong ngày và qua đêm
Phân tích rủi ro
- Các hiệu ứng của chỉ số dao động Bretherton không ổn định, có sự biến động lợi nhuận nhất định
- Tín hiệu chéo đường nhanh và đường chậm có thể có tín hiệu giả
- Phương pháp đảo ngược có nhiều rủi ro và cần thận trọng
- Giao dịch trong ngày cần xem xét chiến lược dừng lỗ, giao dịch qua đêm cần xem xét quản lý tiền
Hướng tối ưu hóa
- Tối ưu hóa tham số, điều chỉnh chu kỳ trung bình di chuyển, tìm các tham số kết hợp tốt nhất
- Thêm các điều kiện lọc để đánh giá chất lượng tín hiệu kết hợp với các chỉ số khác hoặc hình dạng giá
- Tăng chiến lược dừng lỗ, thiết lập điểm dừng lỗ hợp lý, kiểm soát lỗ đơn
- Tối ưu hóa quản lý vốn, điều chỉnh kích thước vị trí, giảm tác động của tổn thất đơn trên tổng vốn
Tóm tắt
Chiến lược thay đổi chỉ số dao động thuộc chiến lược giao dịch ngắn, tạo ra tín hiệu giao dịch thông qua giao thoa chỉ số dao động 3-10 của Bressert và đường tín hiệu của nó, đơn giản và thực tế. Chiến lược này có thể áp dụng cho giao dịch trong ngày và qua đêm, nhưng có một số rủi ro biến động lỗ hổng và tín hiệu giả, cần thêm điều kiện lọc để tối ưu hóa dừng lỗ để cải thiện.
/*backtest
start: 2022-12-15 00:00:00
end: 2023-12-21 00:00:00
period: 1d
basePeriod: 1h
exchanges: [{"eid":"Futures_Binance","currency":"BTC_USDT"}]
*/

//@version=2
////////////////////////////////////////////////////////////
//  Copyright by HPotter v1.0 27/03/2017
// TradeStation does not allow the user to make a Multi Data Chart with
// a Tick Bar Chart and any other type a chart. This indicator allows the
// user to plot a daily 3-10 Oscillator on a Tick Bar Chart or any intraday interval.
// Walter Bressert's 3-10 Oscillator is a detrending oscillator derived
// from subtracting a 10 day moving average from a 3 day moving average.
// The second plot is an 16 day simple moving average of the 3-10 Oscillator.
// The 16 period moving average is the slow line and the 3/10 oscillator is
// the fast line.
// For more information on the 3-10 Oscillator see Walter Bressert's book
// "The Power of Oscillator/Cycle Combinations"
//
// You can change long to short in the Input Settings
// Please, use it only for learning or paper trading. Do not for real trading.
////////////////////////////////////////////////////////////
strategy(title="D_Three Ten Osc", shorttitle="D_Three Ten Osc")
Length1 = input(3, minval=1)
Length2 = input(10, minval=1)
Length3 = input(16, minval=1)
reverse = input(false, title="Trade reverse")
hline(0, color=green, linestyle=line)
xPrice =  request.security(syminfo.tickerid,"D", hl2)
xfastMA = ema(xPrice, Length1)
xslowMA = ema(xPrice, Length2)
xMACD = xfastMA - xslowMA
xSignal = sma(xMACD, Length3)
pos = iff(xSignal > xMACD, -1,
	     iff(xSignal < xMACD, 1, nz(pos[1], 0)))
possig = iff(reverse and pos == 1, -1,
          iff(reverse and pos == -1, 1, pos))
if (possig == 1)
    strategy.entry("Long", strategy.long)
if (possig == -1)
    strategy.entry("Short", strategy.short)
barcolor(possig == -1 ? red: possig == 1 ? green : blue )
plot(request.security(syminfo.tickerid, "D", xMACD), color=blue, title="D_Three Ten Osc")
plot(request.security(syminfo.tickerid, "D", xSignal), color=red, title="D_Three Ave")