Chiến lược giao dịch đường trung bình động Heinach dựa trên phần trăm
Tổng quan
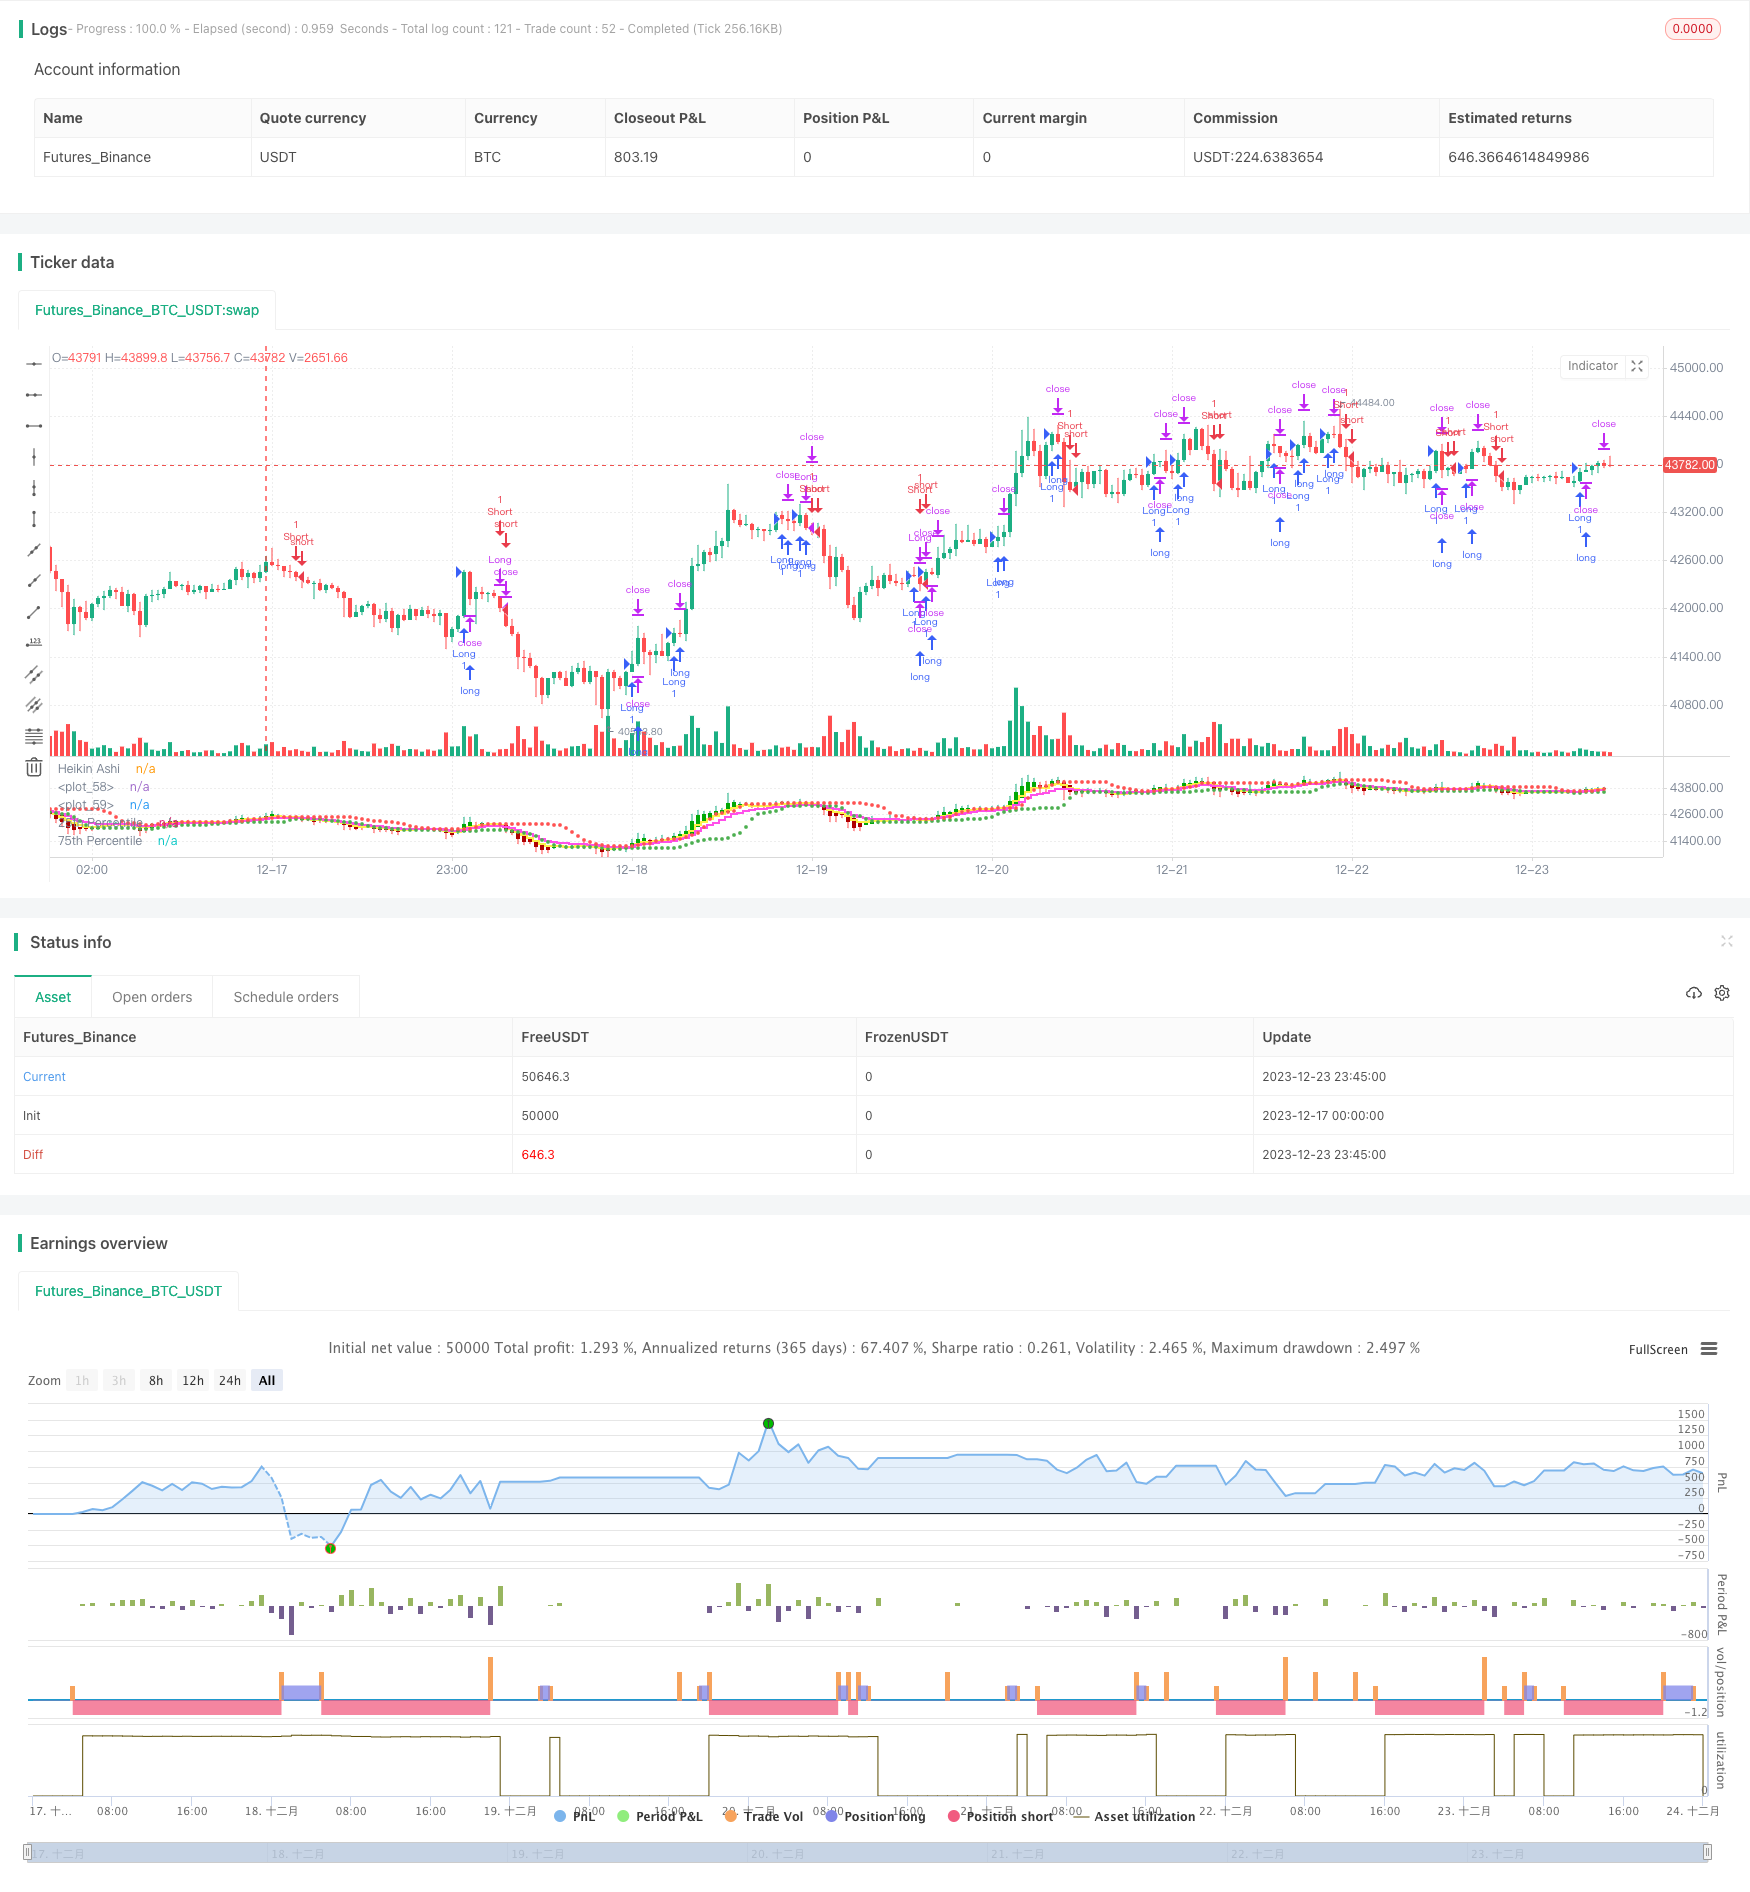
Chiến lược này dựa trên việc tạo ra tín hiệu giao dịch trên đường trung bình Heineken. Trong đó, việc tạo ra tín hiệu mua và bán xem xét sự giao thoa của giá đóng cửa Heineken với mức giá 75% và giá đóng cửa Heineken cao hơn trung bình di chuyển.
Nguyên tắc chiến lược
Chiến lược này sử dụng đường trung bình Heineken thay cho đường K thông thường để phân tích, loại đường trung bình này lọc tiếng ồn thị trường và có lợi hơn cho việc phát hiện xu hướng và tín hiệu đảo ngược. Cụ thể, chiến lược này kết hợp các kênh phần trăm và trung bình di chuyển để tạo ra tín hiệu giao dịch:
- Một tín hiệu mua được tạo ra khi giá Hyndai vượt qua mức giá 75% trên giá đóng cửa.
- Một tín hiệu bán ra được tạo ra khi giá Hyndai vượt qua đường trung bình di chuyển 5 ngày dưới mức đóng cửa.
Ngoài ra, chiến lược này cũng đặt khoảng cách dừng lỗ và theo dõi dừng lỗ để kiểm soát rủi ro đơn phương.
Lợi thế chiến lược
- Sử dụng đường trung bình Heinrich để nhận biết xu hướng rõ ràng hơn và phát hiện các tín hiệu đảo ngược kịp thời.
- Kết hợp với các kênh phần trăm, giá có thể được xác định là đang ở trạng thái quá nóng hoặc quá bán, để xác định thời điểm mua và bán.
- Thiết lập dừng lỗ và theo dõi dừng lỗ giúp chủ động kiểm soát rủi ro và tránh thiệt hại vượt quá mức chấp nhận được.
Rủi ro chiến lược
- Đường trung bình Hyndai tự nó sẽ tạo ra sự chậm trễ, có thể bỏ lỡ các điểm tốt nhất cho hoạt động đường ngắn.
- Các kênh phần trăm không thể xác định hoàn toàn điểm biến của giá, có một tỷ lệ tín hiệu giả.
- Việc thiết lập khoảng cách dừng không đúng cách có thể quá thoải mái hoặc quá chặt chẽ, do đó ảnh hưởng đến hiệu suất chiến lược.
Để giảm nguy cơ trên, bạn có thể điều chỉnh chu kỳ trung bình di chuyển thích hợp hoặc điều chỉnh tỷ lệ dừng lỗ.
Tối ưu hóa chiến lược
- Kiểm tra các kết hợp trung bình di chuyển khác nhau để tìm tham số tốt nhất.
- Kiểm tra các tham số kênh phần trăm khác nhau để đảm bảo nắm bắt giá trong khu vực nóng.
- Kết hợp với các chỉ số khác để xác minh tín hiệu mua và bán, lọc các tín hiệu giả.
- Động lực điều chỉnh khoảng cách dừng
Tóm tắt
Chiến lược này tích hợp nhiều chỉ số như đường trung bình Heinrich, kênh phần trăm và đường trung bình di chuyển để tạo thành một hệ thống giao dịch. Hệ thống này có thể xác định hiệu quả hướng xu hướng và thiết lập dừng lỗ để kiểm soát rủi ro, là một chiến lược giao dịch định lượng đáng xem xét.
/*backtest
start: 2023-12-17 00:00:00
end: 2023-12-24 00:00:00
period: 45m
basePeriod: 5m
exchanges: [{"eid":"Futures_Binance","currency":"BTC_USDT"}]
*/

//@version=5
strategy("HK Percentile Interpolation One",shorttitle = "HKPIO", overlay=false, default_qty_type = strategy.cash, default_qty_value = 5000, calc_on_order_fills = true, calc_on_every_tick = true)

// Input parameters
stopLossPercentage = input(3, title="Stop Loss (%)") // User can set Stop Loss as a percentage
trailStopPercentage = input(1.5, title="Trailing Stop (%)") // User can set Trailing Stop as a percentage
lookback = input.int(14, title="Lookback Period", minval=1) // User can set the lookback period for percentile calculation
yellowLine_length = input.int(5, "Yellow", minval=1) // User can set the length for Yellow EMA
purplLine_length = input.int(10, "Purple", minval=1) // User can set the length for Purple EMA
holdPeriod = input.int(200, title="Minimum Holding Period", minval=10) // User can set the minimum holding period
startDate = timestamp("2021 01 01")  // User can set the start date for the strategy

// Calculate Heikin Ashi values
haClose = ohlc4
var float haOpen = na
haOpen := na(haOpen[1]) ? (open + close) / 2 : (haOpen[1] + haClose[1]) / 2
haHigh = math.max(nz(haOpen, high), nz(haClose, high), high)
haLow = math.min(nz(haOpen, low), nz(haClose, low), low)

// Calculate Moving Averages
yellowLine = ta.ema(haClose, yellowLine_length)
purplLine = ta.ema(haClose, purplLine_length)

// Calculate 25th and 75th percentiles
p25 = ta.percentile_linear_interpolation(haClose, lookback, 28)
p75 = ta.percentile_linear_interpolation(haClose, lookback, 78)

// Generate buy/sell signals
longSignal = ta.crossover(haClose, p75) and haClose > yellowLine
sellSignal = ta.crossunder(haClose, yellowLine)
longSignal1 = ta.crossover(haClose, p75) and haClose > purplLine
sellSignal1 = ta.crossunder(haClose, purplLine)

// Set start time and trade conditions
if(time >= startDate)
    // When longSignal is true, enter a long trade and set stop loss and trailing stop conditions
    if (longSignal)
        strategy.entry("Long", strategy.long, 1)
        strategy.exit("Sell", "Long", stop=close*(1-stopLossPercentage/100), trail_points=close*trailStopPercentage/100, trail_offset=close*trailStopPercentage/100)
    // When sellSignal is true, close the long trade
    if (sellSignal)
        strategy.close("Long")
    // When sellSignal1 is true, enter a short trade
    if (sellSignal1)
        strategy.entry("Short", strategy.short, 1)
    // When longSignal1 is true, close the short trade
    if (longSignal1)
        strategy.close("Short")

// Plot Heikin Ashi candles
plotcandle(haOpen, haHigh, haLow, haClose, title="Heikin Ashi", color=(haClose >= haOpen ? color.rgb(1, 168, 6) : color.rgb(176, 0, 0)))

// Plot 25th and 75th percentile levels
plot(p25, title="25th Percentile", color=color.green, linewidth=1, style=plot.style_circles)
plot(p75, title="75th Percentile", color=color.red, linewidth=1, style=plot.style_circles)

// Plot Moving Averages
plot(yellowLine, color = color.rgb(254, 242, 73, 2), linewidth = 2, style = plot.style_stepline)
plot(purplLine, color = color.rgb(255, 77, 234, 2), linewidth = 2, style = plot.style_stepline)