Chỉ báo động lượng theo dõi chiến lược thay đổi giá ngắn hạn
Tổng quan
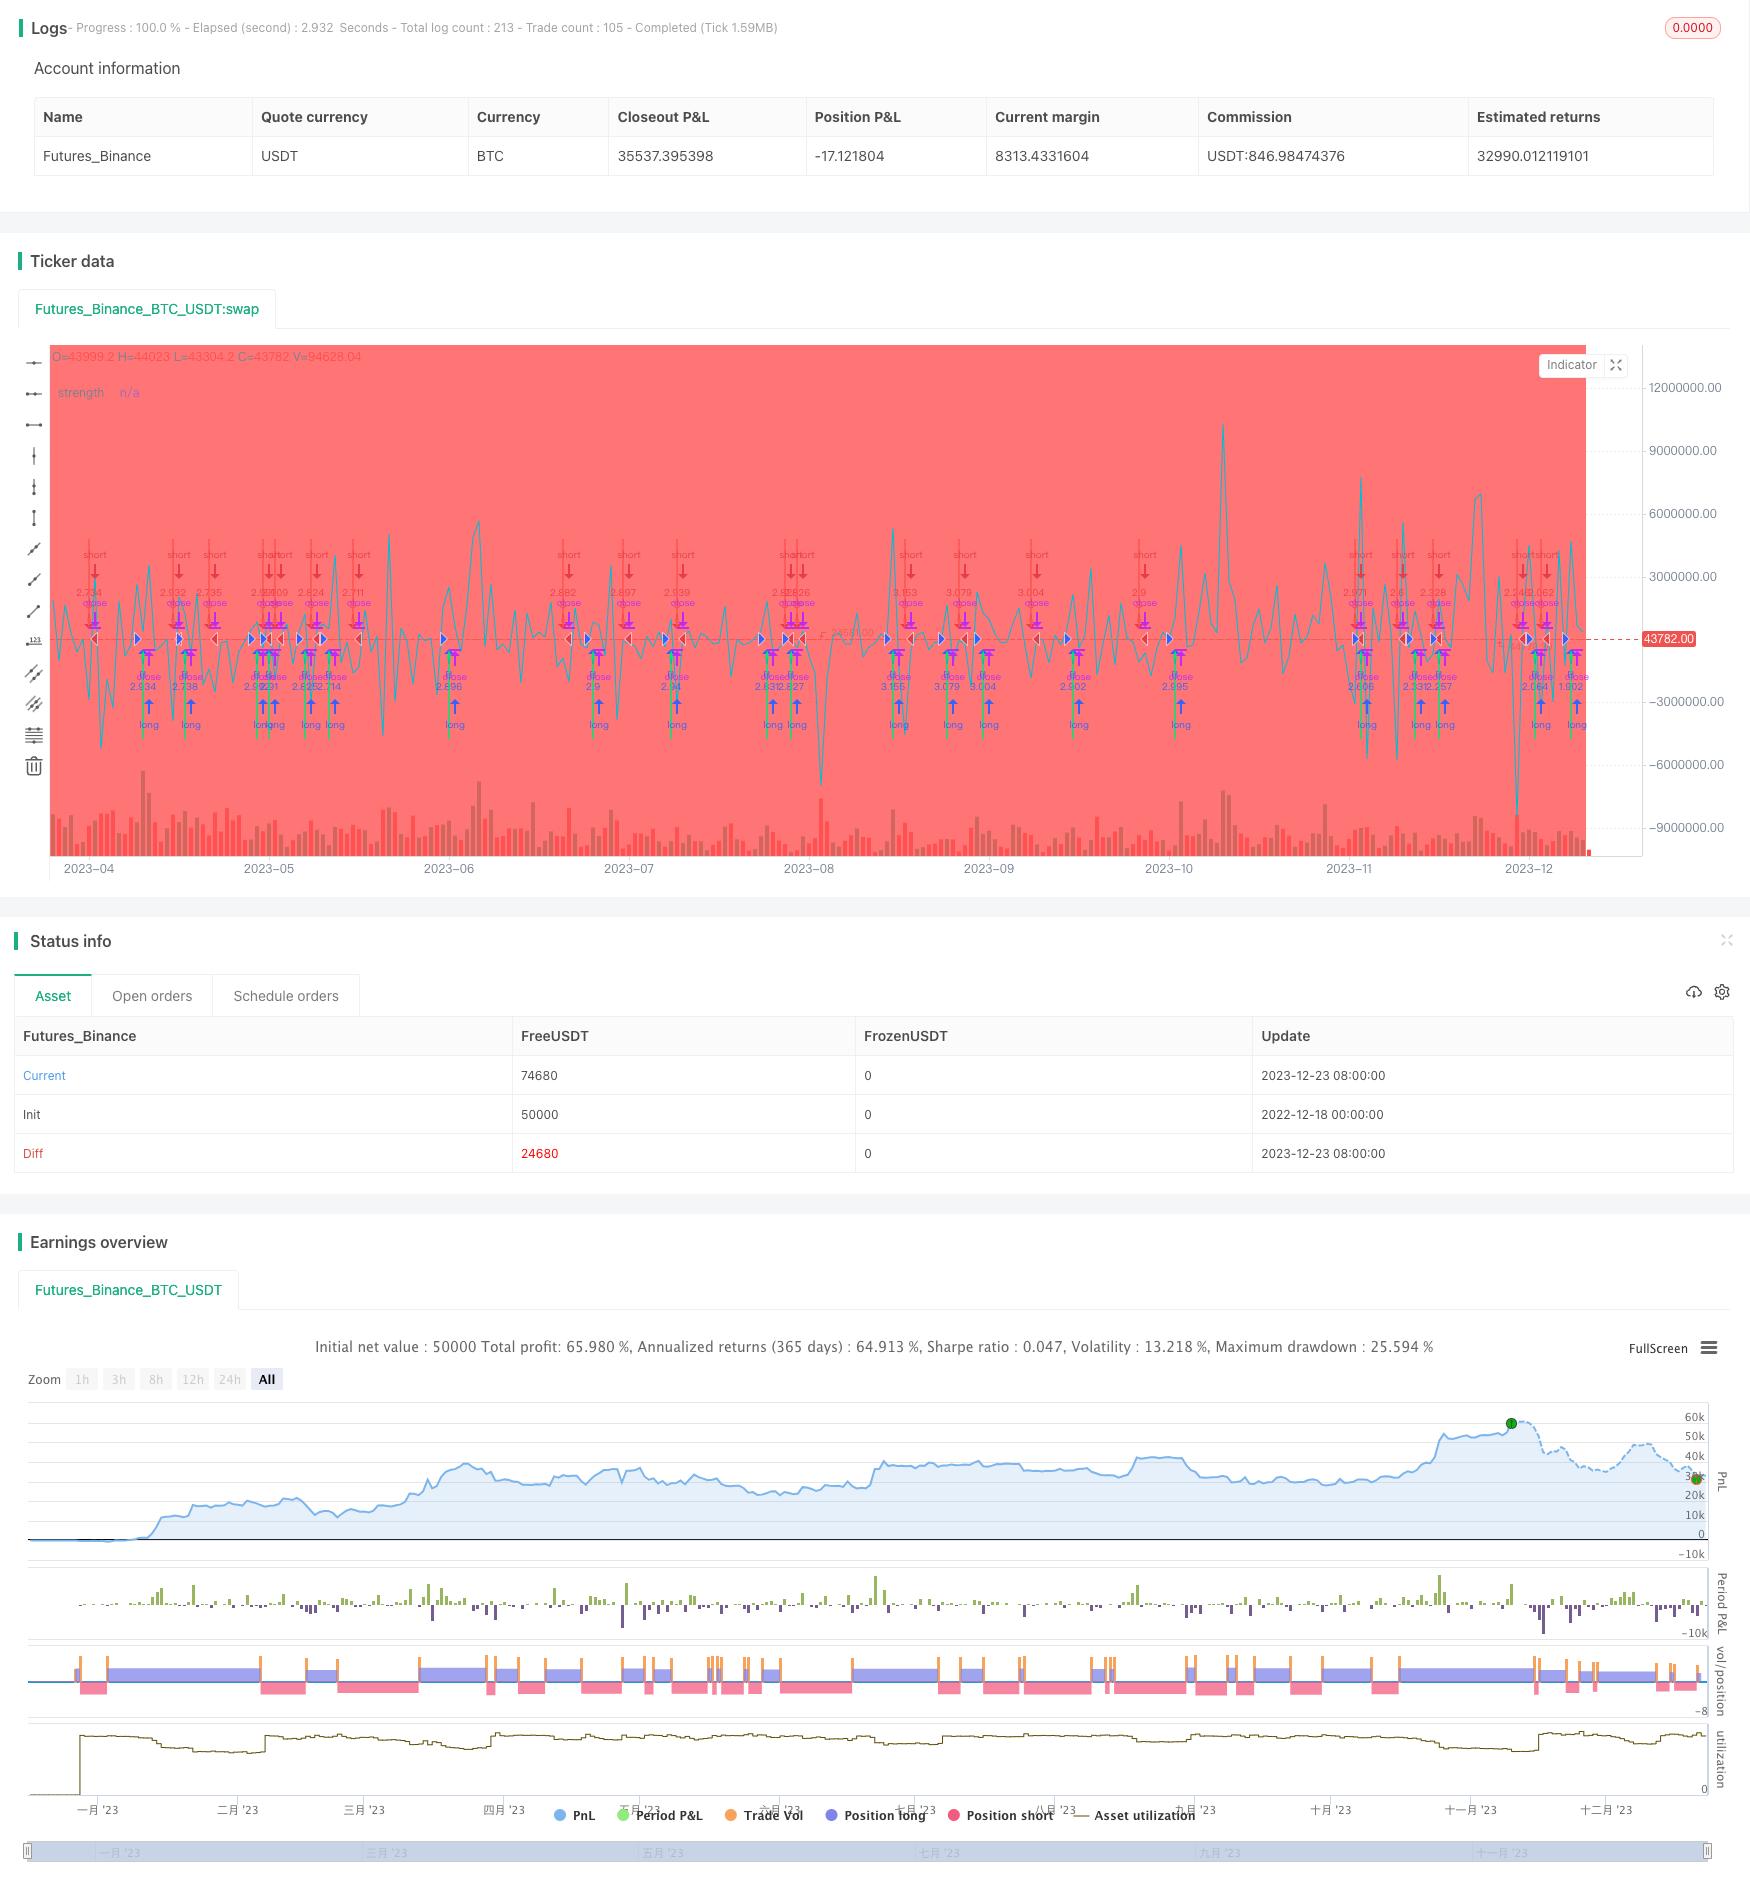
Chiến lược này sử dụng chỉ số động lực để theo dõi biến động giá trong thời gian ngắn, xác định xu hướng thị trường và thực hiện các hoạt động mua và bán. Tên của chiến lược là Phương pháp xu hướng khối lượng giá, phản ánh cách thức chiến lược sử dụng biến động giá và biến động khối lượng giao dịch để xác định xu hướng.
Nguyên tắc chiến lược
Chiến lược này đầu tiên tính toán động lượng của giá. Bằng cách tính toán chênh lệch của giá trong chu kỳ hiện tại so với giá trong chu kỳ trước, nó có thể phản ánh sự thay đổi tuyệt đối của giá trong chu kỳ mới nhất.
Khi giá mới nhất lớn hơn động lượng trung bình, giá đang tăng; khi giá mới hơn động lượng trung bình, giá đang giảm. Dựa trên chỉ số này, định hướng xu hướng của giá. Kết hợp bộ lọc tăng khối lượng giao dịch, chỉ chọn tín hiệu có khối lượng giao dịch lớn hơn trong giao dịch thực tế.
Theo xu hướng tăng giá và giảm giá, thực hiện các hoạt động mua và bán phù hợp.
Phân tích lợi thế
- Chiến lược đánh giá xu hướng nhanh chóng, có thể nhanh chóng nắm bắt biến động giá ngắn hạn, phù hợp cho hoạt động ngắn hạn
- Không bị lừa dối bởi các đột phá giả mạo bằng cách lọc khối lượng giao dịch
- Lập ra logic hoạt động theo đuổi và tiêu diệt.
- Tỷ lệ giao dịch cao, phù hợp với nhà đầu tư tích cực
Phân tích rủi ro
- Dễ bị ảnh hưởng bởi sự biến động bất thường của thị trường, có một số rủi ro tín hiệu sai
- Rủi ro bị trượt khi giao dịch thường xuyên
- Có thể bỏ lỡ xu hướng trung bình và dài hạn, khả năng lợi nhuận dài hạn vẫn chưa được chứng minh
Hướng tối ưu hóa
- Điều chỉnh tham số chỉ số động lượng để tối ưu hóa hiệu quả phán đoán
- Tối ưu hóa các tham số lọc khối lượng giao tiếp, cải thiện chất lượng tín hiệu
- Tăng cơ chế ngăn chặn tổn thất, kiểm soát tổn thất đơn lẻ
- Kết hợp nhiều yếu tố để đảm bảo tính đa yếu tố
Tóm tắt
Chiến lược này theo dõi xu hướng thay đổi giá trong thời gian ngắn thông qua các chỉ số động lực, để nhanh chóng đánh giá thời gian mua và bán. Ưu điểm là hoạt động nhanh chóng, theo dõi giảm; Nhược điểm là chất lượng tín hiệu và khả năng lợi nhuận lâu dài cần được xem xét. Bằng cách điều chỉnh tham số, tăng cường cơ chế kiểm soát gió, chiến lược này có thể trở thành một phần quan trọng của chiến lược tần số cao, được sử dụng với các chiến lược tần số thấp khác.
/*backtest
start: 2022-12-18 00:00:00
end: 2023-12-24 00:00:00
period: 1d
basePeriod: 1h
exchanges: [{"eid":"Futures_Binance","currency":"BTC_USDT"}]
*/

// This source code is subject to the terms of the Mozilla Public License 2.0 at https://mozilla.org/MPL/2.0/
// © russtic

//@version=2

strategy("HA smoothed eliminator v2  ",pyramiding=1, slippage=10, default_qty_type=strategy.percent_of_equity,
     commission_type=strategy.commission.percent, commission_value=0.075, overlay=true,
     default_qty_value=100, initial_capital=1000)

FromMonth1 = input(defval=1, title="From Month", minval=1, maxval=12)
FromDay1 = input(defval=1, title="From Day", minval=1, maxval=31)
FromYear1 = input(defval=2019, title="From Year", minval=2010)
ToMonth1 = input(defval=12, title="To Month", minval=1, maxval=12)
ToDay1 = input(defval=31, title="To Day", minval=1, maxval=31)
ToYear1 = input(defval=2020, title="To Year", minval=2010)
start1 = timestamp(FromYear1, FromMonth1, FromDay1, 00, 00)
finish1 = timestamp(ToYear1, ToMonth1, ToDay1, 23, 59)
window1() => true

t1 = time(timeframe.period, "0300-1200")
t2 = time(timeframe.period, "0930-1700")
London = na(t1) ? na : green
NY = na(t2) ? na : red

bgcolor(London, title="London")
bgcolor(NY, title="New York")
///////////////////////////
// HA smoothed

len=(1 )
o=ema(open,len)
c=ema(close,len)
h=ema(high,len)
l=ema(low,len)

haclose = (o+h+l+c)/4
haopen = na(haopen[1]) ? (o + c)/2 : (haopen[1] + haclose[1]) / 2
hahigh = max (h, max(haopen,haclose))
halow = min (l, min(haopen,haclose))

len2=(len)
o2=ema(haopen, len2)
c2=ema(haclose, len2)
h2=ema(hahigh, len2)
l2=ema(halow, len2)

buy= (o2<c2)

closebuy= (o2>c2)

sell= (o2>c2)

closesell= (o2<c2)

//
/// END NEW SCRIPT

//
//
//                  MERGE SCRIPTS
a1= o2<c2
b1=o2>c2
is_uptrend = (a1)// and (p> 0)
is_downtrend =  (b1)// and (p <0)
barcolor(b1 ? red: a1 ? lime : blue)

//end


// =========================start     PVT -GIVES EACH BAR A VALUE
facton = (true)//, title="arrow elimination (factor) on ")
Length1 = 2//input(2, title="PVT Length", minval=1)

xPrice = close//input(title="Source", type=source, defval=close)
xsma = wma(xPrice, Length1)
nRes = xPrice - xsma
pos = iff(nRes > 0, 1,
	     iff(nRes < 0, -1, nz(pos[1], 0)))
forex= input(true, title = 'strength toggle ')
forexyes = (forex == true)? 10000 : (forex == false)? 1: na

plot(nRes*forexyes , color=aqua, title="strength", transp=100)
// =========================         end pvt
//
//=============================     start factor // ELIMINATES  weak signals
//                  start trend
//
factor = input(600.00, title = "strength elimination")
factor1 = factor - (factor*2)//input(-100.00, title = "sell strength elimination ")
facton1 = (facton == true) and is_uptrend == 1 and nRes*forexyes>factor ? 1 : (facton == true) and is_downtrend == 1 and nRes*forexyes<factor1 ? -1 : (facton == false)
// ==================== =====
//
//===========================    end factor
nRestrend = (nRes*forexyes)
//=========================== plot arrows
plot1 = iff(is_uptrend[1] == 1, 0 , 1)
plot2 = iff(is_downtrend[1]  == 1, 0 , 1)
uparrowcond =  is_downtrend ? false : nz(uparrowcond[1], false) == true ? uparrowcond[1] : (facton1 and is_uptrend and nRes*forexyes>factor)
downarrowcond =  is_uptrend ? false : nz(downarrowcond[1], false) == true ? downarrowcond[1] : (facton1 and is_downtrend and nRes*forexyes<factor1)
//prevarrowstate = uparrowcond  ? 1 : downarrowcond ? -1 : nz(prevarrowstate[1], 0)


candledir = (open < close)? 1: (open>close)? -1 : na // ONLY OPENS ON SAME BAR DIRECTION AS SIGNAL


up=nz(uparrowcond[1], false) == false and ( is_uptrend and nRes*forexyes>factor) and candledir ? 1:na
dn=nz(downarrowcond[1], false) == false and ( is_downtrend and nRes*forexyes<factor1) and candledir? -1:na


sig=0
if up==1
    sig:=1
else
    if dn==-1
        sig:=-1
    else
        sig:=sig[1]
plotarrow(sig[1]!=1 and sig==1?1:na, title="BUY ARROW", colorup=lime, maxheight=80, minheight=50, transp=0)// up arrow
plotarrow(sig[1]!=-1 and sig==-1?-1:na, title="SELL ARROW", colordown=red, maxheight=80, minheight=50, transp=0)// down arrow

//========================= alert condition
alertcondition(sig[1]!=1 and sig==1?1:na, title="BUY eliminator", message="BUY " )
alertcondition(sig[1]!=-1 and sig==-1?-1:na, title="SELL eliminator",  message="SELL ")


strategy.entry("B", true, when=(sig[1]!=1 and sig==1?1:na) and window1())
strategy.entry("S", false,when=(sig[1]!=-1 and sig==-1?-1:na) and window1())