Chiến lược đảo ngược đường trung bình động kép
Tổng quan
Chiến lược đảo ngược trung bình di chuyển kép là một chiến lược giao dịch định lượng sử dụng hai trung bình di chuyển để xác định xu hướng ngắn hạn và dài hạn. Chiến lược này kết hợp trung bình di chuyển đơn giản 10 ngày và trung bình di chuyển đơn giản 200 ngày để nắm bắt cơ hội mua lại ngắn hạn trong xu hướng dài hạn.
Nguyên tắc chiến lược
Chiến lược đảo ngược trung bình di chuyển đôi chủ yếu dựa trên các giả định sau:
Đường trung bình di chuyển đơn giản 200 ngày có thể xác định xu hướng dài hạn của thị trường. Khi giá cao hơn đường 200 ngày, đại diện cho thị trường lớn trong xu hướng giảm giá dài hạn.
Đường trung bình di chuyển đơn giản 10 ngày có thể nhận ra sự rút lui ngắn hạn của thị trường. Khi giá thấp hơn đường 10 ngày, nó đại diện cho sự rút lui trong thời gian ngắn.
Trong một xu hướng dài hạn của xu hướng giảm giá, bất kỳ sự hồi phục ngắn hạn nào cũng có thể được coi là một cơ hội hút thấp, có thể bị bắt một cách hiệu quả.
Dựa trên giả định trên, logic tạo tín hiệu giao dịch cho chiến lược này là:
Khi giá đóng cửa vượt qua đường 200 ngày và đồng thời vượt qua đường 10 ngày, đại diện cho xu hướng dài hạn giảm giá, có sự điều chỉnh ngắn hạn, do đó tạo ra tín hiệu mua.
Khi nắm giữ vị trí, nếu giá đóng cửa đi qua đường 10 ngày một lần nữa, đại diện cho xu hướng ngắn hạn, bạn nên dừng lỗ ngay lập tức. Ngoài ra, nếu giá cổ phiếu giảm mạnh dẫn đến tổn thất đạt đến đường dừng lỗ được đặt trước, bạn cũng sẽ chủ động dừng lỗ.
Khi thị trường chứng khoán giảm mạnh, bạn có thể sử dụng cơ hội giảm giá để đánh giá thời gian mua bằng cách đặt trước ngưỡng giảm giá.
Bằng cách thiết kế như vậy, có thể thực hiện hiệu quả trong xu hướng dài hạn của thị trường bò, và thiết lập dừng lỗ để kiểm soát rủi ro.
Lợi thế chiến lược
Chiến lược đảo ngược trung bình di chuyển kép có một số ưu điểm sau:
- Các chiến lược được đưa ra rõ ràng, đơn giản, dễ hiểu và dễ thực hiện.
- Sử dụng bộ lọc trung bình di chuyển kép, bạn có thể xác định hiệu quả các xu hướng dài hạn của các cổ phiếu lớn và cá nhân.
- Có hiệu quả thời gian tốt hơn. Bằng cách nắm bắt sự đảo ngược ngắn hạn, có thể đạt được hiệu quả sử dụng tài chính cao hơn.
- Cơ chế dừng lỗ tích hợp có thể kiểm soát rất tốt sự mất mát của các vị trí cá nhân.
- Các tham số có thể được thiết lập linh hoạt, áp dụng cho chỉ số lớn và cổ phiếu cá nhân phổ biến.
Rủi ro chiến lược
Mặc dù lợi thế của chiến lược đảo ngược đường trung bình di chuyển đôi là rõ ràng, nhưng cũng có một số rủi ro:
- Trong trường hợp này, bạn cần tạm dừng chiến lược và chờ đợi xu hướng rõ ràng được kích hoạt.
- Chỉ dựa vào moving average để đánh giá xu hướng và tạo ra tín hiệu, có thể bỏ qua các đặc điểm hiệu quả khác.
- Một phương pháp dừng lỗ đơn lẻ có thể quá cứng nhắc, bạn có thể thử nghiệm các loại cơ chế dừng lỗ khác nhau.
- Các tham số chiến lược cần được điều chỉnh và tối ưu hóa cho các tiêu chuẩn khác nhau, nếu không sẽ ảnh hưởng đến sự ổn định.
Hướng tối ưu hóa chiến lược
Chiến lược đảo ngược đường trung bình di chuyển đôi có thể được tối ưu hóa theo các hướng sau:
- Kiểm tra các kết hợp trung bình di chuyển với độ dài khác nhau để tìm tham số tối ưu.
- Thêm các chỉ số phụ trợ khác để tạo ra tín hiệu ổn định hơn, chẳng hạn như khối lượng giao dịch, chỉ số chấn động, v.v.
- Kiểm tra các loại dừng khác nhau: dừng theo dõi, dừng thời gian, v.v.
- Tối ưu hóa các tham số mua và dừng lỗ, cho phép nó thích ứng với các điều kiện thị trường thay đổi.
- Thêm các thuật toán học máy để tối ưu hóa các tham số với nhiều dữ liệu lịch sử hơn.
Tóm tắt
Chiến lược đảo ngược đường trung bình di chuyển đôi là một chiến lược định lượng rất thực tế. Nó sử dụng lợi thế của đường trung bình di chuyển để có được mức thu hút và dừng thấp trong các giao dịch đa đầu dài, do đó mang lại lợi nhuận cao cho một vòng.
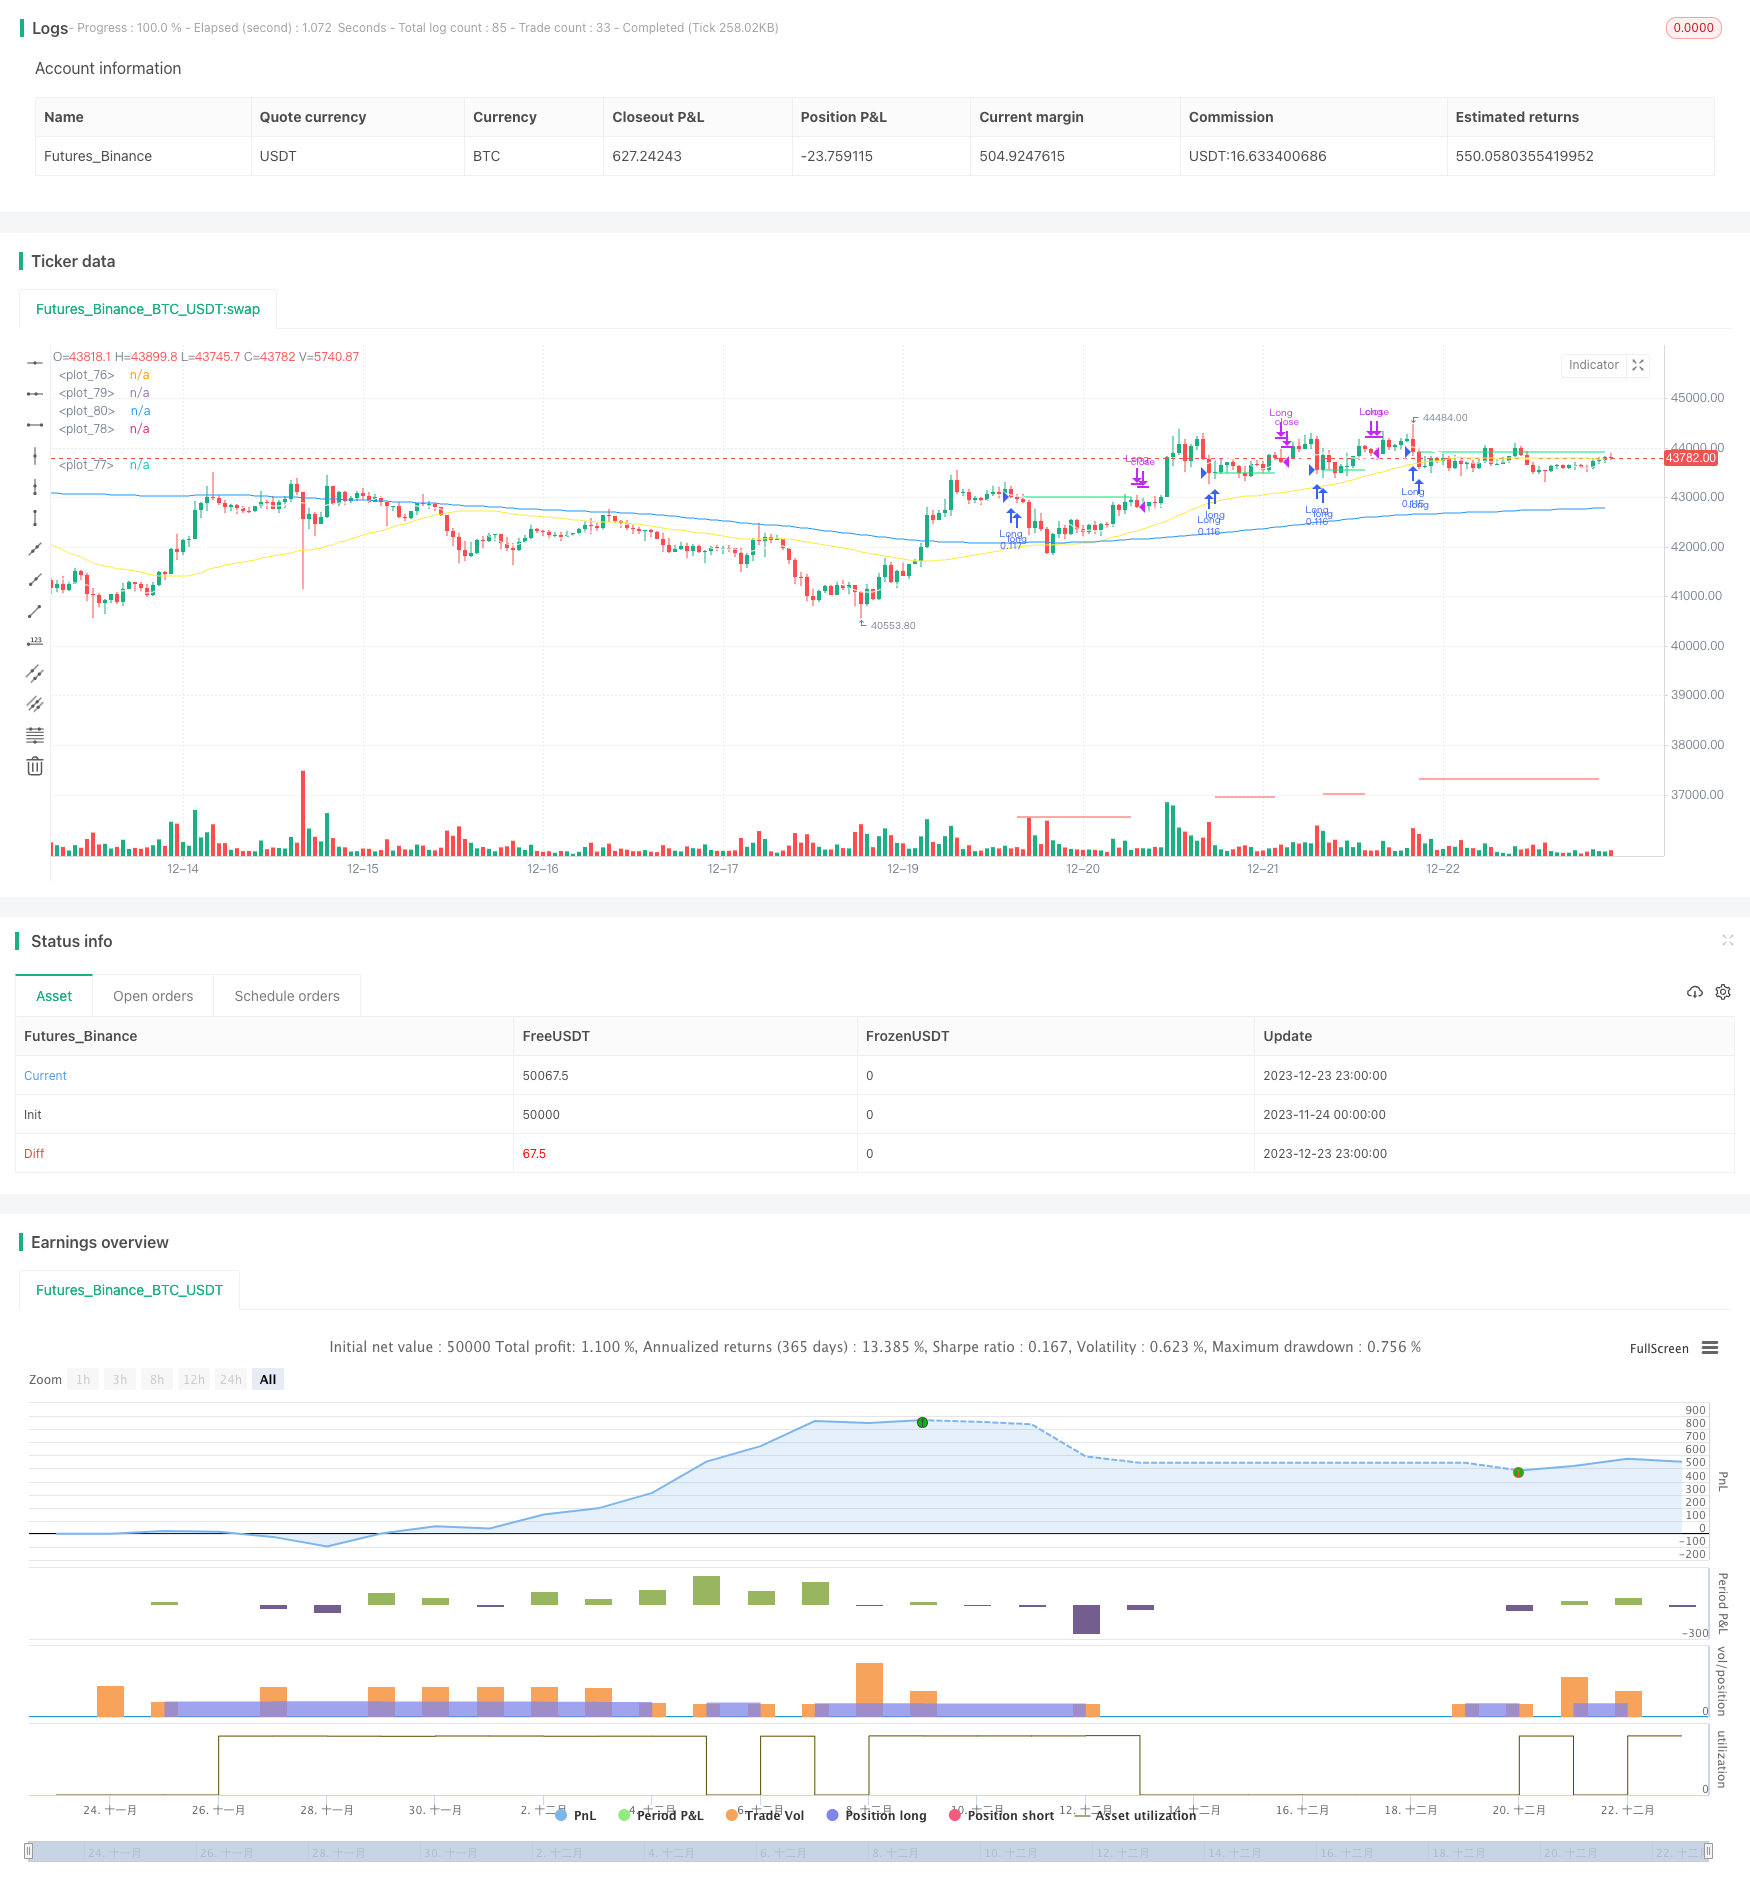
/*backtest
start: 2023-11-24 00:00:00
end: 2023-12-24 00:00:00
period: 1h
basePeriod: 15m
exchanges: [{"eid":"Futures_Binance","currency":"BTC_USDT"}]
*/

// This source code is subject to the terms of the Mozilla Public License 2.0 at https://mozilla.org/MPL/2.0/
// © Gold_D_Roger
//note: spreading 1 statement over multiple lines needs 1 apce + 1 tab | multi line function is 1 tab
//Recommended tickers: SPY (D), QQQ (D) and big indexes, AAPL (4H)

//@version=5
strategy("Davin's 10/200MA Pullback on SPY Strategy v2.0",
     overlay=true,
     initial_capital=10000,
     default_qty_type=strategy.percent_of_equity,
     default_qty_value=10, // 10% of equity on each trade
     commission_type=strategy.commission.cash_per_contract,
     commission_value=0.1) //Insert your broker's rate, IB is 0.005USD or tiered

//Best parameters
// SPY D
// Stop loss 0.15
// commission of 0.005 USD using Interactive brokers
// Exit on lower close
// Buy more when x% down --> 14%
// DO NOT include stop condition using MA crossover

// Get User Input
i_ma1           = input.int(title="MA Length 1", defval=200, step=10, group="Strategy Parameters", tooltip="Long-term MA 200")
i_ma2           = input.int(title="MA Length 2", defval=10, step=10, group="Strategy Parameters", tooltip="Short-term MA 10")
i_ma3           = input.int(title="MA Length 3", defval=50, step=1, group="Strategy Parameters", tooltip="MA for crossover signals`")
i_stopPercent   = input.float(title="Stop Loss Percent", defval=0.15, step=0.01, group="Strategy Parameters", tooltip="Hard stop loss of 10%")
i_startTime     = input(title="Start filter", defval=timestamp("01 Jan 2013 13:30 +0000"), group="Time filter", tooltip="Start date and time to begin")
i_endTime       = input(title="End filter", defval=timestamp("01 Jan 2099 19:30 +0000"), group="Time filter", tooltip="End date and time to stop")
i_lowerClose    = input.bool(title="Exit on lower close", defval=true, group="Strategy Parameters", tooltip="Wait for lower close after above 10SMA before exiting") // optimise exit strat, boolean type creates tickbox type inputs
i_contrarianBuyTheDip = input.bool(title="Buy whenever more than x% drawdown", defval=true, group="Strategy Parameters", tooltip="Buy the dip! Whenever x% or more drawdown on SPY")
i_contrarianTrigger = input.int(title="Trigger % drop to buy the dip", defval=14, step=1, group="Strategy Parameters", tooltip="% drop to trigger contrarian Buy the Dip!")
//14% to be best for SPY 1D
//20% best for AMZN 1D
i_stopByCrossover_MA2_3 = input.bool(title="Include stop condition using MA crossover", defval=false, group="Strategy Parameters", tooltip="Sell when crossover of MA2/1 happens")

// Get indicator values
ma1 = ta.sma(close,i_ma1) //param 1
ma2 = ta.sma(close,i_ma2) //param 2
ma3 = ta.sma(close,i_ma3) //param 3
ma_9 = ta.ema(close,9) //param 2
ma_20 = ta.ema(close,20) //param 3

// Check filter(s)
f_dateFilter = true //make sure date entries are within acceptable range

// Highest price of the prev 52 days: https://www.tradingcode.net/tradingview/largest-maximum-value/#:~:text=()%20versus%20ta.-,highest(),max()%20and%20ta.
highest52 = ta.highest(high,52)
overall_change = ((highest52 - close[0]) / highest52) * 100

// Check buy/sell conditions
var float buyPrice = 0 //intialise buyPrice, this will change when we enter a trade ; float = decimal number data type 0.0
buyCondition  = (close > ma1 and close < ma2 and strategy.position_size == 0 and f_dateFilter) or (strategy.position_size == 0 and i_contrarianBuyTheDip==true and overall_change > i_contrarianTrigger and f_dateFilter) // higher than 200sma, lower than short term ma (pullback) + avoid pyramiding positions
sellCondition = close > ma2 and strategy.position_size > 0 and (not i_lowerClose or close < low[1])  //check if we already in trade + close above 10MA;
// third condition: EITHER i_lowerClose not turned on OR closing price has to be < previous candle's LOW [1]

stopDistance  = strategy.position_size > 0 ? ((buyPrice - close)/close) : na // check if in trade > calc % drop dist from entry, if not na
stopPrice     = strategy.position_size > 0 ? (buyPrice - (buyPrice * i_stopPercent)) : na // calc SL price if in trade, if not, na
stopCondition = (strategy.position_size > 0 and stopDistance > i_stopPercent) or (strategy.position_size > 0 and (i_stopByCrossover_MA2_3==true and ma3 < ma1))


// Enter positions
if buyCondition
    strategy.entry(id="Long", direction=strategy.long) //long only


if buyCondition[1] // if buyCondition is true prev candle
    buyPrice := open // entry price = current bar opening price

// Exit position
if sellCondition or stopCondition
    strategy.close(id="Long", comment = "Exit" + (stopCondition ? "Stop loss=true" : "")) // if condition? "Value for true" : "value for false"
    buyPrice := na //reset buyPrice

// Plot
plot(buyPrice, color=color.lime, style=plot.style_linebr)
plot(stopPrice, color=color.red, style=plot.style_linebr, offset = -1)
plot(ma1, color=color.blue) //defval=200
plot(ma2, color=color.white) //defval=10
plot(ma3, color=color.yellow) // defval=50