Chiến lược theo xu hướng dựa trên các dải hỗ trợ và kháng cự động
Ngày tạo:
2023-12-26 11:57:20
sửa đổi lần cuối:
2023-12-26 11:57:20
sao chép:
1
Số nhấp chuột:
569
1
tập trung vào
1750
Người theo dõi
Tổng quan
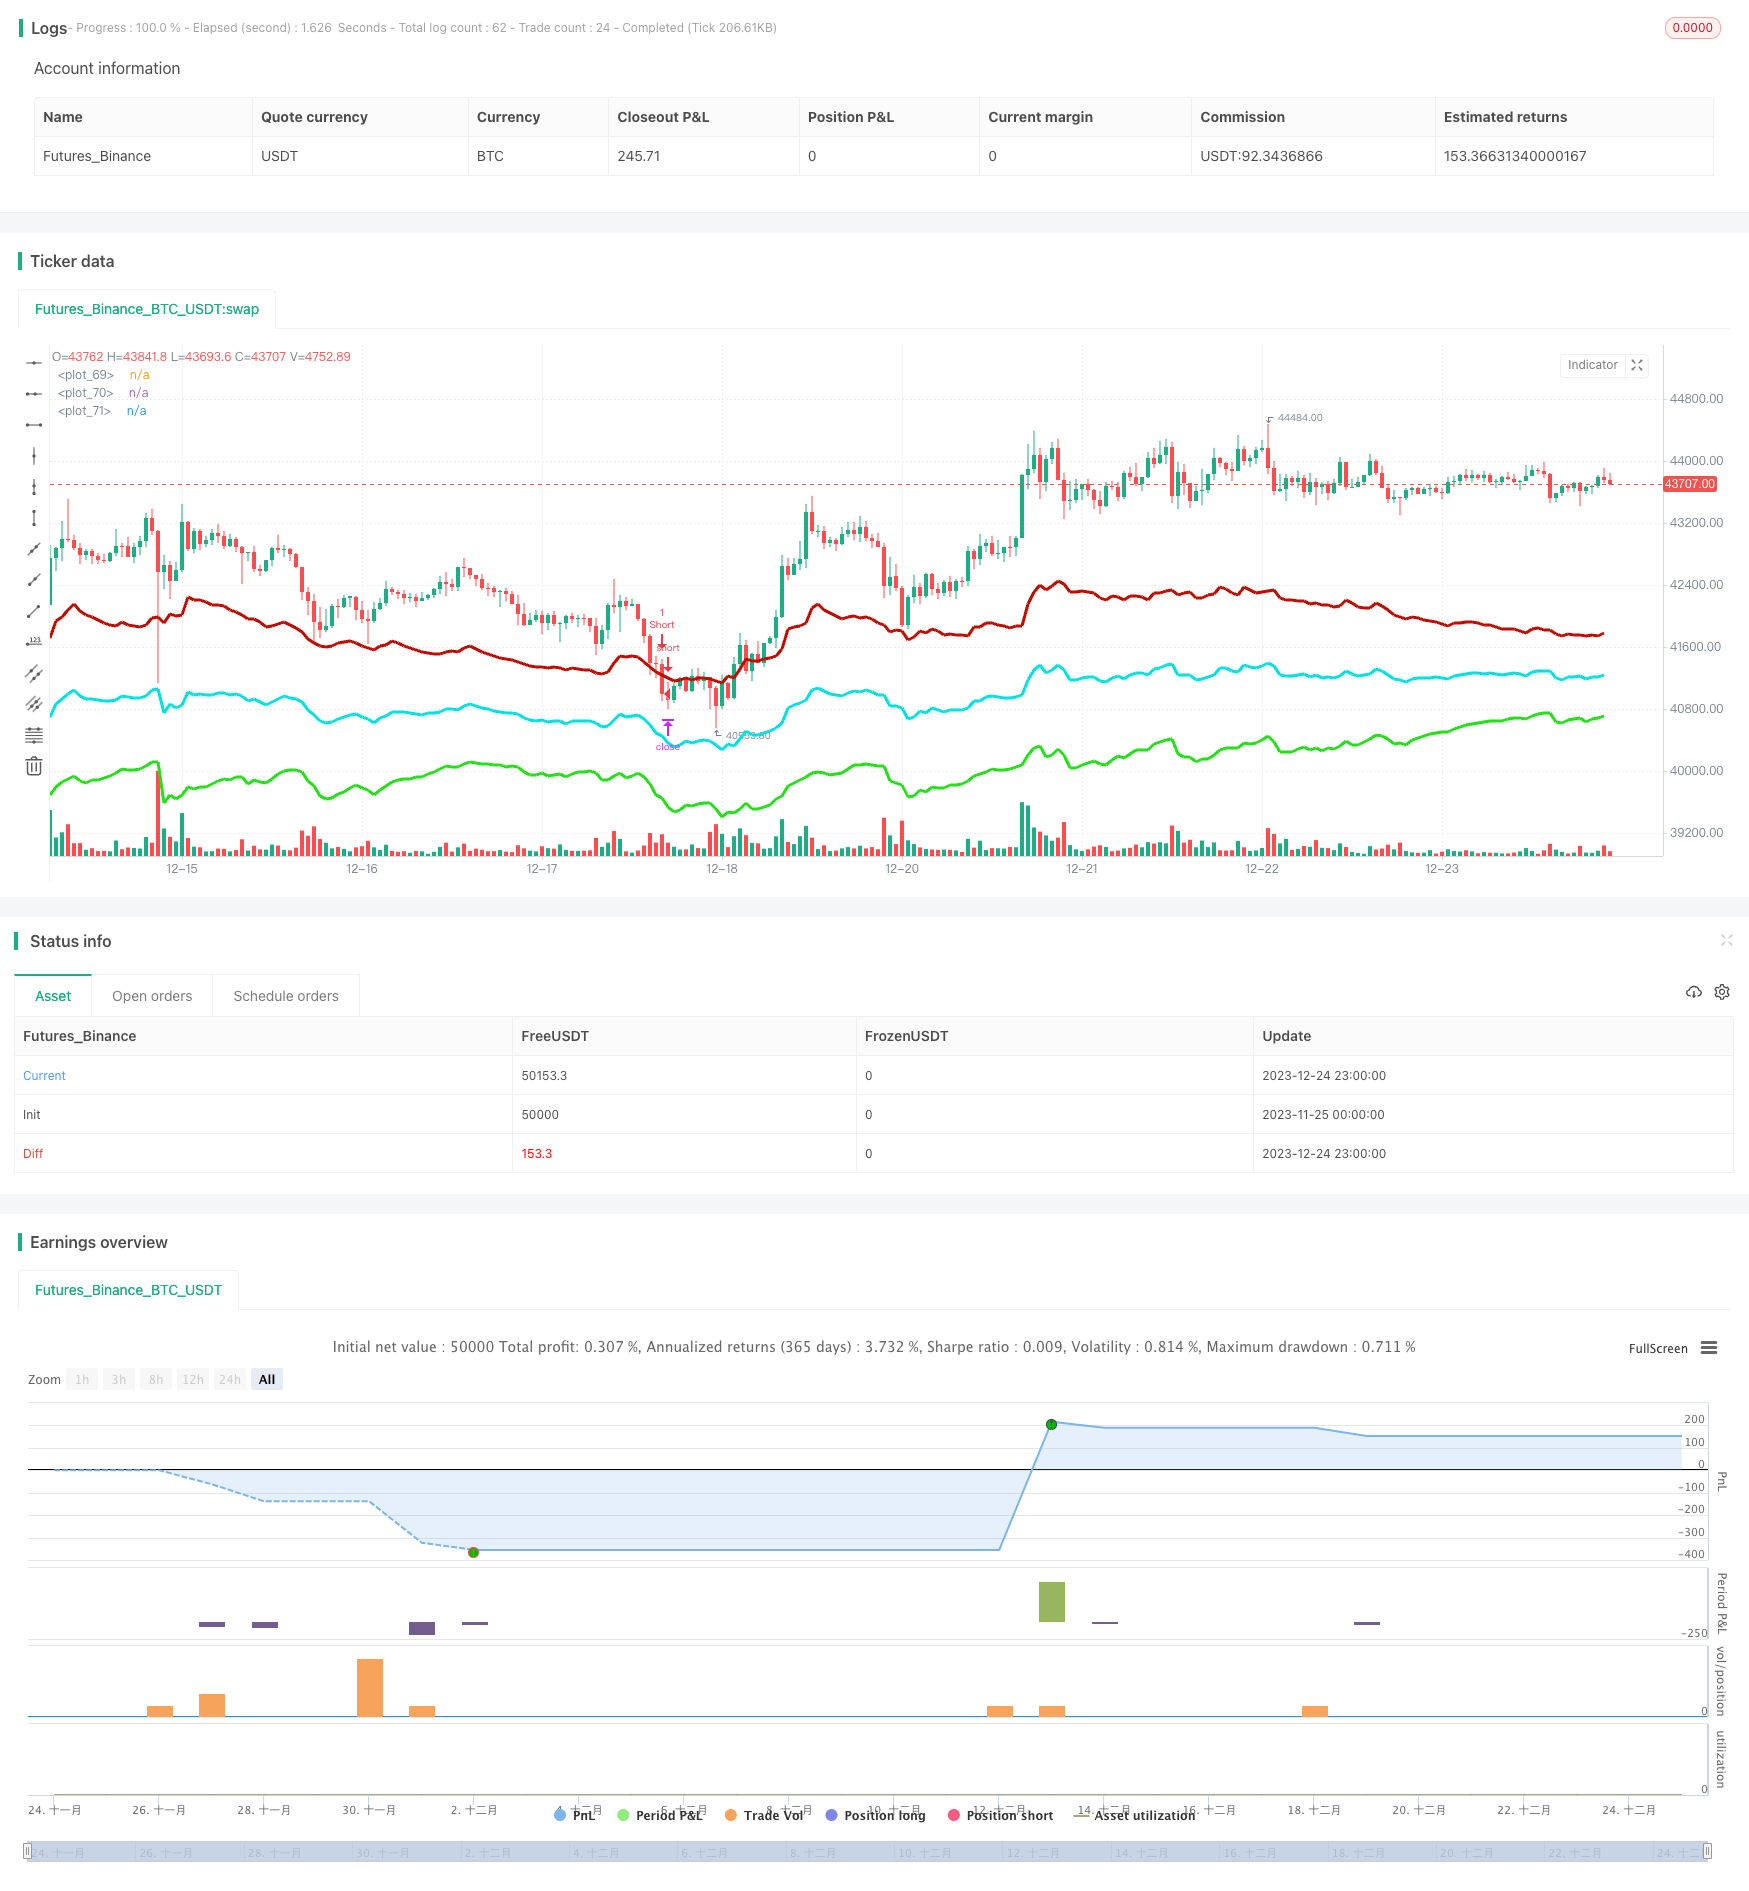
Chiến lược này tạo thành một trục trung tâm động bằng cách tính toán giá cao nhất và giá thấp nhất trong một khoảng thời gian nhất định gần đây, kết hợp với giá hiện tại. Sau đó, tạo ra một kênh giảm đỏ và một kênh tăng xanh dựa trên sự biến động gần đây.
Nguyên tắc chiến lược
- Tính giá cao nhất và giá thấp nhất trong N chu kỳ gần đây, kết hợp với giá đóng cửa hiện tại để tạo ra một trục trung tâm động
- Dải băng thông động được tạo theo ATR và nhân, băng thông thay đổi theo biến động của thị trường
- Làm nhiều khi giá tăng từ đường dẫn dưới, làm rớt khi giá tăng từ đường dẫn trên
- Có logic dừng và dừng lỗ, mục tiêu quay trở lại trục trung tâm dừng
- Đồng thời tính toán chỉ số xu hướng để lọc các giao dịch không thuận lợi
Phân tích lợi thế
- Sự thay đổi động của vị trí đường dẫn, có thể nắm bắt biến động thị trường trong thời gian thực
- Có nhiều khả năng giao dịch theo xu hướng, giúp nắm bắt xu hướng
- Kiểm soát logic dừng lỗ đơn
Phân tích rủi ro
- Các tham số không được tối ưu hóa có thể dẫn đến giao dịch quá mức
- Không thể loại bỏ hoàn toàn các giao dịch bất lợi trong xu hướng lớn
- Tuyến đường đột phá đơn phương có thể tiếp tục hoạt động
Hướng tối ưu hóa
- Điều chỉnh các tham số của đường dẫn để phù hợp hơn với các đặc điểm của các giống khác nhau
- Điều chỉnh các tham số chỉ số xu hướng để tăng khả năng tăng trưởng
- Thêm các yếu tố học máy để tối ưu hóa các tham số động
Tóm tắt
Chiến lược này chủ yếu phụ thuộc vào tính năng dao động của thị trường để kiếm lợi nhuận. Bằng cách nắm bắt điểm đảo ngược giá thông qua kênh động và kết hợp với bộ lọc xu hướng, bạn có thể tận dụng hiệu quả các giao dịch đảo ngược để kiếm lợi nhuận, đồng thời kiểm soát rủi ro.
Mã nguồn chiến lược
/*backtest
start: 2023-11-25 00:00:00
end: 2023-12-25 00:00:00
period: 1h
basePeriod: 15m
exchanges: [{"eid":"Futures_Binance","currency":"BTC_USDT"}]
*/

//@version=4
strategy(title="Strategy - Bobo PAPATR", overlay=true, default_qty_type = strategy.fixed, default_qty_value = 1, initial_capital = 10000)

// === STRATEGY RELATED INPUTS AND LOGIC ===
len = input(24, minval=1, title="Pivot Length, defines lookback for highs and lows to make pivots")
length = input(title="ATR lookback (Lower = bands more responsive to recent price action)", type=input.integer, defval=22)
myatr = atr(length)
dailyatr = myatr[1]
atrmult = input(title="ATR multiplier (Lower = wider bands)", type=input.float, defval=3)
pivot0 = (high[1] + low[1]  + close[1]) / 3

// PIVOT CALC
h = highest(len)
h1 = dev(h, len) ? na : h
hpivot = fixnan(h1)
l = lowest(len)
l1 = dev(l, len) ? na : l
lpivot = fixnan(l1)
pivot = (lpivot + hpivot + pivot0) / 3
upperband1 = (dailyatr * atrmult) + pivot
lowerband1 = pivot - (dailyatr * atrmult)
middleband = pivot

// == TREND CALC ===
i1=input(2, "Momentum Period", minval=1) //Keep at 2 usually
i2=input(20, "Slow Period", minval=1)
i3=input(5, "Fast Period", minval=1)
i4=input(3, "Smoothing Period", minval=1)
i5=input(4, "Signal Period", minval=1)
i6=input(50, "Extreme Value", minval=1)
hiDif = high - high[1]
loDif = low[1] - low
uDM = hiDif > loDif and hiDif > 0 ? hiDif : 0
dDM =  loDif > hiDif and loDif > 0 ? loDif : 0
ATR = rma(tr(true), i1)
DIu = 100 * rma(uDM, i1) / ATR
DId = 100 * rma(dDM, i1) / ATR
HLM2 =  DIu - DId
DTI = (100 * ema(ema(ema(HLM2, i2), i3), i4)) /  ema(ema(ema(abs(HLM2), i2), i3), i4)
signal = ema(DTI, i5)


// === RISK MANAGEMENT INPUTS ===
inpTakeProfit   = input(defval = 0, title = "Take Profit (In Market MinTick Value)", minval = 0)
inpStopLoss     = input(defval = 100, title = "Stop Loss (In Market MinTick Value)", minval = 0)

// === RISK MANAGEMENT VALUE PREP ===
// if an input is less than 1, assuming not wanted so we assign 'na' value to disable it.
useTakeProfit   = inpTakeProfit  >= 1 ? inpTakeProfit  : na
useStopLoss     = inpStopLoss    >= 1 ? inpStopLoss    : na

// === STRATEGY - LONG POSITION EXECUTION ===
enterLong = (((low<=lowerband1) and (close >lowerband1)) or ((open <= lowerband1) and (close > lowerband1))) and (strategy.opentrades <1) and (atr(3) > atr(50)) and (signal>signal[3])
exitLong = (high > middleband)
strategy.entry(id = "Long", long = true, when = enterLong)
strategy.close(id = "Long", when = exitLong)

// === STRATEGY - SHORT POSITION EXECUTION ===
enterShort = (((high>=upperband1) and (close < upperband1)) or ((open >= upperband1) and (close < upperband1))) and (strategy.opentrades <1) and (atr(3) > atr(50)) and (signal<signal[3])
exitShort = (low < middleband)
strategy.entry(id = "Short", long = false, when = enterShort)
strategy.close(id = "Short", when = exitShort)

// === STRATEGY RISK MANAGEMENT EXECUTION ===
strategy.exit("Exit Long", from_entry = "Long", profit = useTakeProfit, loss = useStopLoss)
strategy.exit("Exit Short", from_entry = "Short", profit = useTakeProfit, loss = useStopLoss)

// === CHART OVERLAY ===
plot(upperband1, color=#C10C00, linewidth=3)
plot(lowerband1, color=#23E019, linewidth=3)
plot(middleband, color=#00E2E2, linewidth=3)
//plot(strategy.equity, title="equity", color=red, linewidth=2, style=areabr)