Chiến lược giao dịch RSI Pullback của Bollinger Band Downward Crossover
Tổng quan
Chiến lược này sử dụng các chỉ số Bollinger Bands để xác định xem giá có đi vào vùng quá mua hay quá bán hay không, kết hợp với các chỉ số RSI để xác định xem có cơ hội điều chỉnh hay không, để tạo khoảng trống khi vùng quá mua hình thành một cái gai chết và dừng lại khi giá tăng vượt quá Bollinger Bands.
Nguyên tắc chiến lược
Chiến lược này dựa trên các nguyên tắc sau:
- Khi giá đóng cửa trên đường băng Brin trên đường ray, nó cho thấy tài sản đã đi vào khu vực mua quá mức và có cơ hội điều chỉnh lại.
- Chỉ số RSI có hiệu quả trong việc đánh giá các vùng quá mua quá bán, RSI> 70 là vùng quá mua
- Cắt lỗ khi giá đóng cửa đi từ trên xuống dưới
- Khi RSI quay trở lại hoặc kích hoạt điểm dừng lỗ từ vùng quá mua
Phân tích lợi thế
Chiến lược này có những ưu điểm sau:
- Sử dụng Brin để xác định vùng mua quá mức và bán quá mức để tăng tỷ lệ thành công của giao dịch
- Kết hợp các chỉ số RSI để lọc cơ hội phá vỡ giả mạo, tránh mất mát không cần thiết
- Tỷ lệ lợi nhuận cao, kiểm soát rủi ro tối đa
Phân tích rủi ro
Chiến lược này có những rủi ro sau:
- Tiếp tục tăng sau khi phá vỡ đường ray dẫn đến tổn thất mở rộng hơn nữa
- RSI thất bại trong việc giảm giá, lỗ hổng tiếp tục tăng
- Các nhà đầu tư không có quyền giao dịch.
Bạn có thể làm giảm nguy cơ bằng cách:
- Điều chỉnh điểm dừng đúng cách, dừng lỗ kịp thời
- Kết hợp các chỉ số khác để đánh giá tín hiệu RSI giảm
- Kết hợp với chỉ số đường cân bằng, để xác định xem có vào hồi phục hay không
Hướng tối ưu hóa
Chiến lược này có thể được tối ưu hóa bằng cách:
- Tối ưu hóa tham số Brin để phù hợp với nhiều loại giao dịch
- Tối ưu hóa các tham số RSI để cải thiện hiệu quả của chỉ số
- Thêm một số chỉ số khác để đánh giá điểm đảo ngược xu hướng
- Thêm logic giao dịch đa đầu
- Kết hợp chiến lược dừng lỗ, động điều chỉnh điểm dừng lỗ
Tóm tắt
Chiến lược này nói chung là một chiến lược giao dịch đường ngắn nhanh chóng trong khu vực mua quá mức điển hình. Sử dụng đường dây Brin để xác định điểm mua và bán, tín hiệu lọc RSI. Kiểm soát mức độ rủi ro bằng cách dừng lỗ hợp lý. Có thể nâng cao hiệu quả bằng cách tối ưu hóa tham số, chỉ số kết hợp, thêm logic mở vị trí.
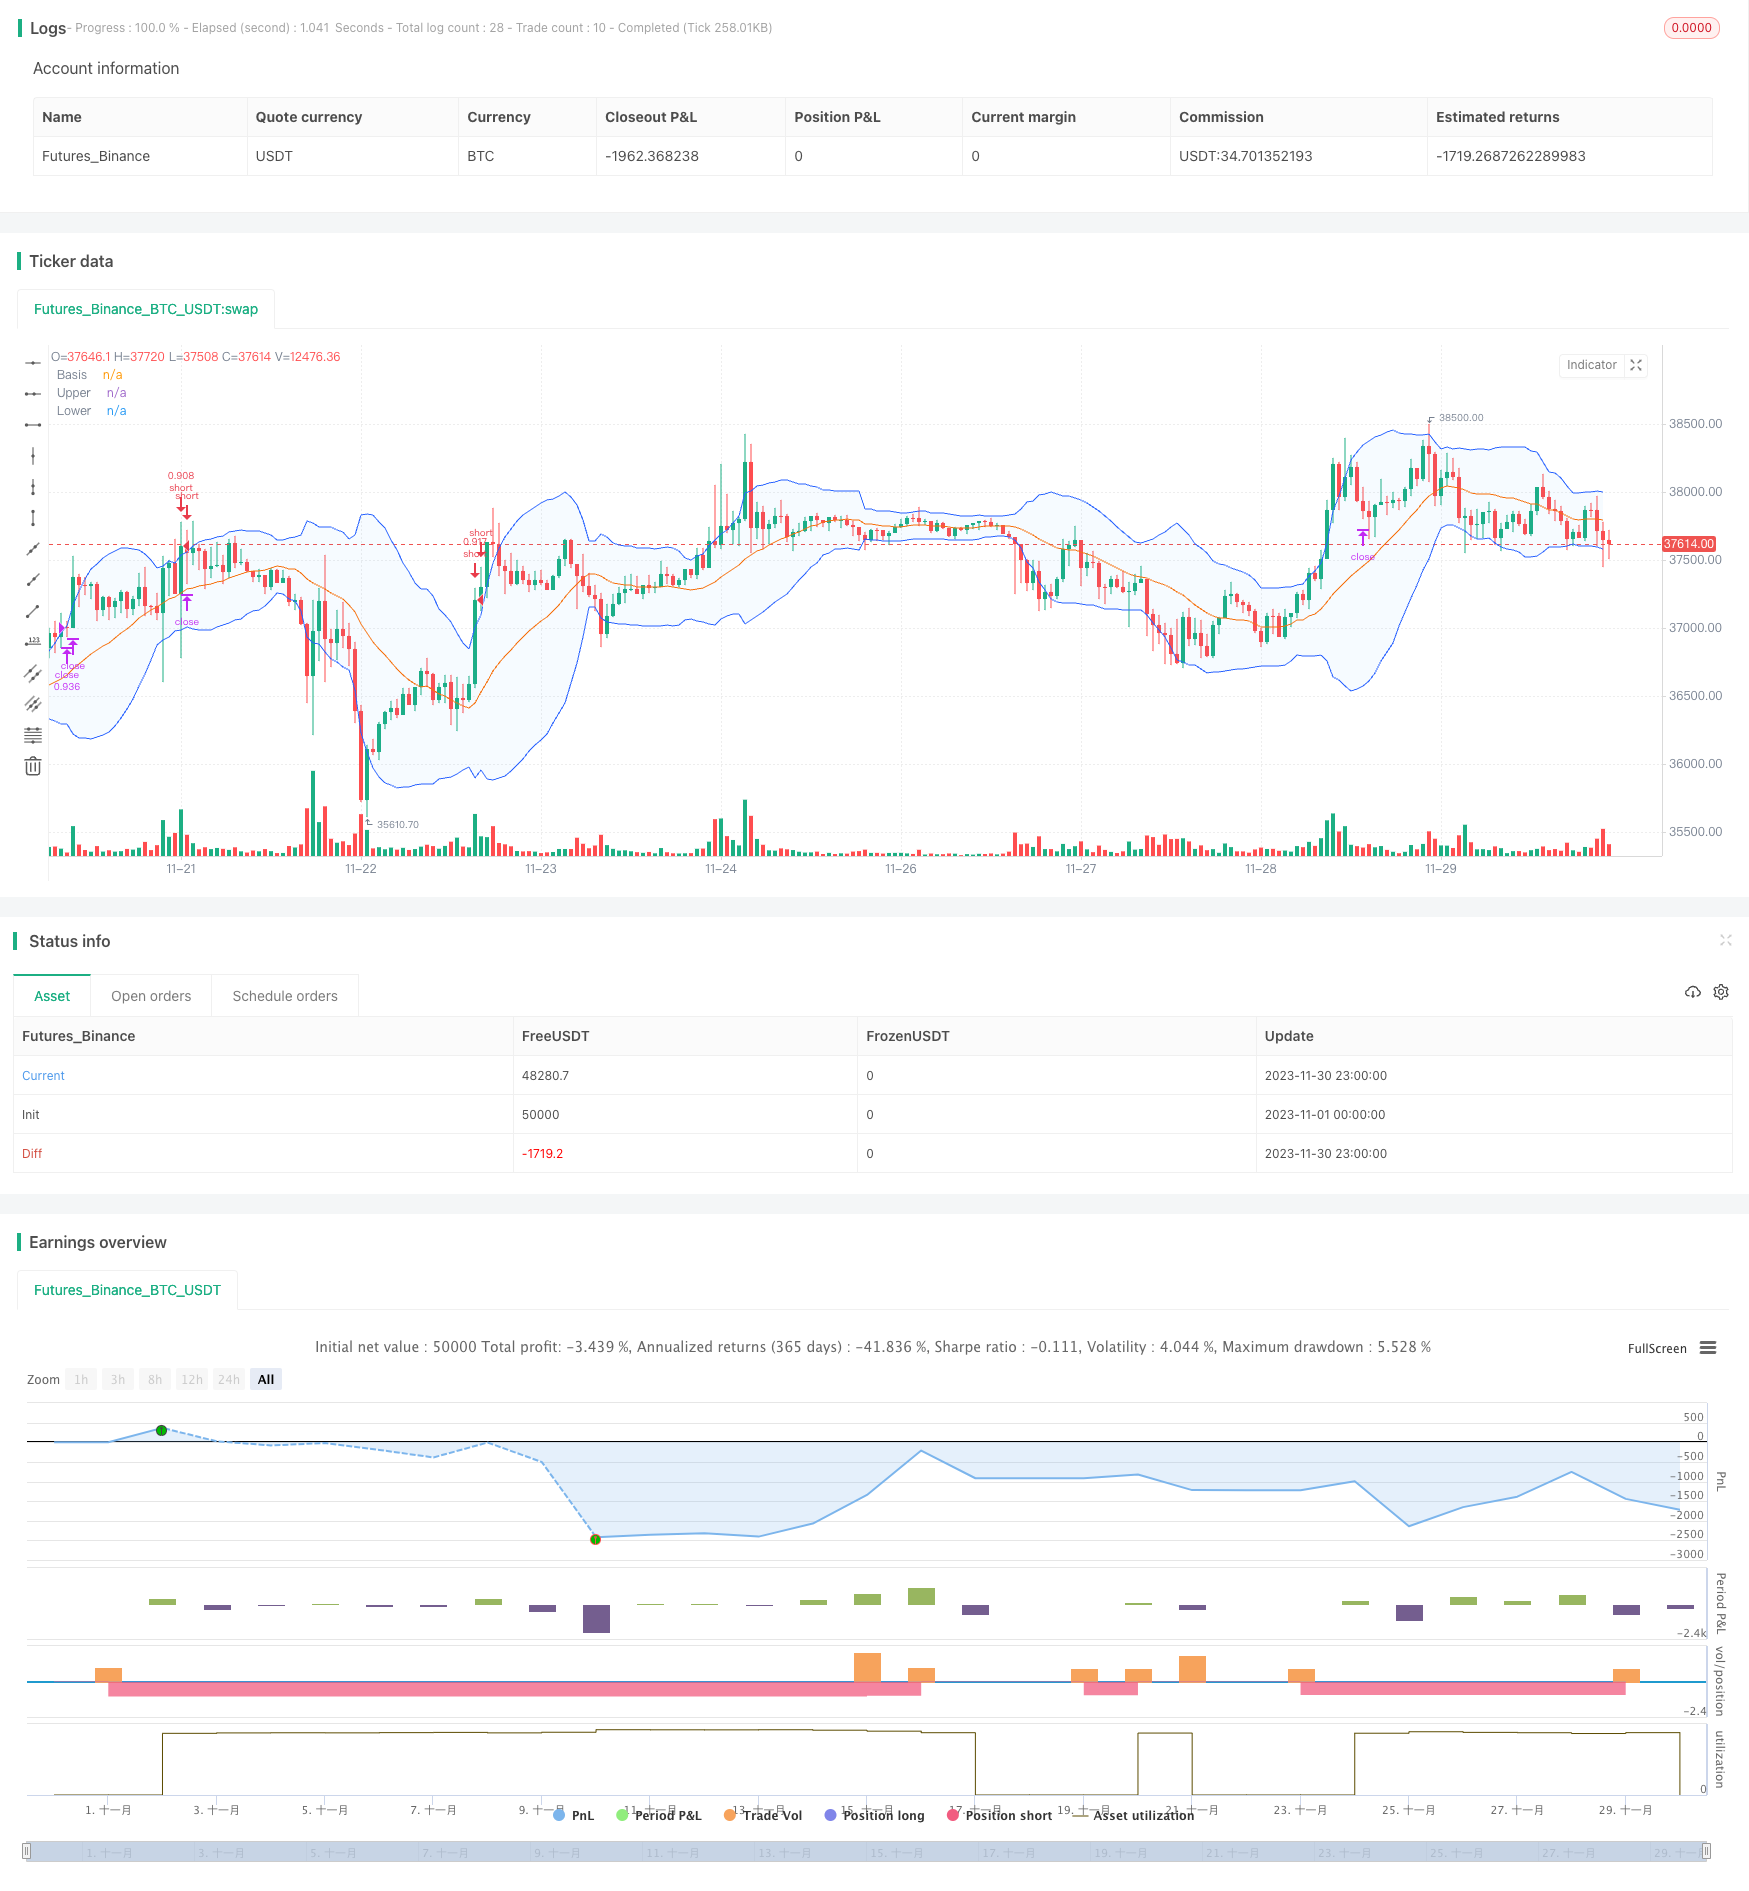
/*backtest
start: 2023-11-01 00:00:00
end: 2023-11-30 23:59:59
period: 1h
basePeriod: 15m
exchanges: [{"eid":"Futures_Binance","currency":"BTC_USDT"}]
*/

//@version=5
// This source code is subject to the terms of the Mozilla Public License 2.0 at https://mozilla.org/MPL/2.0/
// © Coinrule


strategy("Bollinger Band Below Price with RSI",
         overlay=true,
         initial_capital=1000,
         process_orders_on_close=true,
         default_qty_type=strategy.percent_of_equity,
         default_qty_value=70,
         commission_type=strategy.commission.percent,
         commission_value=0.1)

showDate = input(defval=true, title='Show Date Range')
timePeriod = time >= timestamp(syminfo.timezone, 2022, 1, 1, 0, 0)
notInTrade = strategy.position_size <= 0

//Bollinger Bands Indicator
length = input.int(20, minval=1)
src = input(close, title="Source")
mult = input.float(2.0, minval=0.001, maxval=50, title="StdDev")
basis = ta.sma(src, length)
dev = mult * ta.stdev(src, length)
upper = basis + dev
lower = basis - dev
offset = input.int(0, "Offset", minval = -500, maxval = 500)
plot(basis, "Basis", color=#FF6D00, offset = offset)
p1 = plot(upper, "Upper", color=#2962FF, offset = offset)
p2 = plot(lower, "Lower", color=#2962FF, offset = offset)
fill(p1, p2, title = "Background", color=color.rgb(33, 150, 243, 95))

// RSI inputs and calculations
lengthRSI = 14
RSI = ta.rsi(close, lengthRSI)


// Configure trail stop level with input options
longTrailPerc = input.float(title='Trail Long Loss (%)', minval=0.0, step=0.1, defval=3) * 0.01
shortTrailPerc = input.float(title='Trail Short Loss (%)', minval=0.0, step=0.1, defval=3) * 0.01

// Determine trail stop loss prices
//longStopPrice = 0.0
shortStopPrice = 0.0

//longStopPrice := if strategy.position_size > 0
    //stopValue = close * (1 - longTrailPerc)
    //math.max(stopValue, longStopPrice[1])
//else
    //0

shortStopPrice := if strategy.position_size < 0
    stopValue = close * (1 + shortTrailPerc)
    math.min(stopValue, shortStopPrice[1])
else
    999999


//Entry and Exit
strategy.entry(id="short", direction=strategy.short, when=ta.crossover(close, upper) and RSI < 70 and timePeriod and notInTrade)

if (ta.crossover(upper, close) and RSI > 70 and timePeriod)
    strategy.exit(id='close', limit = shortStopPrice)