Chiến lược theo xu hướng Ichimoku Kinko Hyo
Tổng quan
Chiến lược cân bằng bằng mắt là một chiến lược theo dõi xu hướng, nó đánh giá hướng xu hướng bằng cách tính toán đường trung bình và kết hợp với chỉ số Ichimoku Kinko Hyo để thực hiện giao dịch theo dõi xu hướng có rủi ro thấp.
Nguyên tắc chiến lược
Chiến lược này chủ yếu dựa trên chỉ số Ichimoku Kinko Hyo để đánh giá xu hướng. Ichimoku Kinko Hyo, còn được gọi là biểu đồ cân bằng đầu tiên, bao gồm đường chuyển đổi ((Tenkan-sen), đường chuẩn ((Kijun-sen), đường dẫn đầu ((Senkou Span A) và đường xác nhận ((Senkou Span B), tạo thành vùng cân bằng giữa phía trước và phía sau, được gọi là dải vải vải vải.
Chiến lược này kết hợp giữa giá và đường trung bình để xác định xu hướng. Nó tạo ra tín hiệu mua khi giá vượt qua đường chuẩn và đường chuyển đổi; nó tạo ra tín hiệu bán khi giá phá vỡ vùng mây bên dưới. Bằng cách kết hợp như vậy, bạn có thể lọc hiệu quả các vụ phá vỡ giả và khóa hướng xu hướng.
Phân tích lợi thế
- Sử dụng chỉ số Ichimoku Kinko Hyo để đánh giá xu hướng và tránh bị lừa dối bởi những bước đột phá giả mạo của thị trường.
- Các tham số đường trung bình có thể điều chỉnh, có thể được tối ưu hóa cho các chu kỳ khác nhau
- Kết hợp với phán đoán mối quan hệ đồng tuyến, có thể khóa hướng xu hướng hiệu quả
- Sử dụng Cloud Band Judgment để thực hiện giao dịch theo dõi xu hướng có rủi ro thấp
Phân tích rủi ro
- Các tín hiệu sai trong cơn động đất
- Thiết lập tham số không chính xác có thể dẫn đến tín hiệu giao dịch quá thường xuyên hoặc không kịp thời
- Cần xác định xu hướng và điều chỉnh tham số bằng tay
Hướng tối ưu hóa
Chiến lược này có thể được tối ưu hóa theo các khía cạnh sau:
- Tính năng Ichimoku được tối ưu hóa cho nhiều chu kỳ thời gian hơn
- Tăng chiến lược dừng lỗ, kiểm soát tổn thất đơn lẻ
- Kết hợp các chỉ số khác để đánh giá xu hướng mạnh hoặc yếu, tránh bị lừa bởi các biến động
- Tăng điều kiện mở kho để tránh các trường hợp cực đoan
Tóm tắt
Nhìn chung, chiến lược cân bằng một mắt có thể xác định hướng xu hướng thông qua chỉ số Ichimoku Kinko Hyo, có thể khóa xu hướng một cách hiệu quả và kết hợp với phán đoán mối quan hệ đường thẳng để tạo ra tín hiệu giao dịch, để thực hiện giao dịch theo dõi xu hướng có rủi ro thấp. Chiến lược này có thể điều chỉnh và tối ưu hóa các tham số để thích ứng với môi trường thị trường khác nhau, đáng để các nhà đầu tư nghiên cứu và sử dụng thêm.
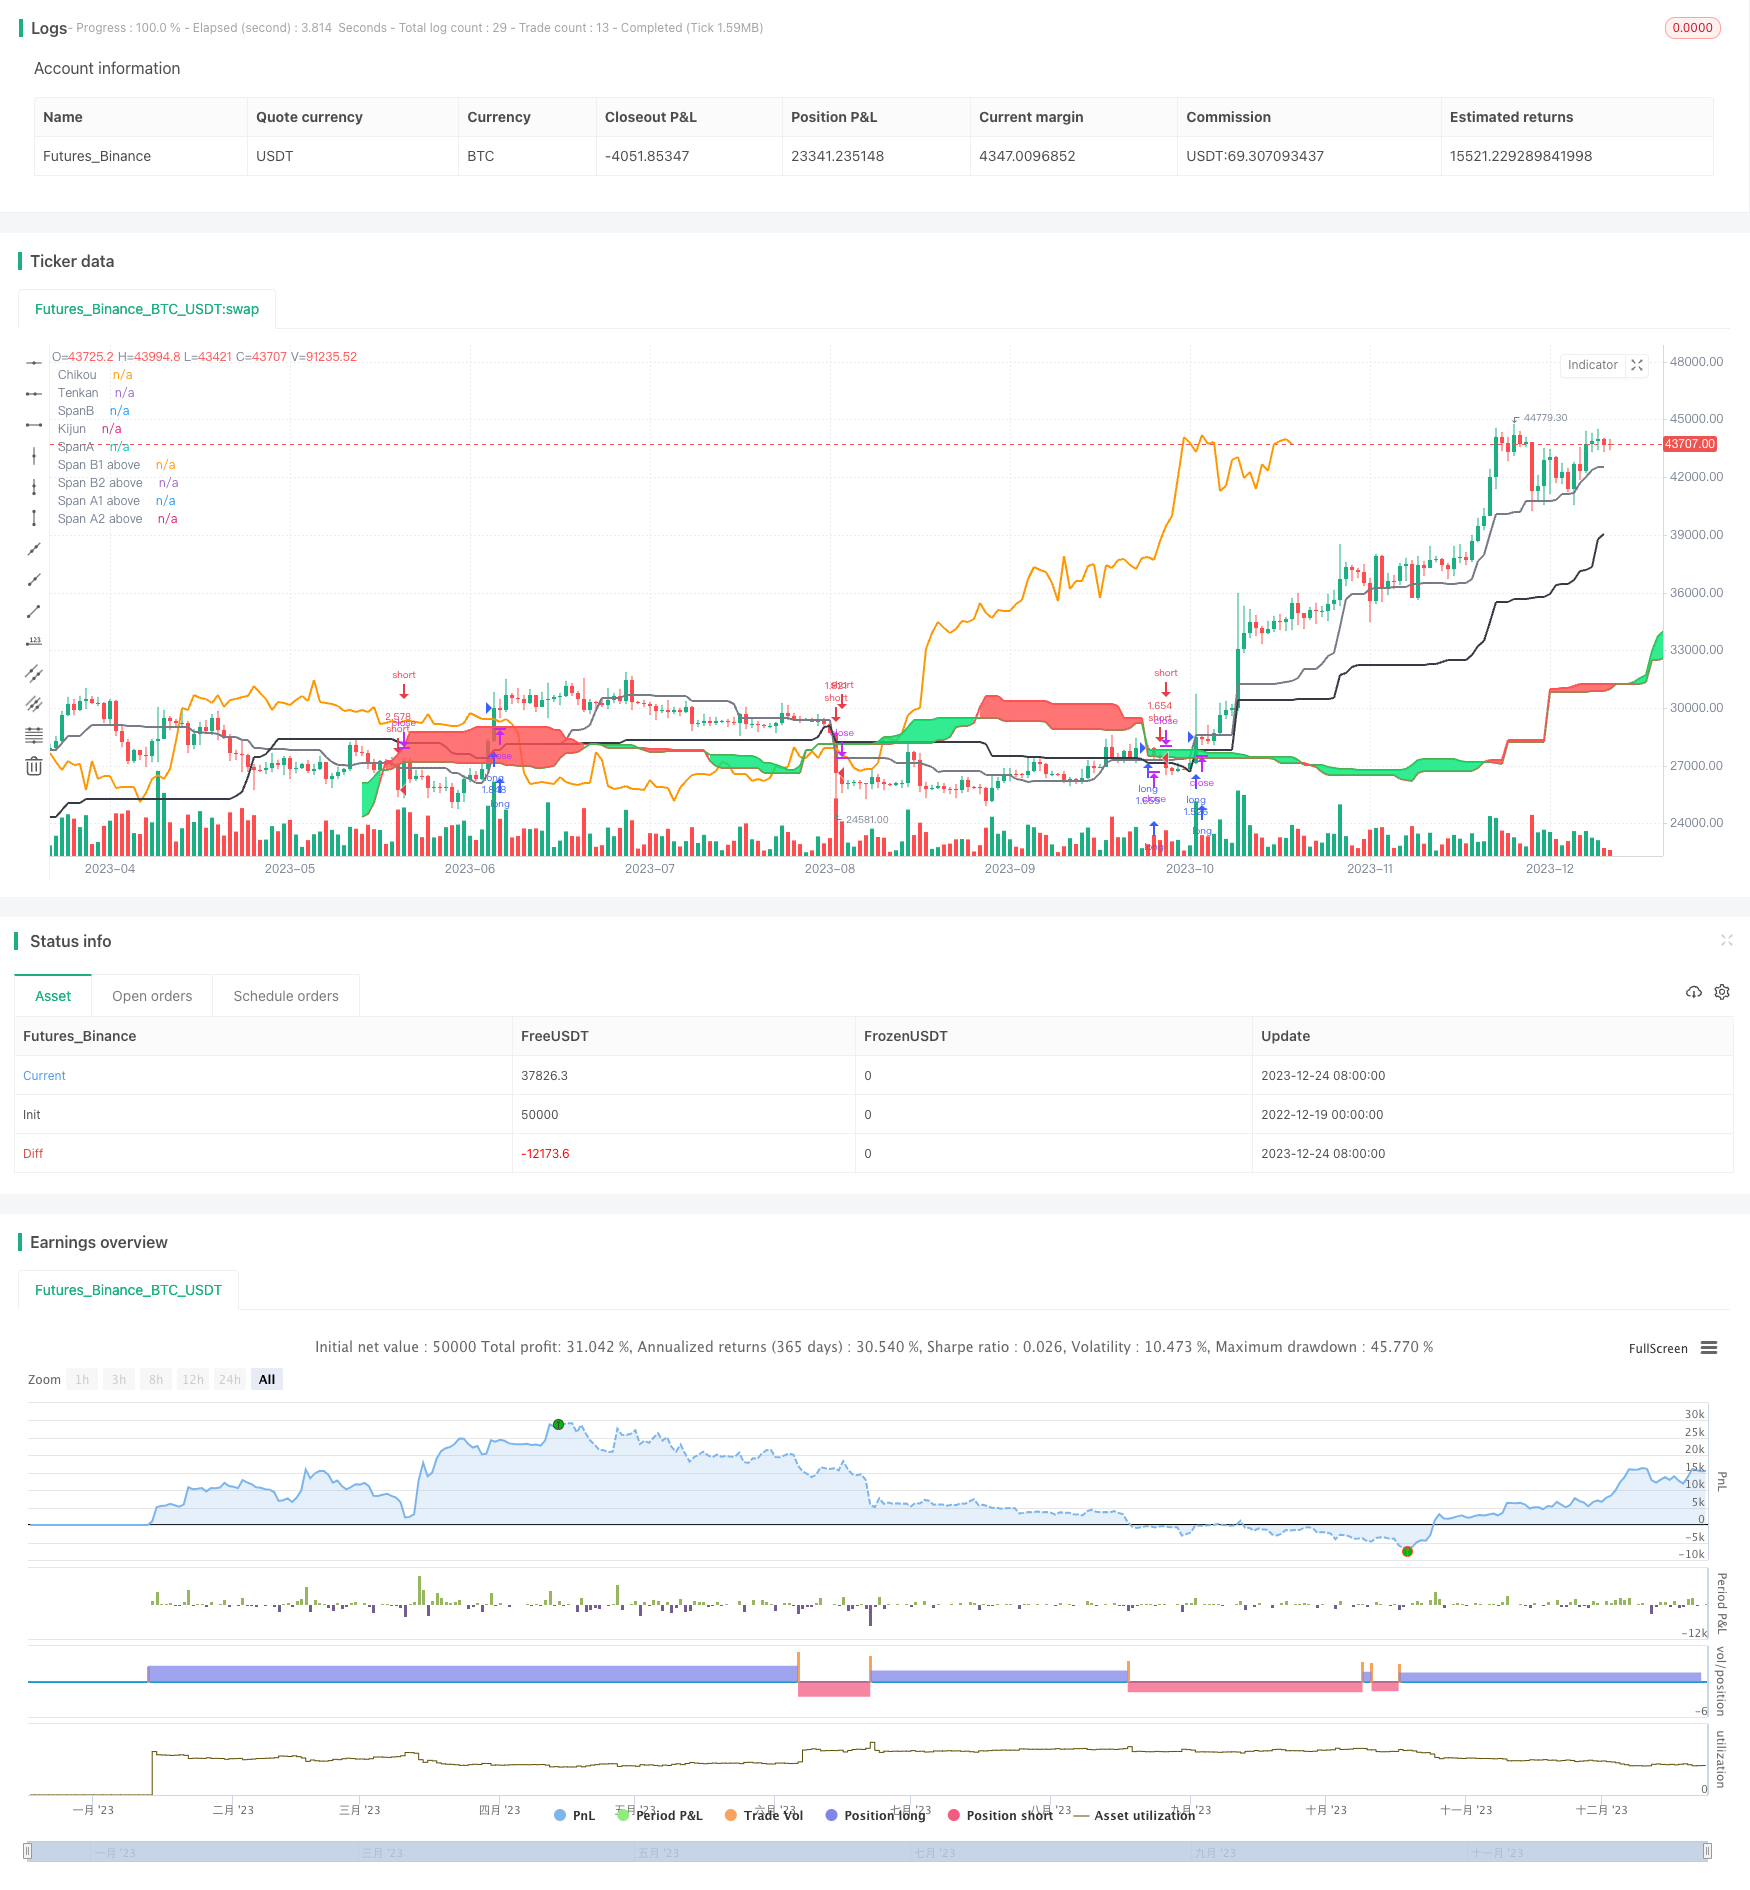
/*backtest
start: 2022-12-19 00:00:00
end: 2023-12-25 00:00:00
period: 1d
basePeriod: 1h
exchanges: [{"eid":"Futures_Binance","currency":"BTC_USDT"}]
*/

//@version=3
// Credit for the initial code to nathanhoffer - I simply added the ability to select a time period
//
strategy("Cloud Breakout", overlay=true, initial_capital=10000, default_qty_type=strategy.percent_of_equity, default_qty_value=100, commission_type=strategy.commission.percent, commission_value=0.0)

/////////////// Component Code Start ///////////////
testStartYear = input(2016, "Backtest Start Year")
testStartMonth = input(1, "Backtest Start Month")
testStartDay = input(1, "Backtest Start Day")
testPeriodStart = timestamp(testStartYear,testStartMonth,testStartDay, 0, 0)

testStopYear = input(2019, "Backtest Stop Year")
testStopMonth = input(12, "Backtest Stop Month")
testStopDay = input(31, "Backtest Stop Day")
testPeriodStop = timestamp(testStopYear,testStopMonth,testStopDay, 0, 0)

testPeriod() => true

Ten = input(18, minval=1, title="Tenkan")
Kij = input(60, minval=1, title="Kijun")
LeadSpan = input(30, minval=1, title="Senkou B")
Displace = input(52, minval=1, title="Senkou A")
SpanOffset = input(52, minval=1, title="Span Offset")

sts = input(true, title="Show Tenkan")
sks = input(true, title="Show Kijun")
ssa = input(true, title="Show Span A")
ssb = input(true, title="Show Span B")
sc = input(true, title="Show Chikou")

source = close

//Script for Ichimoku Indicator
donchian(len) => avg(lowest(len), highest(len))
TS = donchian(Ten)
KS = donchian(Kij)
SpanA = avg(TS, KS)
SpanB = donchian(LeadSpan)

CloudTop = max(TS, KS)

Chikou = source[Displace]
SpanAA = avg(TS, KS)[SpanOffset]
SpanBB = donchian(LeadSpan)[SpanOffset]

//Kumo Breakout (Long)
SpanA_Top = SpanAA >= SpanBB ? 1 : 0
SpanB_Top = SpanBB >= SpanAA ? 1 : 0

SpanA_Top2 = SpanA >= SpanB ? 1 : 0
SpanB_Top2 = SpanB >= SpanA ? 1 : 0

SpanA1 = SpanA_Top2 ? SpanA : na
SpanA2 = SpanA_Top2 ? SpanB : na

SpanB1 = SpanB_Top2 ? SpanA : na
SpanB2 = SpanB_Top2 ? SpanB : na

//plot for Tenkan and Kijun (Current Timeframe)
p1= plot(sts and TS ? TS : na, title="Tenkan", linewidth = 2, color = gray)
p2 = plot(sks and KS ? KS : na, title="Kijun", linewidth = 2, color = black)
//p5 = plot(sc and KS ? KS : na, title="Chikou", linewidth = 2, color = orange)
p5 = plot(sc and Displace ? close: na, title="Chikou", linewidth = 2, offset=-Displace, color = orange)

//Plot for Kumo Cloud (Dynamic Color)
p3 = plot(ssa and SpanA ? SpanA : na, title="SpanA", linewidth=2, offset=Displace, color=green)
p4 = plot(ssb and SpanB ? SpanB : na, title="SpanB", linewidth=2, offset=Displace, color=red)

p8 = plot(ssa and SpanA1 ? SpanA1 : na, title="Span A1 above", style=linebr, linewidth=1, offset=Displace, color=green)
p9 = plot(ssa and SpanA2 ? SpanA2 : na, title="Span A2 above", style=linebr, linewidth=1, offset=Displace, color=green)
p10 = plot(ssb and SpanB1 ? SpanB1 : na, title="Span B1 above", style=linebr, linewidth=1, offset=Displace, color=red)
p11 = plot(ssb and SpanB2 ? SpanB2 : na, title="Span B2 above", style=linebr, linewidth=1, offset=Displace, color=red)

fill(p8, p9, color = lime, transp=70, title="Kumo Cloud Up")
fill (p10, p11, color=red, transp=70, title="Kumo Cloud Down")

LongSpan = (SpanA_Top and source[1] < SpanAA[1] and source > SpanAA) or (SpanB_Top and source[1] < SpanBB[1] and source > SpanBB) ? 1 : 0
cupSpan = LongSpan  == 1 ? LongSpan : 0

Long_Breakout = (SpanA_Top ==1 and crossover(source, SpanAA)) or (SpanB_Top ==1 and crossover(source, SpanBB))

ShortSpan = (SpanB_Top and source[1] > SpanAA[1] and source < SpanAA) or (SpanA_Top and source[1] > SpanBB[1] and source < SpanBB) ? 1 : 0
cdnSpan = ShortSpan == 1 ? ShortSpan : 0

Short_Breakout = (SpanA_Top ==1 and crossunder(source, SpanBB)) or (SpanB_Top ==1 and crossunder(source, SpanAA))

//Kumo Twist
Kumo_Twist_Long = SpanA[1] < SpanB[1] and SpanA > SpanB ? 1 : 0
Kumo_Twist_Short = SpanA[1] > SpanB[1] and SpanA < SpanB ? 1 : 0

cupD = Kumo_Twist_Long == 1 ? Kumo_Twist_Long : 0
cdnD = Kumo_Twist_Short == 1 ? Kumo_Twist_Short : 0

Chikou_Above = close > Chikou
Chikou_Below = close < Chikou

long = (cross(TS, SpanA) or cross(TS, SpanB)) and TS>SpanA and TS>SpanB and TS>=KS
short = cross(TS, KS) and KS >= TS

if testPeriod()
    strategy.entry("long", strategy.long, when=Long_Breakout)
    strategy.entry("short", strategy.short, when=Short_Breakout)