Chiến lược mua và bán Bullish Engulfing
Tổng quan
Chiến lược mua bán Bullish Engulfing là một chiến lược giao dịch định lượng dựa trên hình dạng K. Chiến lược này thu lợi nhuận bằng cách nắm bắt cơ hội đảo ngược giá cổ phiếu bằng cách nhận diện hình dạng K của Bullish Engulfing.
Những ưu điểm chính của chiến lược này là:
- Dựa trên lý thuyết phân tích kỹ thuật đã được chứng minh, xác định cơ hội biến động giá có xác suất cao
- Các tín hiệu giao dịch đơn giản và trực quan
- Những rủi ro có thể kiểm soát được
Nguyên tắc chiến lược
Chiến lược này dựa trên hình thức K-line của Bullish Engulfing để xác định sự đảo ngược giá.
Khi một cổ phiếu đang trong xu hướng giảm, nếu một K-line nhỏ xuất hiện, một K-line tiếp theo sẽ hoàn toàn nuốt chửng K-line trước đó, và giá đóng cửa sẽ cao hơn giá cao nhất của K-line trước đó, tức là hình thành Bullish Engulfing.
Chiến lược này sẽ mở nhiều vị trí khi nhận ra hình thức Bullish Engulfing, và thiết lập Exit Stop Loss, mục tiêu 1%, dừng 1%, khóa lợi nhuận.
Phân tích lợi thế chiến lược
Chiến lược này có những ưu điểm sau:
- Dựa trên lý thuyết phân tích kỹ thuật đã được chứng minh, Bullish Engulfing là một tín hiệu biến động giá có xác suất cao, có thể nắm bắt hiệu quả cơ hội biến động giá.
- Tín hiệu giao dịch đơn giản, trực quan, dễ hiểu và phù hợp với giao dịch định lượng.
- Sử dụng các loại có tính thanh khoản cao như tương lai chỉ số cổ phiếu, có thể đạt được hiệu quả cao trong giao dịch.
- Cài đặt Stop Stop Loss Exit, bạn có thể kiểm soát tốt tỷ lệ thua lỗ của mỗi giao dịch, đảm bảo kết quả thua lỗ và tránh thua lỗ lớn.
- Các tham số chiến lược có thể được điều chỉnh linh hoạt để phù hợp với các giống và môi trường thị trường khác nhau.
Phân tích rủi ro chiến lược
Chiến lược này cũng có một số rủi ro:
- Dựa trên lý thuyết phân tích kỹ thuật, có một số rủi ro về tín hiệu sai.
- Thay đổi điều kiện thị trường có thể gây ra các tham số không hiệu quả, cần phải điều chỉnh.
- Thiết lập dừng lỗ quá nhỏ có thể gây ra lỗ nhỏ, thiết lập quá lớn có thể làm tăng lỗ.
Đối với những rủi ro trên, chúng ta có thể thực hiện các biện pháp sau:
- Tối ưu hóa các tham số, xác minh hiệu quả trong các thị trường khác nhau.
- Tăng mức độ dừng lỗ để đảm bảo kiểm soát lỗ hổng duy nhất trong phạm vi khả thi.
- Các loại giao dịch có tính thanh khoản tốt, biến động trung bình như chỉ số hoặc chỉ số cổ phiếu.
Hướng tối ưu hóa chiến lược
Chiến lược này cũng có thể được tối ưu hóa bằng cách:
- Kết hợp các bộ lọc chỉ số xu hướng, ví dụ như kết hợp các phán đoán đường trung bình, tránh giao dịch ngược.
- Tăng tỷ lệ dừng và mở rộng phạm vi lợi nhuận.
- Tối ưu hóa các cơ chế dừng lỗ, ví dụ như tăng dần mức dừng lỗ theo hoạt động của giá, giảm khả năng dừng lỗ.
- Sử dụng các kết hợp hình dạng K khác tương tự như Bullish Engulfing để tạo ra danh mục giao dịch.
Tóm tắt
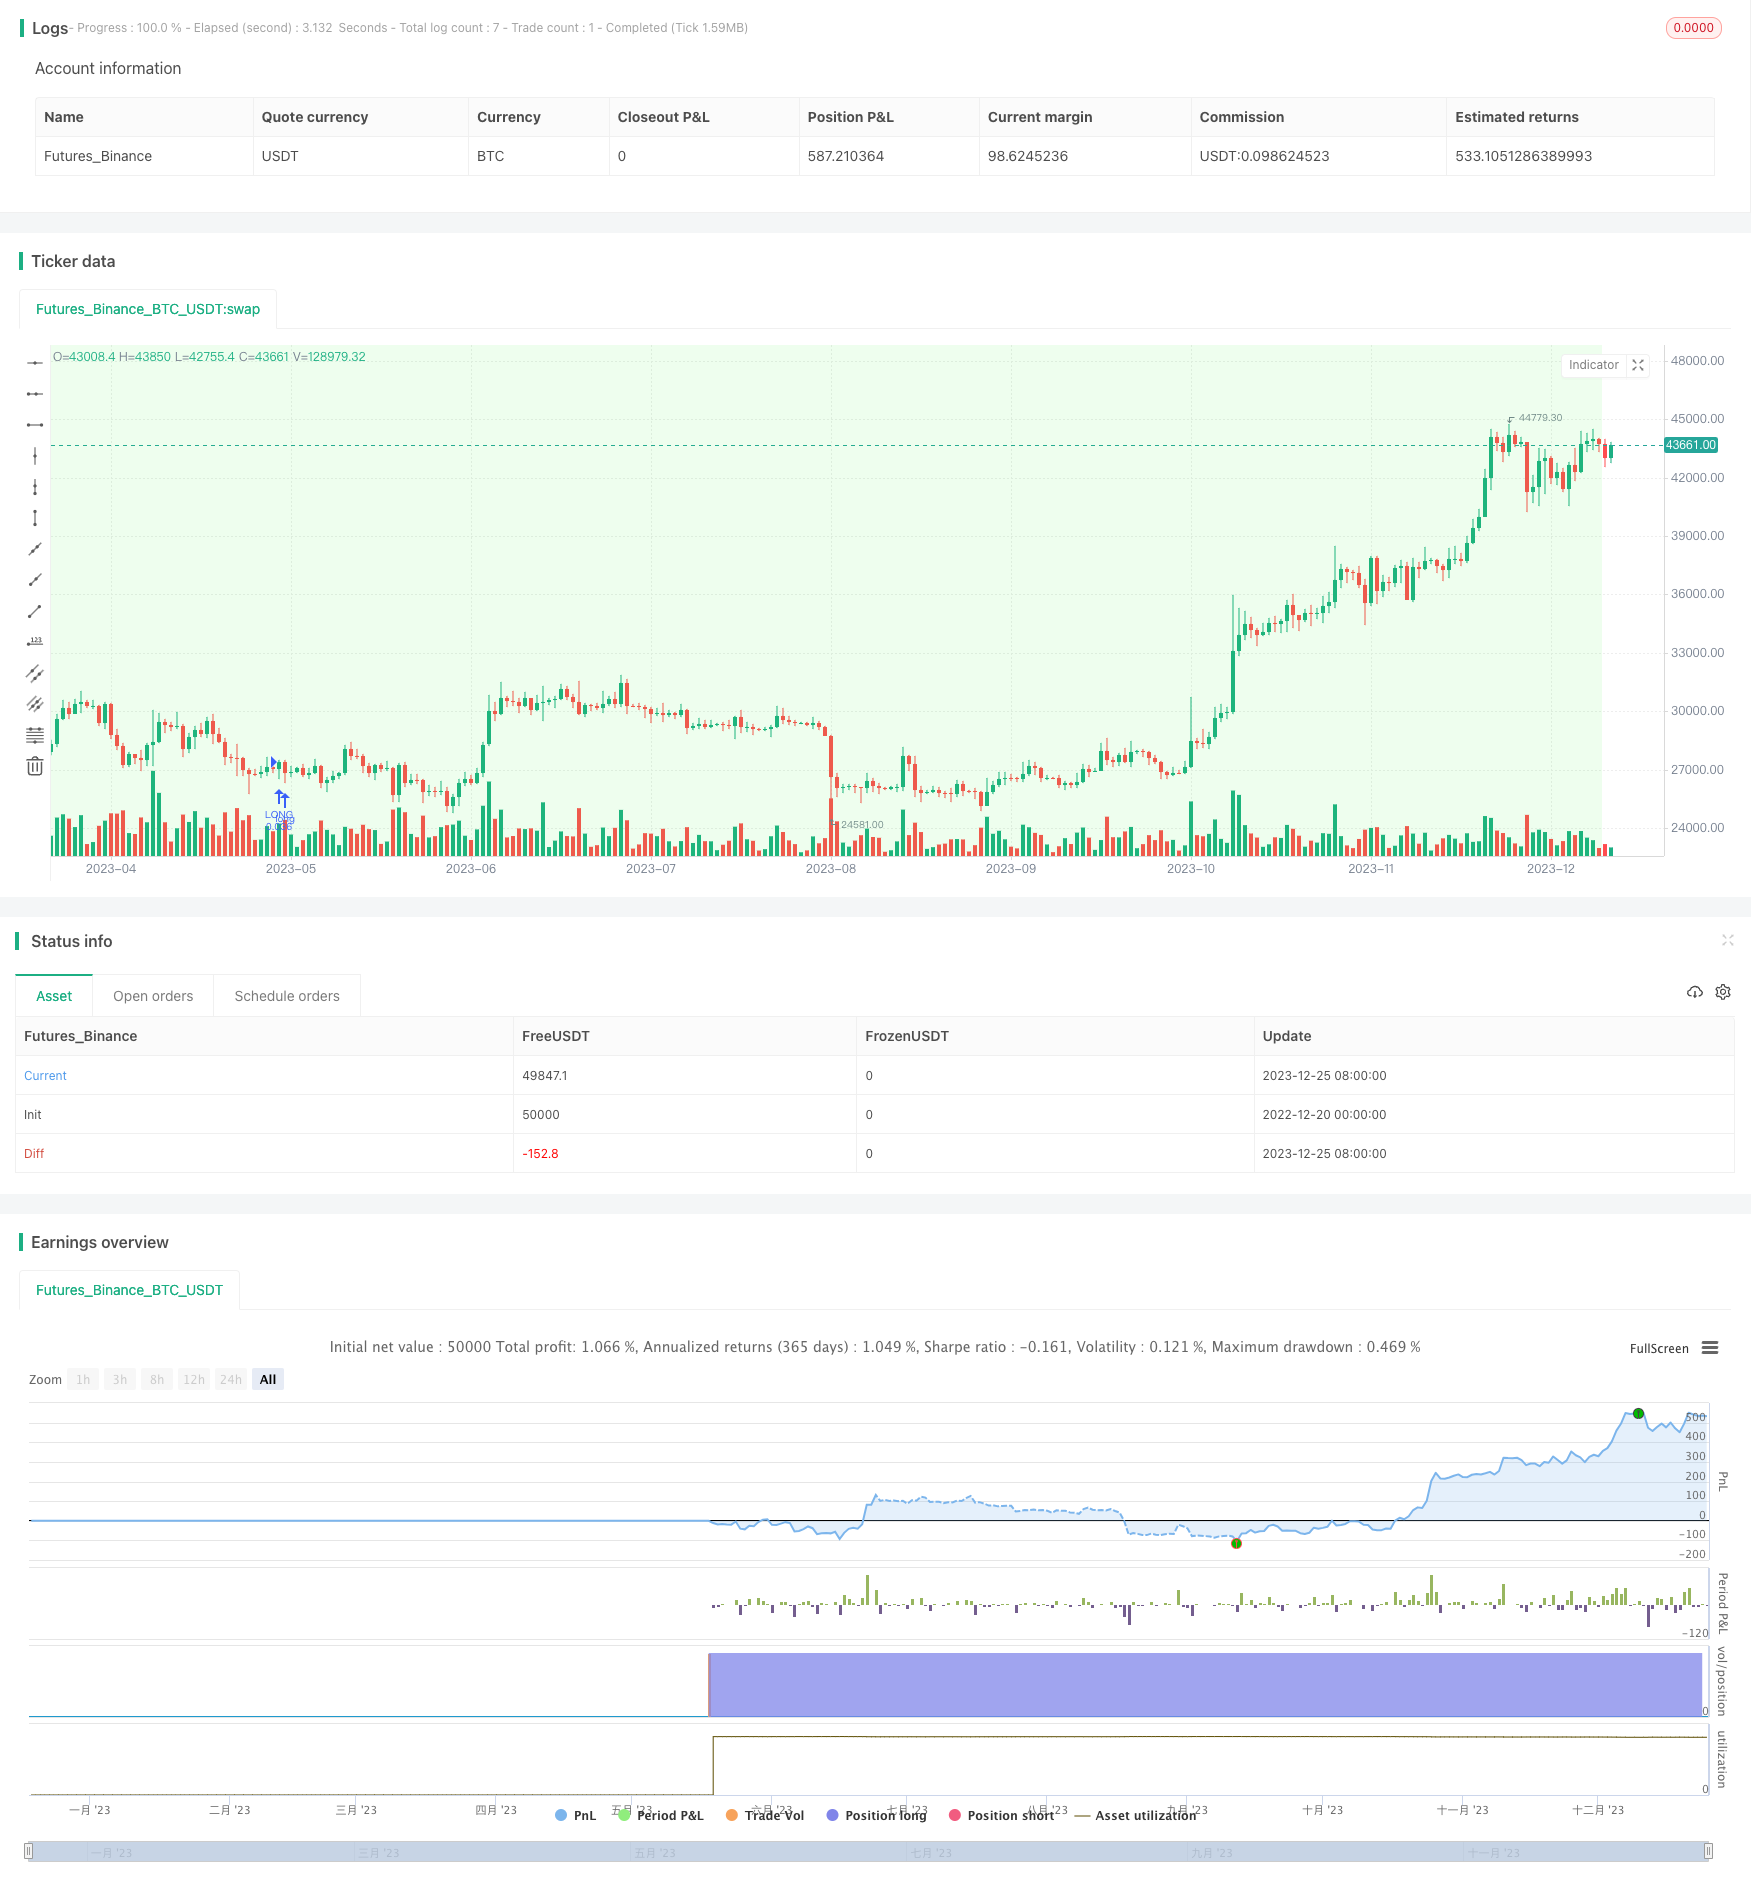
Chiến lược mua bán Bullish Engulfing là một chiến lược giao dịch định lượng dựa trên phân tích kỹ thuật, có các ưu điểm như tín hiệu giao dịch ngắn gọn, rõ ràng và dễ thực hiện. Trong trường hợp các biện pháp kiểm soát rủi ro và tối ưu hóa tham số, có thể đạt được lợi nhuận ổn định, nên được đề xuất.
/*backtest
start: 2022-12-20 00:00:00
end: 2023-12-26 00:00:00
period: 1d
basePeriod: 1h
exchanges: [{"eid":"Futures_Binance","currency":"BTC_USDT"}]
*/

// This source code is subject to the terms of the Mozilla Public License 2.0 at https://mozilla.org/MPL/2.0/
// © thequantscience

// ██████╗ ██╗   ██╗██╗     ██╗     ██╗███████╗██╗  ██╗    ███████╗███╗   ██╗ ██████╗ ██╗   ██╗██╗     ███████╗██╗███╗   ██╗ ██████╗
// ██╔══██╗██║   ██║██║     ██║     ██║██╔════╝██║  ██║    ██╔════╝████╗  ██║██╔════╝ ██║   ██║██║     ██╔════╝██║████╗  ██║██╔════╝
// ██████╔╝██║   ██║██║     ██║     ██║███████╗███████║    █████╗  ██╔██╗ ██║██║  ███╗██║   ██║██║     █████╗  ██║██╔██╗ ██║██║  ███╗
// ██╔══██╗██║   ██║██║     ██║     ██║╚════██║██╔══██║    ██╔══╝  ██║╚██╗██║██║   ██║██║   ██║██║     ██╔══╝  ██║██║╚██╗██║██║   ██║
// ██████╔╝╚██████╔╝███████╗███████╗██║███████║██║  ██║    ███████╗██║ ╚████║╚██████╔╝╚██████╔╝███████╗██║     ██║██║ ╚████║╚██████╔╝
// ╚═════╝  ╚═════╝ ╚══════╝╚══════╝╚═╝╚══════╝╚═╝  ╚═╝    ╚══════╝╚═╝  ╚═══╝ ╚═════╝  ╚═════╝ ╚══════╝╚═╝     ╚═╝╚═╝  ╚═══╝ ╚═════╝

//@version=5
strategy(
     "Buy&Sell Bullish Engulfing - The Quant Science",
     overlay = true,
     default_qty_type = strategy.percent_of_equity,
     default_qty_value = 100,
     pyramiding = 1,
     currency = currency.EUR,
     initial_capital = 10000,
     commission_type = strategy.commission.percent,
     commission_value = 0.07,
     process_orders_on_close = true,
     close_entries_rule = "ANY"
     )

startDate  = input.int(title="D: ", defval=1,    minval=1,    maxval=31,   inline = 'Start', group = "START DATE BACKTESTING", tooltip = "D is Day, M is Month, Y is Year.")
startMonth = input.int(title="M: ", defval=1,    minval=1,    maxval=12,   inline = 'Start', group = "START DATE BACKTESTING", tooltip = "D is Day, M is Month, Y is Year.")
startYear  = input.int(title="Y: ", defval=2022, minval=1800, maxval=2100, inline = 'Start', group = "START DATE BACKTESTING", tooltip = "D is Day, M is Month, Y is Year.")

endDate    = input.int(title="D: ", defval=31,   minval=1,    maxval=31,   inline = 'End',   group = "END DATE BACKTESTING", tooltip = "D is Day, M is Month, Y is Year.")
endMonth   = input.int(title="M: ", defval=12,   minval=1,    maxval=12,   inline = 'End',   group = "END DATE BACKTESTING", tooltip = "D is Day, M is Month, Y is Year.")
endYear    = input.int(title="Y: ", defval=2023, minval=1800, maxval=2100, inline = 'End',   group = "END DATE BACKTESTING", tooltip = "D is Day, M is Month, Y is Year.")

inDateRange = (time >= timestamp(syminfo.timezone, startYear, startMonth, startDate, 0, 0)) and (time < timestamp(syminfo.timezone, endYear, endMonth, endDate, 0, 0))

PROFIT   = input.float(defval = 1, minval = 0, title = "Target profit (%): ", step = 0.10, group = "TAKE PROFIT-STOP LOSS")
STOPLOSS = input.float(defval = 1, minval = 0, title = "Stop Loss (%): ",     step = 0.10, group = "TAKE PROFIT-STOP LOSS")

var float equity_trades = 0
strategy.initial_capital = 50000
equity_trades := strategy.initial_capital
var float equity   = 0
var float qty_order   = 0
t_ordersize = "Percentage size of each new order. With 'Reinvestment Profit' activate, the size will be calculate on the equity, with 'Reinvestment Profit' deactivate the size will be calculate on the initial capital."
orders_size = input.float(defval = 2, title = "Orders size (%): ", minval = 0.10, step = 0.10,  maxval = 100, group = "RISK MANAGEMENT", tooltip = t_ordersize)
qty_order := ((equity_trades * orders_size) / 100 ) / close

C_DownTrend = true
C_UpTrend   = true
var trendRule1 = "SMA50"
var trendRule2 = "SMA50, SMA200"
var trendRule = input.string(trendRule1, "Detect Trend Based On", options=[trendRule1, trendRule2, "No detection"], group = "BULLISH ENGULFING")

if trendRule == trendRule1
	priceAvg = ta.sma(close, 50)
	C_DownTrend := close < priceAvg
	C_UpTrend := close > priceAvg

if trendRule == trendRule2
	sma200 = ta.sma(close, 200)
	sma50  = ta.sma(close, 50)
	C_DownTrend := close < sma50 and sma50 < sma200
	C_UpTrend := close > sma50 and sma50 > sma200
C_Len = 14
C_ShadowPercent = 5.0
C_ShadowEqualsPercent = 100.0
C_DojiBodyPercent = 5.0
C_Factor = 2.0

C_BodyHi = math.max(close, open)
C_BodyLo = math.min(close, open)
C_Body = C_BodyHi - C_BodyLo
C_BodyAvg = ta.ema(C_Body, C_Len)
C_SmallBody = C_Body < C_BodyAvg
C_LongBody = C_Body > C_BodyAvg
C_UpShadow = high - C_BodyHi
C_DnShadow = C_BodyLo - low
C_HasUpShadow = C_UpShadow > C_ShadowPercent / 100 * C_Body
C_HasDnShadow = C_DnShadow > C_ShadowPercent / 100 * C_Body
C_WhiteBody = open < close
C_BlackBody = open > close
C_Range = high-low
C_IsInsideBar = C_BodyHi[1] > C_BodyHi and C_BodyLo[1] < C_BodyLo
C_BodyMiddle = C_Body / 2 + C_BodyLo
C_ShadowEquals = C_UpShadow == C_DnShadow or (math.abs(C_UpShadow - C_DnShadow) / C_DnShadow * 100) < C_ShadowEqualsPercent and (math.abs(C_DnShadow - C_UpShadow) / C_UpShadow * 100) < C_ShadowEqualsPercent
C_IsDojiBody = C_Range > 0 and C_Body <= C_Range * C_DojiBodyPercent / 100
C_Doji = C_IsDojiBody and C_ShadowEquals

patternLabelPosLow  = low  - (ta.atr(30) * 0.6)
patternLabelPosHigh = high + (ta.atr(30) * 0.6)

label_color_bullish = input.color(color.rgb(43, 255, 0), title = "Label Color Bullish", group = "BULLISH ENGULFING")
C_EngulfingBullishNumberOfCandles = 2
C_EngulfingBullish = C_DownTrend and C_WhiteBody and C_LongBody and C_BlackBody[1] and C_SmallBody[1] and close >= open[1] and open <= close[1] and ( close > open[1] or open < close[1] )
if C_EngulfingBullish
    var ttBullishEngulfing = "Engulfing\nAt the end of a given downward trend, there will most likely be a reversal pattern. To distinguish the first day, this candlestick pattern uses a small body, followed by a day where the candle body fully overtakes the body from the day before, and closes in the trend’s opposite direction. Although similar to the outside reversal chart pattern, it is not essential for this pattern to completely overtake the range (high to low), rather only the open and the close."
    label.new(bar_index, patternLabelPosLow, text="BE", style=label.style_label_up, color = label_color_bullish, textcolor=color.white, tooltip = ttBullishEngulfing)
bgcolor(ta.highest(C_EngulfingBullish?1:0, C_EngulfingBullishNumberOfCandles)!=0 ? color.new(#21f321, 90) : na, offset=-(C_EngulfingBullishNumberOfCandles-1))

var float c       = 0
var float o       = 0
var float c_exit  = 0
var float c_stopl = 0

if C_EngulfingBullish and strategy.opentrades==0 and inDateRange
    c := strategy.equity
    o := close
    c_exit  := c + (c * PROFIT / 100)
    c_stopl := c - (c * STOPLOSS / 100)
    strategy.entry(id = "LONG", direction = strategy.long, qty = qty_order, limit = o)

if ta.crossover(strategy.equity, c_exit)
    strategy.exit(id = "CLOSE-LONG", from_entry = "LONG", limit = close)
if ta.crossunder(strategy.equity, c_stopl)
    strategy.exit(id = "CLOSE-LONG", from_entry = "LONG", limit = close)