Chiến lược định lượng Bollinger Band Golden Cross và Dead Cross trên các cặp giao dịch
Tổng quan
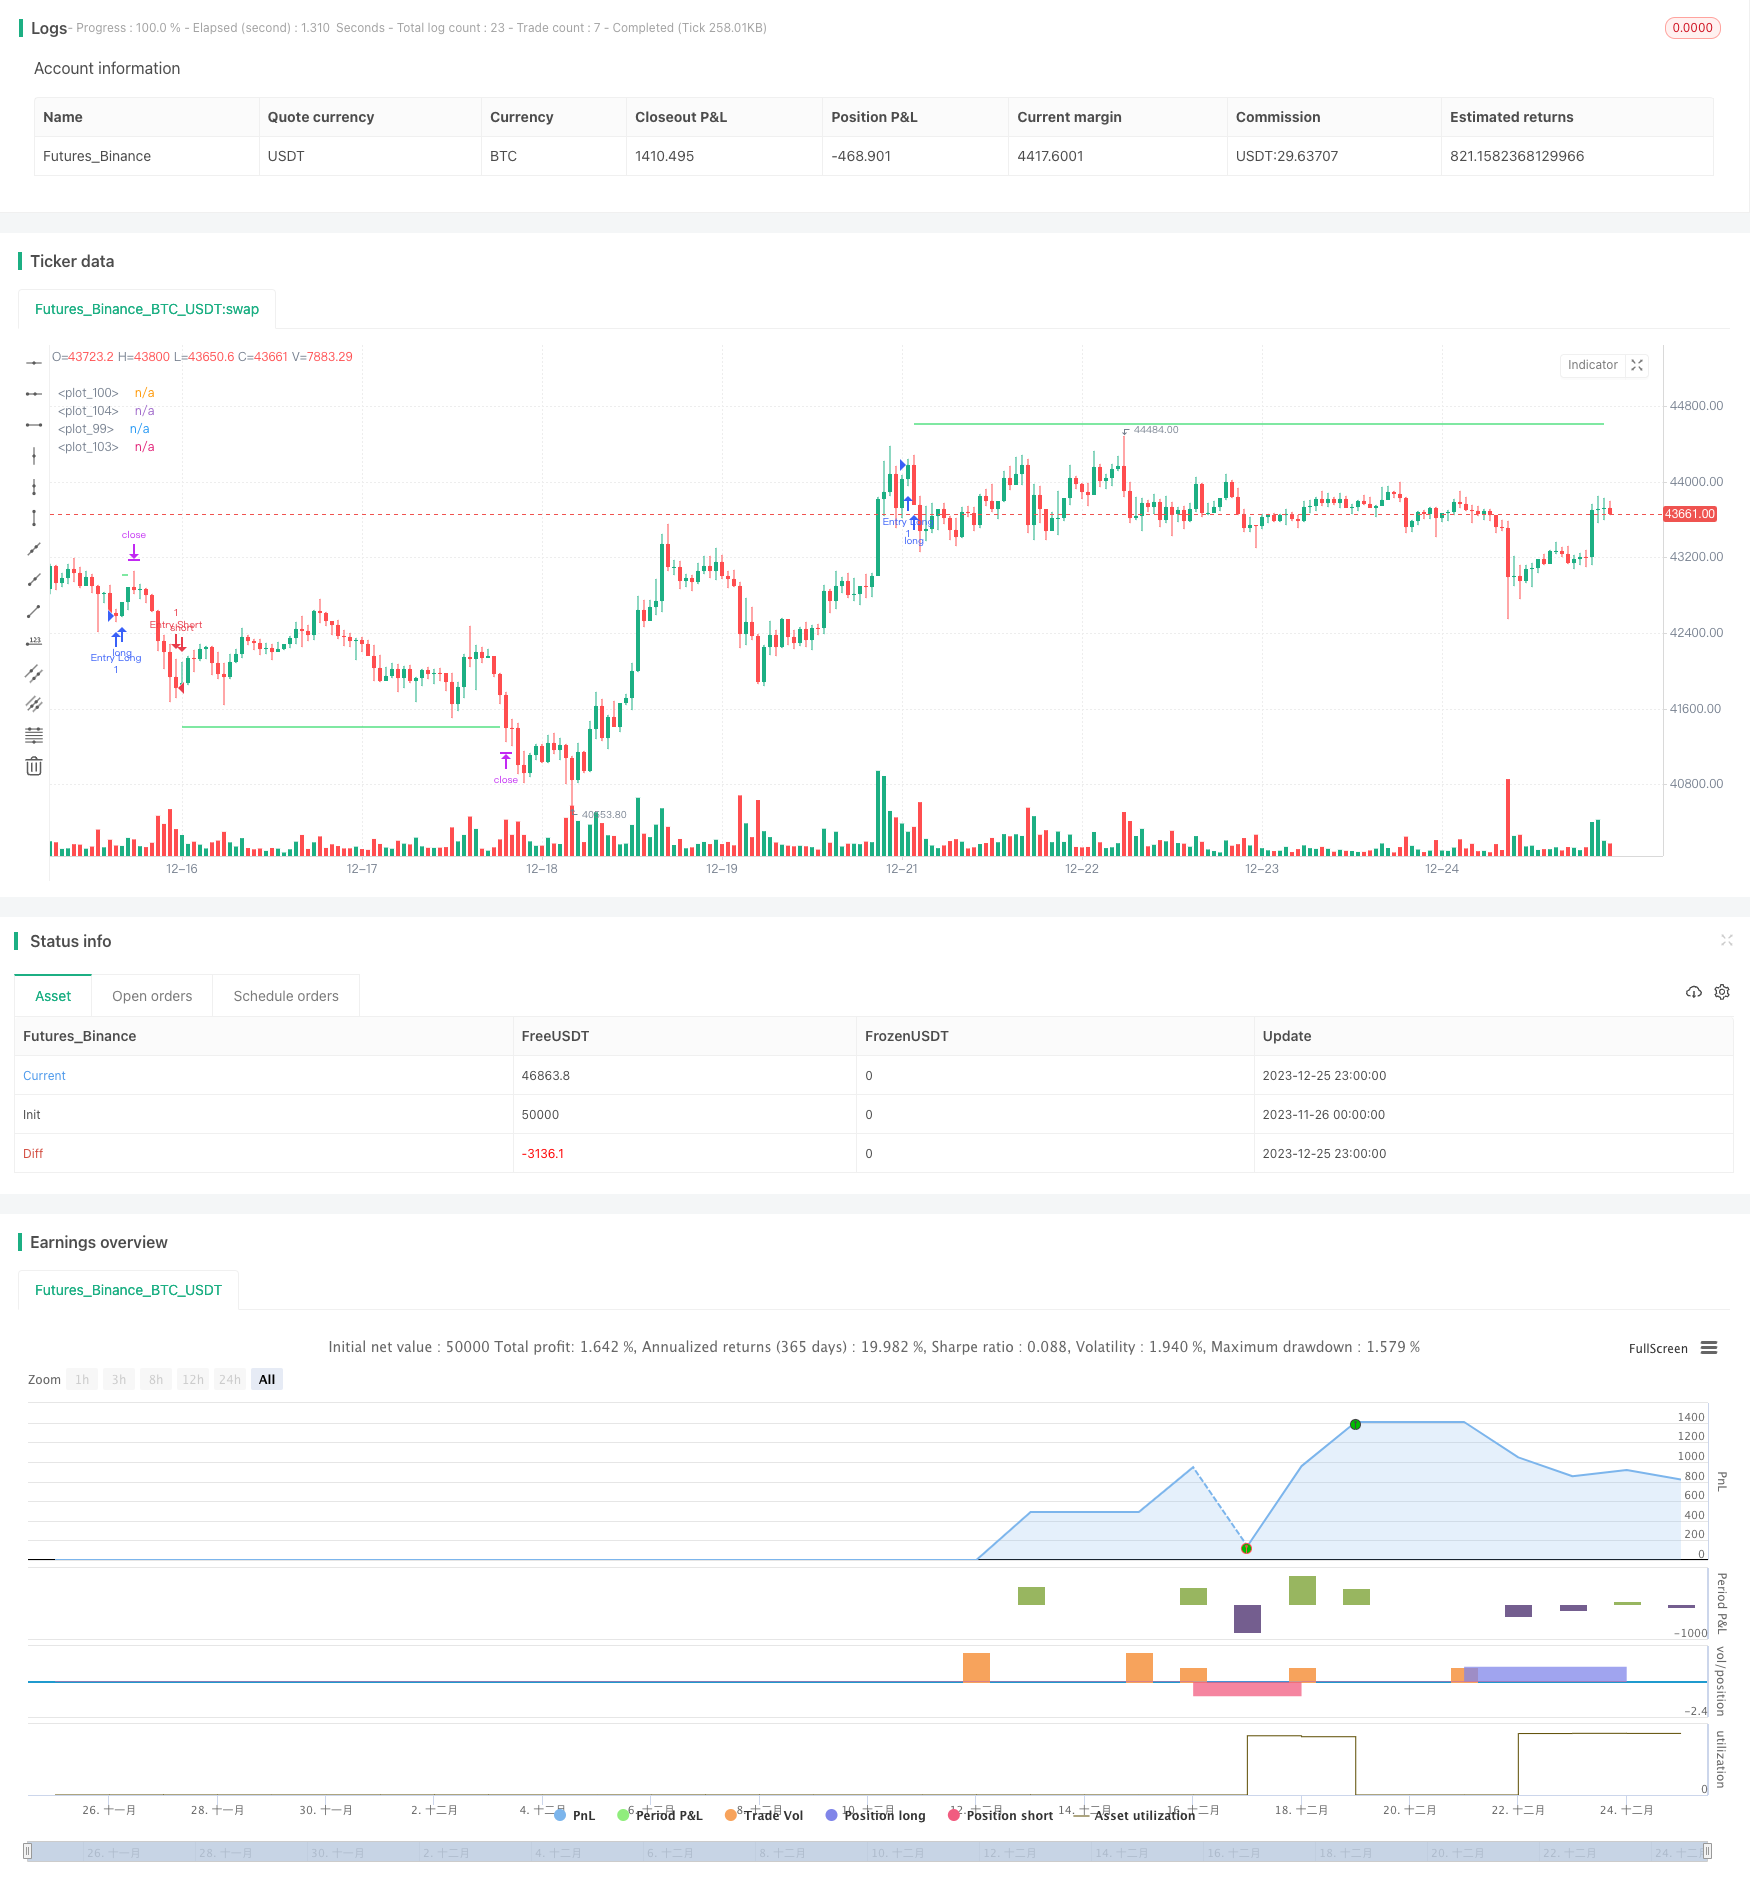
Chiến lược này tạo ra tín hiệu mua và bán bằng cách so sánh đường nhanh và đường chậm của chỉ số MACD. Khi tạo ra tín hiệu mua, sẽ mua theo tỷ lệ chiếm quyền lợi tài khoản. Sau đó, sẽ thêm vị trí tại một điểm rút lại cụ thể.
Nguyên tắc chiến lược
Lập luận cốt lõi của chiến lược này là so sánh các đường giao thoa của đường MACD với đường nhanh và đường chậm để đánh giá xu hướng. MACD là chênh lệch của đường trung bình di chuyển để đánh giá xu hướng và năng lượng của thị trường bằng cách tính toán chênh lệch giữa đường trung bình ngắn hạn và dài hạn.
Khi đường nhanh vượt qua đường chậm, tạo ra một cái gai vàng, cho thấy thị trường đang trong xu hướng giảm giá, khi đó chiến lược sẽ mở nhiều vị trí; khi đường nhanh vượt qua đường chậm, tạo ra một cái gai chết, cho thấy xu hướng giảm giá, khi đó chiến lược sẽ mở vị trí trống.
Sau khi mở vị trí, chiến lược sẽ thêm hoặc giảm vị trí tại một điểm rút ra cụ thể. Điều này có thể làm tăng không gian lợi nhuận thông qua nguyên tắc Martingale. Khi lợi nhuận tích lũy của vị trí đạt đến điểm dừng cấu hình, chiến lược sẽ bán hoặc mua tất cả các vị trí bằng phẳng.
Phân tích lợi thế
Chiến lược này có những ưu điểm sau:
Sử dụng chỉ số MACD để đánh giá xu hướng thị trường, đây là một chỉ số phân tích kỹ thuật cổ điển và đáng tin cậy.
Các nhà đầu tư có thể kiểm soát rủi ro giao dịch đơn lẻ bằng cách mở kho hàng loạt.
Việc mở thêm các vị trí có thể mở rộng không gian lợi nhuận thông qua nguyên tắc Martingale.
Thiết lập điểm dừng để hạn chế tổn thất.
Phân tích rủi ro
Chiến lược này cũng có một số rủi ro:
Chỉ số MACD không hoàn toàn dự đoán được xu hướng thị trường, có thể có tín hiệu sai.
Toàn bộ các vị trí bổ sung có nguy cơ rút lại và mở rộng. Bạn có thể điều chỉnh tỷ lệ phần trăm mỗi lần bổ sung.
Thiết lập điểm dừng quá nhỏ có thể gây ra hạn chế về không gian kiếm được. Nó có thể được điều chỉnh theo các giống khác nhau.
Cần phân bổ hợp lý tỷ lệ vốn mở kho để tránh giao dịch trên mỗi loại vượt quá giới hạn tài khoản.
Hướng tối ưu hóa
Chính sách này có thể được tối ưu hóa theo các khía cạnh sau:
Kiểm tra các chỉ số MACD với các tham số khác nhau để tìm các tham số chỉ số phù hợp hơn với các loại giao dịch cụ thể.
Tối ưu hóa tỷ lệ phần trăm tiền mỗi lần mở thêm và tham số mức thu hồi để tìm ra sự kết hợp tham số tối ưu.
Kiểm tra các tham số điểm dừng hoạt động của đường dài và đường ngắn để xác định mức dừng tối ưu.
Đánh giá khả năng đặt cược của tài khoản và đặt giới hạn vị trí tối đa hợp lý cho một loại.
Tăng logic dừng lỗ. Khi thị trường thay đổi mạnh, dừng lỗ có thể kiểm soát hiệu quả lỗ.
Tóm tắt
Chiến lược này nói chung là một chiến lược theo dõi xu hướng điển hình. Nó sử dụng chỉ số MACD để xác định xu hướng của thị trường, theo dõi xu hướng bằng cách gia tăng cổ phiếu theo đợt và dừng lại khi lợi nhuận đạt đến một mức nhất định.
/*backtest
start: 2023-11-26 00:00:00
end: 2023-12-26 00:00:00
period: 1h
basePeriod: 15m
exchanges: [{"eid":"Futures_Binance","currency":"BTC_USDT"}]
*/

// This source code is subject to the terms of the Mozilla Public License 2.0 at https://mozilla.org/MPL/2.0/
// © TradingSoft_tech

//@version=5
strategy("MAPM-V1", overlay=true, default_qty_value=10, max_bars_back=5000,default_qty_type = strategy.percent_of_equity, commission_value=0.1, initial_capital = 100, pyramiding=6, currency=currency.USD)

///////// Options
SignalFast = input.int(300, step=10)
SignalSlow = input.int(600, step=10)
StepAddPurchases = input.float(2.5, step=0.1)
VolumePurchases = input.int(6,step=1)
Buy = input(true)
Sell = input(true)
longProfitPerc = input.float(title="Long Take Profit (%)", minval=0.0, step=0.1, defval=1) * 0.01
shortProfitPerc = input.float(title="Short Take Profit (%)", minval=0.0, step=0.1, defval=1) * 0.01
Martingale = input.float(1.6, minval = 1, step = 0.1)
VolumeDepo = input.int(100, step=1)
PercentOfDepo = input.float(10, step=1)
Close = (close)
EnterVolume = VolumeDepo*PercentOfDepo*0.01/Close

///////// Calculation indicator
fastAverage = ta.ema(close, 8)
slowAverage = ta.ema(close, 49)
macd = fastAverage - slowAverage
macdSignalF = ta.ema(macd,SignalFast)
macdSignalS = ta.ema(macd,SignalSlow)

// Test Start
startYear = input(2005, "Test Start Year")
startMonth = input(1, "Test Start Month")
startDay = input(1, "Test Start Day")
startTest = timestamp(startYear,startMonth,startDay,0,0)

//Test End
endYear = input(2050, "Test End Year")
endMonth = input(12, "Test End Month")
endDay = input(30, "Test End Day")
endTest = timestamp(endYear,endMonth,endDay,23,59)

timeRange = time > startTest and time < endTest ? true : false

///////// Plot Data
//plot(macd, style = plot.style_histogram)
//plot(macdSignalF*10000, style = plot.style_line, color=color.red)
//plot(macdSignalS*10000, style = plot.style_line, color=color.blue)
//plot(fastAverage, style = plot.style_line, color=color.red)
//plot(slowAverage, style = plot.style_line, color=color.blue)

///////// Calculation of the updated value
var x = 0.0
if strategy.opentrades>strategy.opentrades[1]
    x := x + 1
else if strategy.opentrades==0
    x := 0
y = x+1

///////// Calculation of reference price data
entryPrice = strategy.opentrades==0? 0 : strategy.opentrades.entry_price(0)
limitLong = strategy.position_avg_price * (1 + longProfitPerc)
limitShort = strategy.position_avg_price * (1 - shortProfitPerc)
SteplimitLong = entryPrice[0]*(1-StepAddPurchases*y/100)
SteplimitShort = entryPrice[0]*(1+StepAddPurchases*y/100)

///////// Conditions for a long
bool EntryLong = ta.crossover(macdSignalF, macdSignalS) and Buy and strategy.opentrades==0 and strategy.position_size==0
bool PurchasesLong = Buy and strategy.opentrades==x and strategy.position_size>0 and x<=VolumePurchases
bool CancelPurchasesLong = strategy.position_size==0 and strategy.opentrades==0
bool TPLong = strategy.position_size>0 and strategy.opentrades!=0
///////// Entry Long + add.purchases + cancel purchases + Take profit Long
switch
    EntryLong => strategy.entry("Entry Long", strategy.long, qty = EnterVolume)
    PurchasesLong => strategy.entry("PurchasesLong", strategy.long, qty = EnterVolume*math.pow(Martingale,y), limit = SteplimitLong)
    CancelPurchasesLong => strategy.cancel("PurchasesLong")
switch
    TPLong => strategy.exit("TPLong", qty_percent = 100, limit = limitLong)

///////// Conditions for a Short
bool EntryShort = ta.crossunder(macdSignalF, macdSignalS) and Sell and strategy.opentrades==0 and strategy.position_size==0
bool PurchasesShort = Sell and strategy.opentrades==x and strategy.position_size<0 and x<=VolumePurchases
bool CancelPurchasesShort = strategy.position_size==0 and strategy.opentrades==0
bool TPShort = strategy.position_size<0 and strategy.opentrades!=0

///////// Entry Short + add.purchases + cancel purchases + Take profit Short
switch
    EntryShort => strategy.entry("Entry Short", strategy.short, qty = EnterVolume)
    PurchasesShort => strategy.entry("PurchasesShort", strategy.short, qty = EnterVolume*math.pow(Martingale,y), limit = SteplimitShort)
    CancelPurchasesShort => strategy.cancel("PurchasesShort")
switch
    TPShort => strategy.exit("TPShort", qty_percent = 100, limit = limitShort)

/////////Calculation of conditions and reference data for level drawing
InTradeLong = strategy.position_size<0
InTradeShort = strategy.position_size>0
PickInLong = strategy.opentrades.entry_price(0)*(1-StepAddPurchases*y/100)
PickInShort = strategy.opentrades.entry_price(0)*(1+StepAddPurchases*y/100)

/////////Displaying the level of Take Profit
plot(InTradeLong ? na : limitLong, color=color.new(#00d146, 0), style=plot.style_linebr, linewidth=1)
plot(InTradeShort ? na : limitShort, color=color.new(#00d146, 0), style=plot.style_linebr, linewidth=1)

/////////Displaying the level of add.purchases
plot(InTradeLong ? na : PickInLong, color=color.white, style=plot.style_linebr, linewidth=1)
plot(InTradeShort ? na : PickInShort, color=color.white, style=plot.style_linebr, linewidth=1)