Chiến lược xu hướng định lượng JBravo
Tổng quan về chiến lược
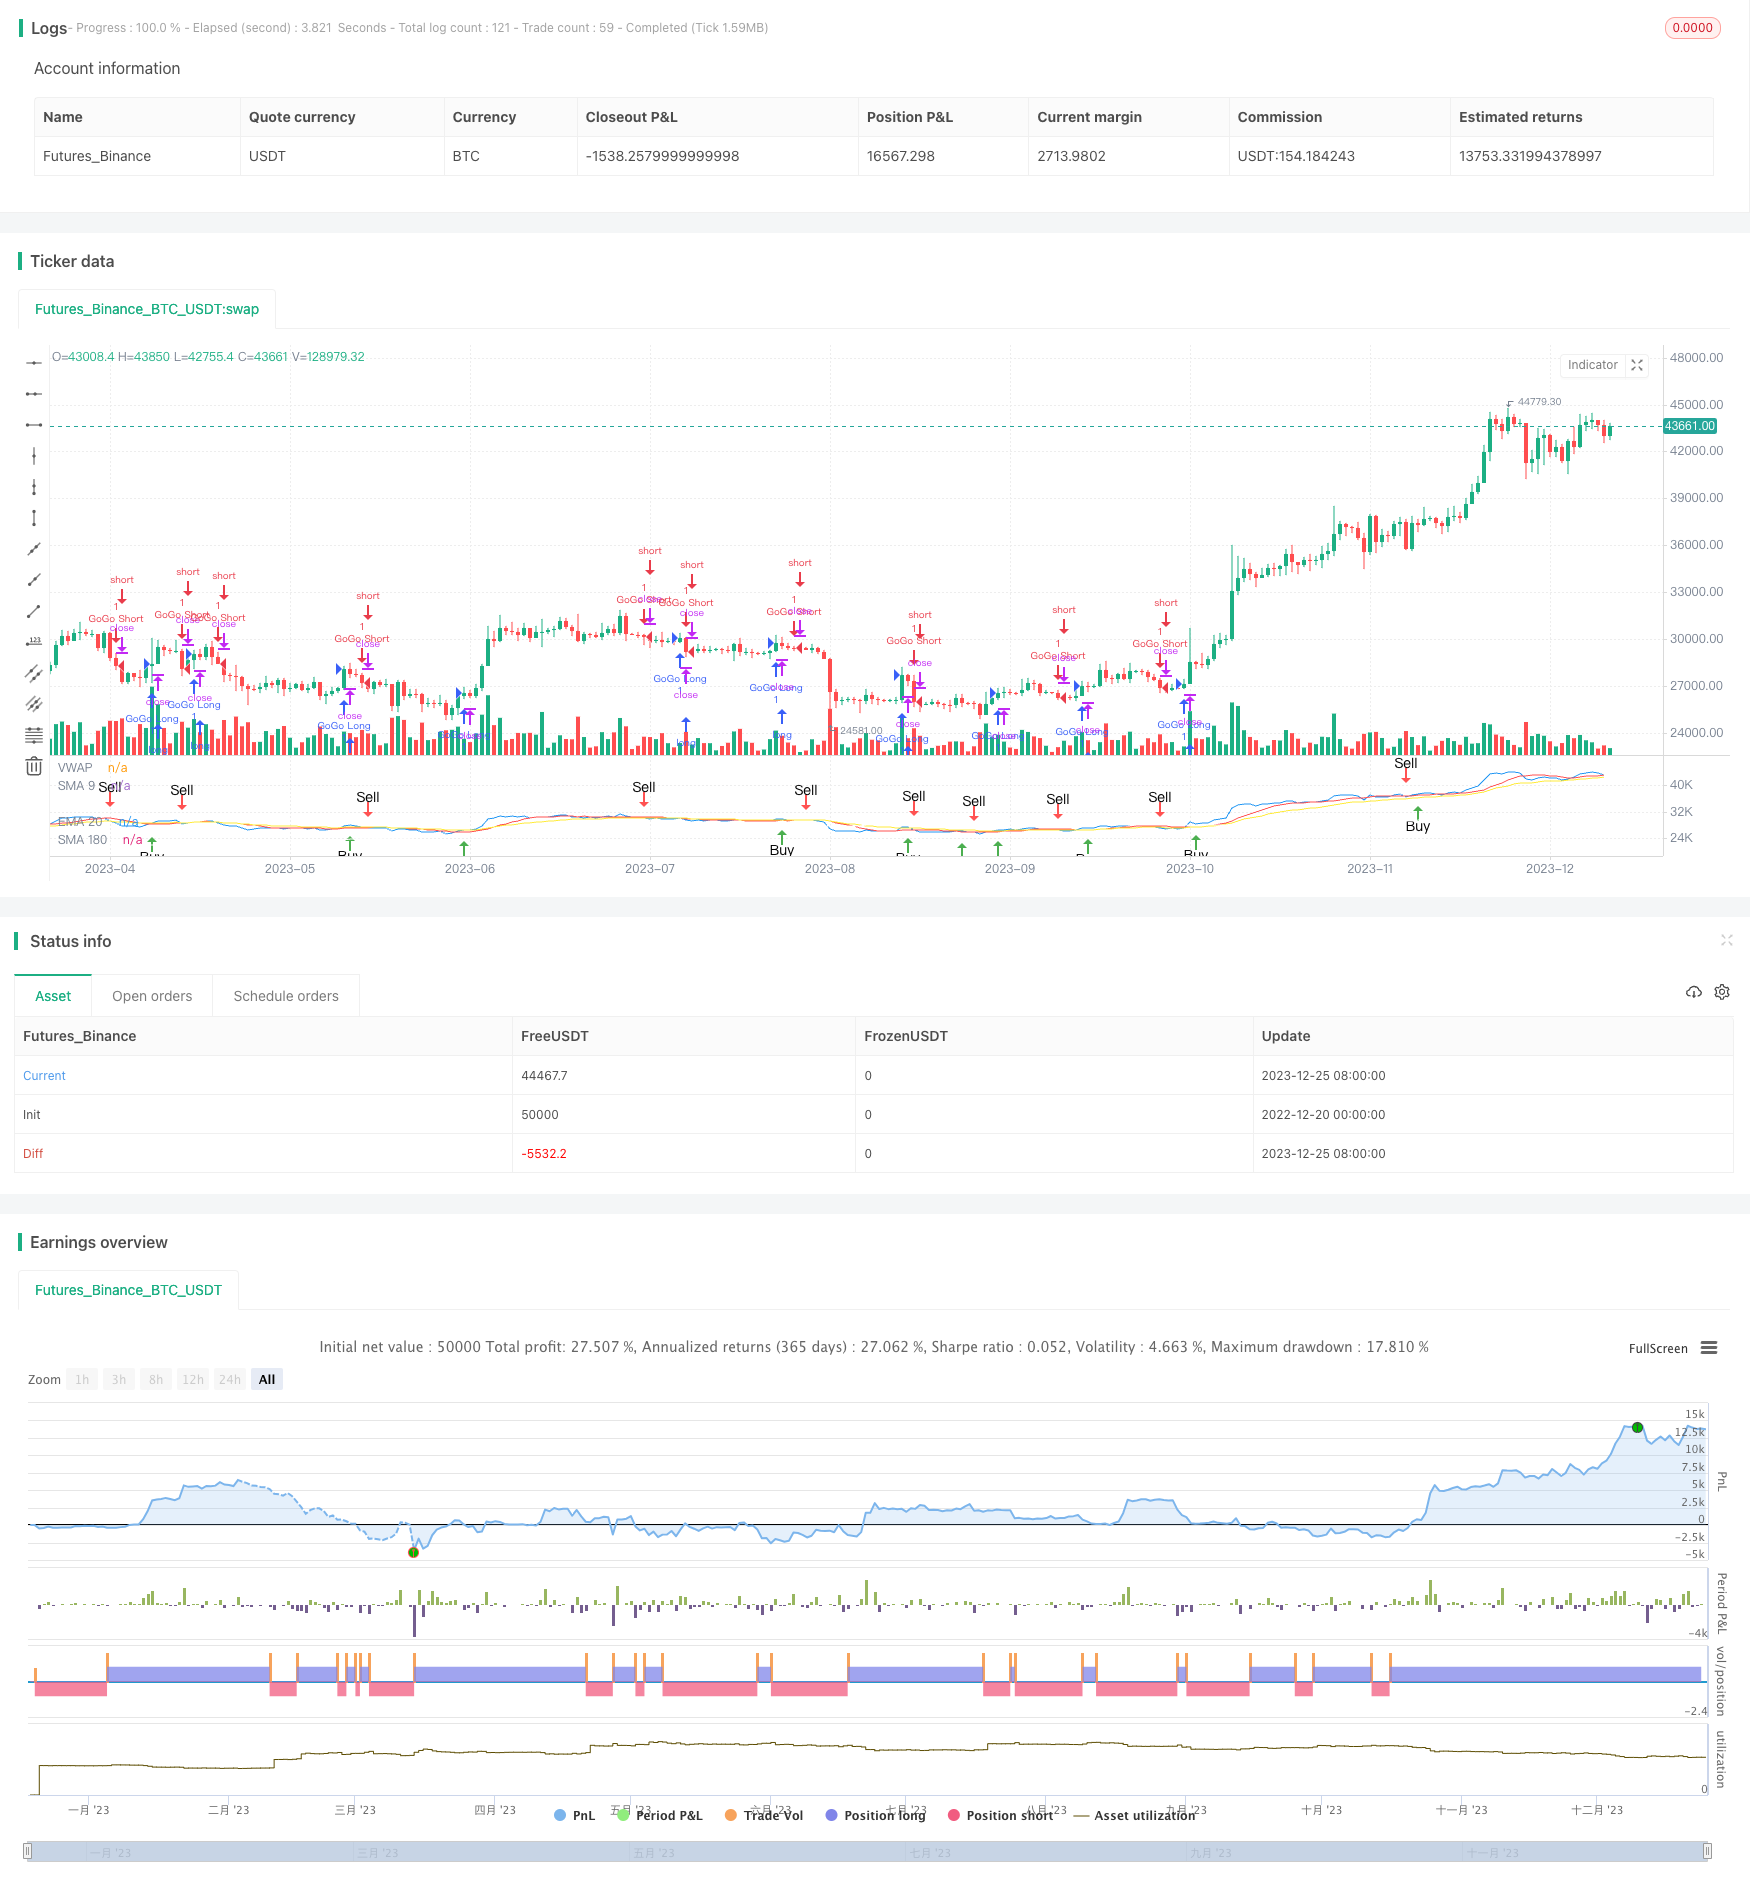
Chiến lược xu hướng định lượng JBravo là một chiến lược theo dõi xu hướng dựa trên đường trung bình di chuyển. Nó sử dụng đường trung bình di chuyển đơn giản 9 ngày, đường trung bình di chuyển chỉ số 20 ngày và đường trung bình di chuyển đơn giản 180 ngày để đánh giá xu hướng của thị trường và các tín hiệu mua và bán cuối cùng.
Tên của chiến lược này được lấy cảm hứng từ nhân vật hoạt hình Johnny Bravo, đại diện cho một quyết định giao dịch tự tin và quyết đoán. Từ ngữ “GoGo Juice” mô tả sự gia nhập mạnh mẽ khi đường VWAP đi qua đường trung bình di chuyển chỉ số 20 ngày.
Nguyên tắc chiến lược
Một tín hiệu mua được tạo ra khi một đường K đi qua đường trung bình di chuyển đơn giản 9 ngày trên giá đóng cửa; và một tín hiệu bán được tạo ra khi giá đóng cửa đi qua đường trung bình di chuyển chỉ số 20 ngày.
Một tín hiệu mua mạnh mẽ sẽ được tạo ra nếu các đường trung bình di chuyển 9, 20 và 180 ngày đều đi lên và đường trung bình di chuyển 9 ngày cao hơn đường trung bình di chuyển 20 ngày cao hơn đường trung bình di chuyển 180 ngày.
Nếu các đường trung bình di chuyển 9, 20 và 180 ngày đều đi xuống, và đường trung bình di chuyển 9 ngày thấp hơn đường trung bình di chuyển 20 ngày, đường trung bình di chuyển 20 ngày thấp hơn đường trung bình di chuyển 180 ngày, sẽ tạo ra một tín hiệu bán mạnh.
Khi đường trung bình trọng lượng giao dịch đi qua đường trung bình chuyển động 20 ngày từ phía dưới, tạo ra tín hiệu Go Go; khi đường trung bình trọng lượng giao dịch đi qua đường trung bình chuyển động 20 ngày từ phía trên, tạo ra tín hiệu Go Go.
Phân tích lợi thế chiến lược
Chiến lược này kết hợp theo dõi xu hướng và chiến lược phá vỡ. Đường trung bình di chuyển có thể xác định rõ hướng xu hướng thị trường, giảm khả năng giao dịch sai. Đồng thời, nó sử dụng giá trung bình trọng lượng giao dịch linh hoạt để xác định thời điểm vào thị trường, đồng thời kiểm soát rủi ro trong khi hy vọng thị trường phá vỡ.
So với việc sử dụng trung bình di chuyển một mình, chiến lược này bổ sung một cơ chế tham gia mạnh của GoGo, có thể mang lại một tỷ lệ phần thưởng thị trường cao hơn trong một tình huống mạnh mẽ.
Nhìn chung, chiến lược này thu hồi ít và có khả năng lợi nhuận ổn định.
Phân tích rủi ro chiến lược
Mặc dù chiến lược này bổ sung một cơ chế đầu vào mạnh mẽ, điểm dừng có thể được kích hoạt thường xuyên trong các tình huống xung đột. Ngoài ra, đường trung bình di chuyển tự nó có tính chậm trễ và không thể bắt kịp sự thay đổi giá.
Điều này có nghĩa là chiến lược có thể tạo ra một số lượng giao dịch ảo không thể phản ánh thực tế giá cả thị trường. Ngoài ra, việc tham gia mạnh mẽ cũng làm tăng nguy cơ thua lỗ.
Để giảm rủi ro, bạn có thể điều chỉnh chu kỳ của moving average; hoặc thêm mô-đun dừng lỗ, dừng lỗ và rút ra sau khi lỗ đạt đến một mức độ nhất định.
Hướng tối ưu hóa chiến lược
Chiến lược này có thể được tối ưu hóa theo các hướng sau:
Điều chỉnh các tham số trung bình di chuyển, tối ưu hóa các tham số chu kỳ, tìm các tham số kết hợp tốt nhất
Tăng số lượng giao dịch để tránh các tín hiệu sai lầm trong biến động giá
Thêm mô-đun dừng lỗ, thiết lập quy tắc ra sân, kiểm soát lỗ đơn
Kết hợp với việc lựa chọn phân khúc thị trường nóng để chiến lược được nhắm mục tiêu hơn
Tối ưu hóa tỷ lệ mở kho, các tham số khác nhau để tối ưu hóa các vị trí khác nhau
Tóm tắt
Chiến lược xu hướng định lượng JBravo tích hợp phân tích trung bình di chuyển và phán đoán xu hướng của giá trung bình trọng lượng giao dịch. Nó theo đuổi lợi nhuận dài ổn định, đồng thời có cơ chế giao dịch tích cực. Chiến lược này phù hợp với việc nắm giữ đường dài trung bình, rủi ro trung bình và có tỷ lệ lợi nhuận cao. Nó có thể trở thành một phần của chiến lược giao dịch kết hợp, có khả năng thích ứng tốt với thị trường.
||
Strategy Overview
The JBravo Quantitative Trend Strategy is a trend-following strategy based on moving averages. It uses the 9-day simple moving average, 20-day exponential moving average, and 180-day simple moving average to determine the market trend direction, as well as the final buy and sell signals.
The strategy name is inspired by the cartoon character Johnny Bravo, representing a confident and decisive trading decision. The term “GoGo Juice” depicts the aggressive entry when the VWAP line crosses the 20-day exponential moving average.
Strategy Principle
A buy signal is generated when the closing price crosses above the 9-day simple moving average; A sell signal is generated when the closing price crosses below the 20-day exponential moving average.
If the 9-day, 20-day and 180-day moving averages are all moving up, and the 9-day moving average is above the 20-day moving average, the 20-day moving average is above the 180-day moving average, a strong buy signal is generated.
If the 9-day, 20-day and 180-day moving averages are all moving down, and the 9-day moving average is below the 20-day moving average, the 20-day moving average is below the 180-day moving average, a strong sell signal is generated.
When the Volume Weighted Average Price line crosses the 20-day exponential moving average upward, a “GoGo Long” signal is generated; When the Volume Weighted Average Price line crosses the 20-day exponential moving average downward, a “GoGo Short” signal is generated.
Advantage Analysis
This strategy combines the ideas of trend following and breakout strategies. Moving averages can clearly determine the direction of the market trend and reduce the probability of wrong trades. At the same time, it flexibly uses the VWAP indicator to determine the entry time, controlling risks while favoring breakthroughs in the market.
Compared to using moving averages alone, this strategy adds the aggressive entry mechanism of “GoGo Juice”, which can obtain higher returns in strong trends.
Overall, this strategy has small drawdowns and stable profitability.
Risk Analysis
Although the strategy increases the strength of entries, stop loss points can be frequently triggered in sideways markets. In addition, moving averages themselves have high inertia and cannot keep up with price changes in time.
This means that the strategy may generate a certain number of virtual trades that do not actually reflect market price movements. In addition, aggressive entries also increase the risk of losses.
To reduce risks, we can adjust the cycle of moving averages as appropriate; or add a stop loss module to stop loss when losses reach a certain level.
Optimization Directions
The strategy can be optimized in the following directions:
Adjust moving average parameters and optimize cycle parameters to find the optimal parameter combination
Add volume indicators to avoid false signals in times of violent price fluctuations
Increase stop loss modules and set exit rules to control per trade loss
Combine selections of market hot sectors to make strategies more targeted
Optimize opening position proportions, optimize different scale for different parameters
Conclusion
The JBravo Quantitative Trend Strategy integrates moving average analysis and VWAP trend judgment. It pursues stable long-term profits while having a certain degree of aggressive trading mechanisms. The strategy is suitable for medium-long term holdings, with medium-high risks and high returns. It can become a part of portfolio trading strategies with very good market adaptability.
[/trans]
/*backtest
start: 2022-12-20 00:00:00
end: 2023-12-26 00:00:00
period: 1d
basePeriod: 1h
exchanges: [{"eid":"Futures_Binance","currency":"BTC_USDT"}]
*/

// This source code is subject to the terms of the Mozilla Public License 2.0 at https://mozilla.org/MPL/2.0/
// © bradvaughn

//@version=4
strategy("JBravo Swing", overlay = false)

var buy_in_progress = false


//Moving Averages
smaInput1 = input(title="Display SMA 9", type=input.bool, defval=true)
smaInput2 = input(title="Display EMA 20", type=input.bool, defval=true)
smaInput4 = input(title="Display SMA 180", type=input.bool, defval=true)
colored_180 = input(false, title="Color-code 180 trend direction")
vwapInput = input(title="Display VWAP", type=input.bool, defval=true)

sma9 = sma(close, 9)
ema20 = ema(close, 20)
sma180 = sma(close, 180)

//Plot Moving Averages
plot(smaInput1 ? sma9 : na, color= color.red, title="SMA 9")
plot(smaInput2 ? ema20 : na, color = color.yellow, title="EMA 20")

// Plot VWAP
vwap1 = vwap(hlc3)
plot(vwapInput ? vwap1 : na, color = color.blue, title="VWAP")
vwaplong = vwap1 > ema20
vwapshort = vwap1 < ema20

//Color SMA 180 trend direction if selected
sma180_uptrend = sma(close, 180) > sma(close[2], 180)
colr = sma180_uptrend == true or colored_180 == false ? color.white : colored_180 == true ? color.gray : na
plot(smaInput4 ? sma180 : na, color = colr, title="SMA 180")

//Get value of lower end of candle
buyLow = iff(lowest(open, 1) < lowest(close, 1), lowest(open, 1), lowest(close, 1))
sellLow = lowest(close, 1)

// Find the lower MA for crossover sell condition
sellma = iff((sma9<ema20), sma9, ema20)


//SMA 9 trend direction
sma9_uptrend = sma(close, 9) > sma(close[2], 9)
//EMA 20 trend direction
ema20_uptrend = ema(close, 20) > sma(close[2], 20)

//Buy or sell if conditions are met
// Buy when the candle low is above the SMA9
// Sell when the candle low is below the lower of SMA9 and EMA20
Buy = iff(buy_in_progress == false and buyLow > sma9 == true, true, false)
Sell = iff(buy_in_progress == true and sellLow < sellma == true, true, false)

// Determine stong buy and strong sell conditions.
// If moving averages are all up, then this will qualify a buy as a strong buy.
// If the moving averages are not up (ie. down) then this will qualify a sell as a strong sell
StrongBuy = iff (Buy and sma9_uptrend and sma180_uptrend and ema20_uptrend and (sma9 > ema20) and (ema20 > sma180), true, false)
StrongSell = iff (Sell and not sma9_uptrend and not sma180_uptrend and not ema20_uptrend and (sma9 < ema20) and (ema20 < sma180), true, false)

//Update Trading status if bought or sold
if Buy
    buy_in_progress := true
if Sell
    buy_in_progress := false

// Clear Buy and Sell conditions if StrongBuy or StrongSell conditions exist.
// This disables plotting Buy and Sell conditions
if StrongBuy
    Buy := false
if StrongSell
    Sell := false


//Display BUY/SELL indicators

plotshape(Buy,title="Buy", color=color.green, style=shape.arrowup,location=location.belowbar, text="Buy")
plotshape(StrongBuy,title="Strong Buy", color=color.green, style=shape.arrowup,location=location.belowbar, text="Strong Buy")
plotshape(Sell,title="Sell", color=color.red, style=shape.arrowdown,text="Sell")
plotshape(StrongSell,title="Strong Sell", color=color.red, style=shape.arrowdown,text="Strong Sell")

strategy.entry("GoGo Long", strategy.long, 1, when=vwaplong and vwapInput)
strategy.entry("GoGo Short", strategy.short, 1, when=vwapshort and vwapInput)

strategy.close("GoGo Long", when = vwapshort and vwapInput)
strategy.close("GoGo Short", when = vwaplong and vwapInput)


alertcondition(Buy, title="Buy Signal", message="Buy")
alertcondition(Sell, title="Sell Signal", message="Sell")