Chiến lược theo xu hướng dựa trên bộ dao động được làm mịn
Tổng quan
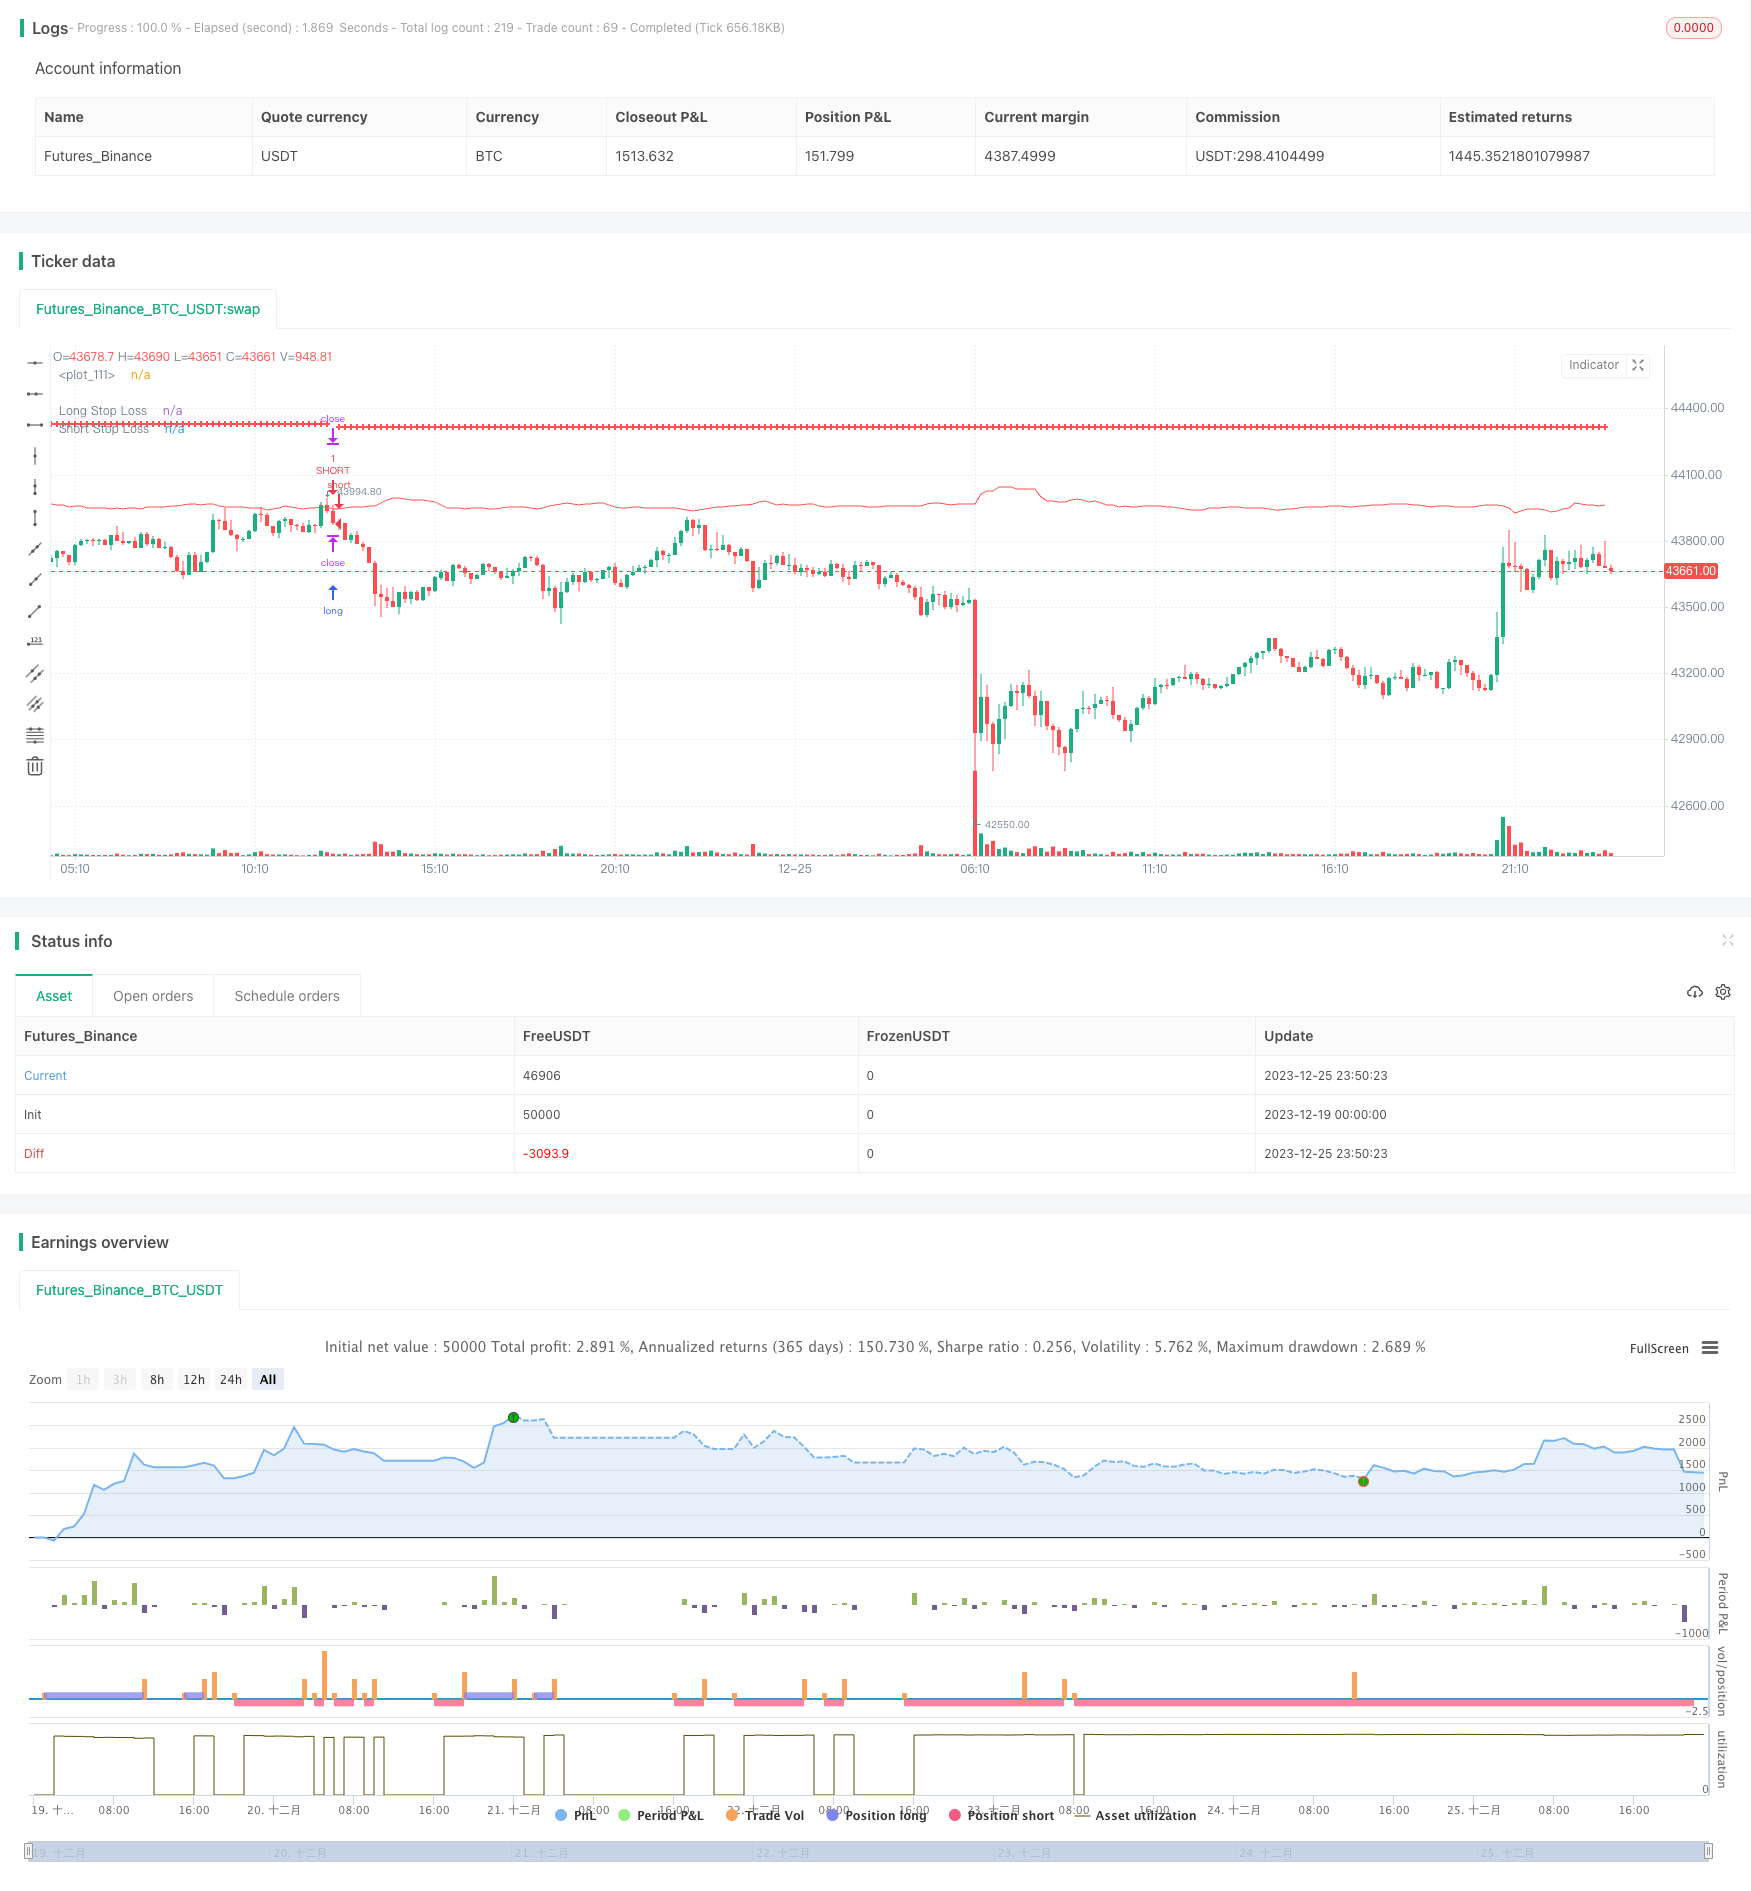
Chiến lược này dựa trên chỉ số biến động trơn để xác định xu hướng giá và sử dụng phương pháp theo dõi xu hướng để giao dịch. Khi giá vượt qua đường chỉ số, hãy đi đầu và khi giá giảm xuống đường chỉ số, hãy đi đầu.
Nguyên tắc chiến lược
Chiến lược này sử dụng chỉ số dao động phẳng tùy chỉnh để xác định xu hướng giá. Chỉ số này tính toán giá khống chế K hiện tại, tức là giá lý thuyết có thể làm cho lỗ hổng và màu đường dẫn bị đảo ngược. Sau đó xử lý giá khống chế này để tạo ra đường chỉ số dao động phẳng cuối cùng.
Chiến lược sử dụng đường chỉ số phá vỡ như một tín hiệu để xây dựng vị trí. Làm nhiều khi giá vượt qua đường chỉ số và làm trống khi giá giảm xuống đường chỉ số. Giới hạn dừng là một tỷ lệ phần trăm của giá nhập để khóa lợi nhuận và kiểm soát rủi ro.
Lợi thế chiến lược
- Sử dụng các chỉ số tùy chỉnh để xác định xu hướng, đánh giá lại hiệu suất tốt hơn
- Sử dụng theo dõi xu hướng, gần như phù hợp với lý thuyết giao dịch xu hướng định lượng
- Thiết lập dừng lỗ có lợi cho kiểm soát rủi ro
Phân tích rủi ro
- Chỉ số có một mức độ lùi có thể dẫn đến chiến lược kém hiệu quả
- Dựa trên chỉ số duy nhất, dễ tạo ra tín hiệu sai
- Cài đặt dừng lỗ có thể được tối ưu hóa và có thể xảy ra quá dừng lỗ
Hướng tối ưu hóa
- Xem xét kết hợp với các chỉ số khác để lọc tín hiệu giao dịch, chẳng hạn như BRI, RSI, v.v.
- Kiểm tra các thiết lập tham số chỉ số khác nhau
- Kiểm tra và tối ưu hóa các phương pháp giảm tổn thất
- Thêm dữ liệu thử nghiệm cho các giống và chu kỳ khác nhau
Tóm tắt
Chiến lược này có ý tưởng tổng thể rõ ràng, sử dụng các chỉ số tùy chỉnh để xác định xu hướng và giao dịch theo cách theo dõi xu hướng. Từ kết quả đánh giá lại, chiến lược hoạt động tốt, có một số tiềm năng hoạt động trên sàn. Tuy nhiên, chỉ dựa vào chỉ số duy nhất và có một số lùi, chất lượng tín hiệu vẫn còn phải được xác minh. Ngoài ra, cơ chế ngăn chặn thiệt hại cũng cần được thử nghiệm và tối ưu hóa hơn nữa.
/*backtest
start: 2023-12-19 00:00:00
end: 2023-12-26 00:00:00
period: 10m
basePeriod: 1m
exchanges: [{"eid":"Futures_Binance","currency":"BTC_USDT"}]
*/

// This source code is subject to the terms of the Mozilla Public License 2.0 at https://mozilla.org/MPL/2.0/

// © TraderHalai
// This is a backtest of the Smoothed Heikin Ashi Trend indicator, which computes the reverse candle close price required to flip a heikin ashi trend from red to green and vice versa. Original indicator can be found on the scripts section of my profile.

// Default testing parameters are 10% of equity position size, with a 1% stop loss on short and long strategy.opentrades.commission

// This particular back test uses this indicator as a Trend trading tool with a tight stop loss. The equity curve as tested seems promising but requires further work to refine. Note in an actual trading setup, you may wish to use this with volatilty filters as most of the losses are in sideways, low volatility markets.


//@version=5
strategy("Smoothed Heikin Ashi Trend on Chart - TraderHalai BACKTEST", " SHA Trend - BACKTEST", overlay=true)
//Inputs

i_useSmooth =       input ( true, "Use smoothing Heikin Ashi")
i_smoothingMethod = input.string("SMA", "Method", options=["SMA", "EMA", "HMA", "VWMA", "RMA"])
i_smoothingPeriod = input ( 10, "Smoothing period")

i_infoBox   =       input ( true, "Show Info Box"        )
i_decimalP  =       input ( 2,    "Prices Decimal Places")
i_boxOffSet =       input ( 5,    "Info Box Offset"      )
i_repaint   =       input (false,  "Repaint -  Keep on for live / Off for backtest")

i_longLossPerc = input.float(title="Long Stop Loss (%)",minval=0.0, step=0.1, defval=1) * 0.01

i_shortLossPerc = input.float(title="Short Stop Loss (%)", minval=0.0, step=0.1, defval=1) * 0.01


timeperiod = timeframe.period

//Security functions to avoid repaint, as per PineCoders
f_secureSecurity(_symbol, _res, _src) => request.security(_symbol, _res, _src[1], lookahead = barmerge.lookahead_on)
f_security(_symbol, _res, _src, _repaint) => request.security(_symbol, _res, _src[_repaint ? 0 : barstate.isrealtime ? 1 : 0])[_repaint ? 0 : barstate.isrealtime ? 0 : 1]
f_secSecurity2(_symbol, _res, _src) => request.security(_symbol, _res, _src[1])


candleClose = f_security(syminfo.tickerid, timeperiod, close, i_repaint)
candleOpen = f_security(syminfo.tickerid, timeperiod, open, i_repaint)
candleLow = f_security(syminfo.tickerid, timeperiod, low, i_repaint)
candleHigh = f_security(syminfo.tickerid, timeperiod, high, i_repaint)

haTicker = ticker.heikinashi(syminfo.tickerid)
haClose = f_security(haTicker, timeperiod, close, i_repaint)
haOpen = f_security(haTicker, timeperiod, open, i_repaint)
haLow = f_security(haTicker, timeperiod, low, i_repaint)
haHigh= f_security(haTicker, timeperiod, high, i_repaint)


reverseClose = (2 * (haOpen[1] + haClose[1])) - candleHigh - candleLow - candleOpen

if(reverseClose < candleLow)
    reverseClose := (candleLow + reverseClose) / 2

if(reverseClose > candleHigh)
    reverseClose := (candleHigh + reverseClose) / 2

//Smoothing

smaSmoothed = ta.sma(reverseClose, i_smoothingPeriod)
emaSmoothed = ta.ema(reverseClose, i_smoothingPeriod)
hmaSmoothed = ta.hma(reverseClose, i_smoothingPeriod)
vwmaSmoothed = ta.vwma(reverseClose, i_smoothingPeriod)
rmaSmoothed = ta.rma(reverseClose, i_smoothingPeriod)

shouldApplySmoothing = i_useSmooth and i_smoothingPeriod > 1

smoothedReverseClose = reverseClose

if(shouldApplySmoothing)
    if(i_smoothingMethod == "SMA")
        smoothedReverseClose := smaSmoothed
    else if(i_smoothingMethod == "EMA")
        smoothedReverseClose := emaSmoothed
    else if(i_smoothingMethod == "HMA")
        smoothedReverseClose := hmaSmoothed
    else if(i_smoothingMethod == "VWMA")
        smoothedReverseClose := vwmaSmoothed
    else if(i_smoothingMethod == "RMA")
        smoothedReverseClose := rmaSmoothed
    else
        smoothedReverseClose := reverseClose // Default to non-smoothed for invalid smoothing type

haBull = candleClose >= smoothedReverseClose
haCol = haBull ? color.green : color.red


//Overall trading strategy
if(ta.crossover(candleClose, smoothedReverseClose))
    strategy.entry("LONG", strategy.long, stop=smoothedReverseClose)
else
    strategy.cancel("LONG")

if(ta.crossunder(candleClose, smoothedReverseClose))
    strategy.entry("SHORT", strategy.short, stop=smoothedReverseClose)
else
    strategy.cancel("SHORT")


longStopPrice  = strategy.position_avg_price * (1 - i_longLossPerc)
shortStopPrice = strategy.position_avg_price * (1 + i_shortLossPerc)


plot(series=(strategy.position_size > 0) ? longStopPrice : na,
     color=color.red, style=plot.style_cross,
     linewidth=2, title="Long Stop Loss")
plot(series=(strategy.position_size < 0) ? shortStopPrice : na,
     color=color.red, style=plot.style_cross,
     linewidth=2, title="Short Stop Loss")

plot(smoothedReverseClose, color=haCol)

if (strategy.position_size > 0)
    strategy.exit(id="XL STP", stop=longStopPrice)

if (strategy.position_size < 0)
    strategy.exit(id="XS STP", stop=shortStopPrice)