Chiến lược theo xu hướng dựa trên nhiều chỉ số
Tổng quan
Chính sách này được gọi làChiến lược theo dõi xu hướng kết hợp nhiều chỉ số(Multi-Indicator Trend Tracking Strategy), sử dụng các chỉ số khác nhau như chỉ số biến đổi Fisher, trung bình di chuyển trọng lượng ((WMA), chỉ số tương đối mạnh ((RSI) và đường trung bình ((OBV) để xác định xu hướng thị trường và thực hiện giao dịch theo xu hướng.
Nguyên tắc chiến lược
- Chỉ số biến đổi Fisher đánh giá xu hướng và cường độ của sự thay đổi giá. Khi 4 đường Fisher thay đổi màu đồng thời, nó phát ra tín hiệu giao dịch.
- WMA đánh giá xu hướng lớn. RSI lọc các tín hiệu giả.
- Chỉ số OBV được sử dụng để xác nhận xu hướng.
Cụ thể, chỉ số biến đổi Fisher bao gồm 4 đường 1 lần, 2 lần, 4 lần và 8 lần. 4 đường tạo ra tín hiệu nhiều khi cùng một lúc lên màu xanh lá cây và 4 đường tạo ra tín hiệu trống khi cùng một lúc xuống màu đỏ. WMA đánh giá hướng xu hướng lớn, nếu chỉ số lên thì được đánh giá là lạc quan, nếu chỉ số xuống thì được đánh giá là lạc quan.
Phân tích lợi thế
Chiến lược này có những ưu điểm sau:
- Chỉ số chuyển đổi Fisher có khả năng phán đoán mạnh mẽ, khi 4 đường Fisher đổi màu cùng một lúc, đảm bảo xu hướng có khả năng đảo ngược.
- WMA đánh giá các xu hướng chính và tránh giao dịch ngược.
- Chỉ số OBV xác nhận xu hướng, tránh phá vỡ giả của thị trường không xu hướng.
- Chỉ số RSI lọc các tín hiệu giả để đảm bảo độ tin cậy của tín hiệu.
Việc sử dụng kết hợp nhiều chỉ số, đảm bảo tính chính xác và độ tin cậy của tín hiệu giao dịch, cũng như khả năng theo dõi xu hướng, có thể mang lại hiệu quả chiến lược tốt hơn.
Phân tích rủi ro
Chiến lược này cũng có một số rủi ro:
- Nếu thị trường có sự cân bằng, đường Fisher dễ tạo ra tín hiệu giả. Trong trường hợp này, cần dựa vào bộ lọc RSI.
- WMA tham số được thiết lập không đúng cũng có thể ảnh hưởng đến tính chính xác của phán đoán.
- Chỉ số chuyển đổi Fisher ít có khả năng đánh giá các hoạt động trên đường siêu ngắn.
- Nếu có sự cố, chiến lược này có thể gây ra thiệt hại lớn.
Để giảm rủi ro, các tham số RSI có thể được điều chỉnh thích hợp, tối ưu hóa các tham số chu kỳ WMA. Đồng thời, có thể thiết lập điểm dừng lỗ để tránh thua lỗ quá lớn.
Hướng tối ưu hóa
Chiến lược này có thể được tối ưu hóa hơn nữa bằng cách:
- Có thể kiểm tra hiệu quả của chiến lược dưới các tham số khác nhau để tìm ra sự kết hợp tham số tốt nhất.
- Thêm cơ chế dừng lỗ. Khi lỗ đạt đến một tỷ lệ nhất định.
- Điều chỉnh thêm các tham số của chỉ số biến đổi Fisher dựa trên kết quả đo lại để tìm ra sự kết hợp các tham số chính xác nhất để đánh giá chỉ số.
- Thử thêm các bộ lọc khác, chẳng hạn như bộ lọc mạnh, yếu, thiên vị, v.v.
- Kiểm tra các thiết lập kích thước vị trí mở khác nhau.
Tóm tắt
Chiến lược này sử dụng tổng hợp các chỉ số chuyển đổi Fisher, WMA, OBV và RSI để đánh giá xu hướng của thị trường. Nó đánh giá tín hiệu chính xác, có khả năng xác nhận mạnh mẽ, có thể khóa xu hướng hiệu quả để kiếm lợi nhuận. Bằng cách tối ưu hóa tham số, có thể nâng cao thêm yếu tố lợi nhuận của chiến lược.
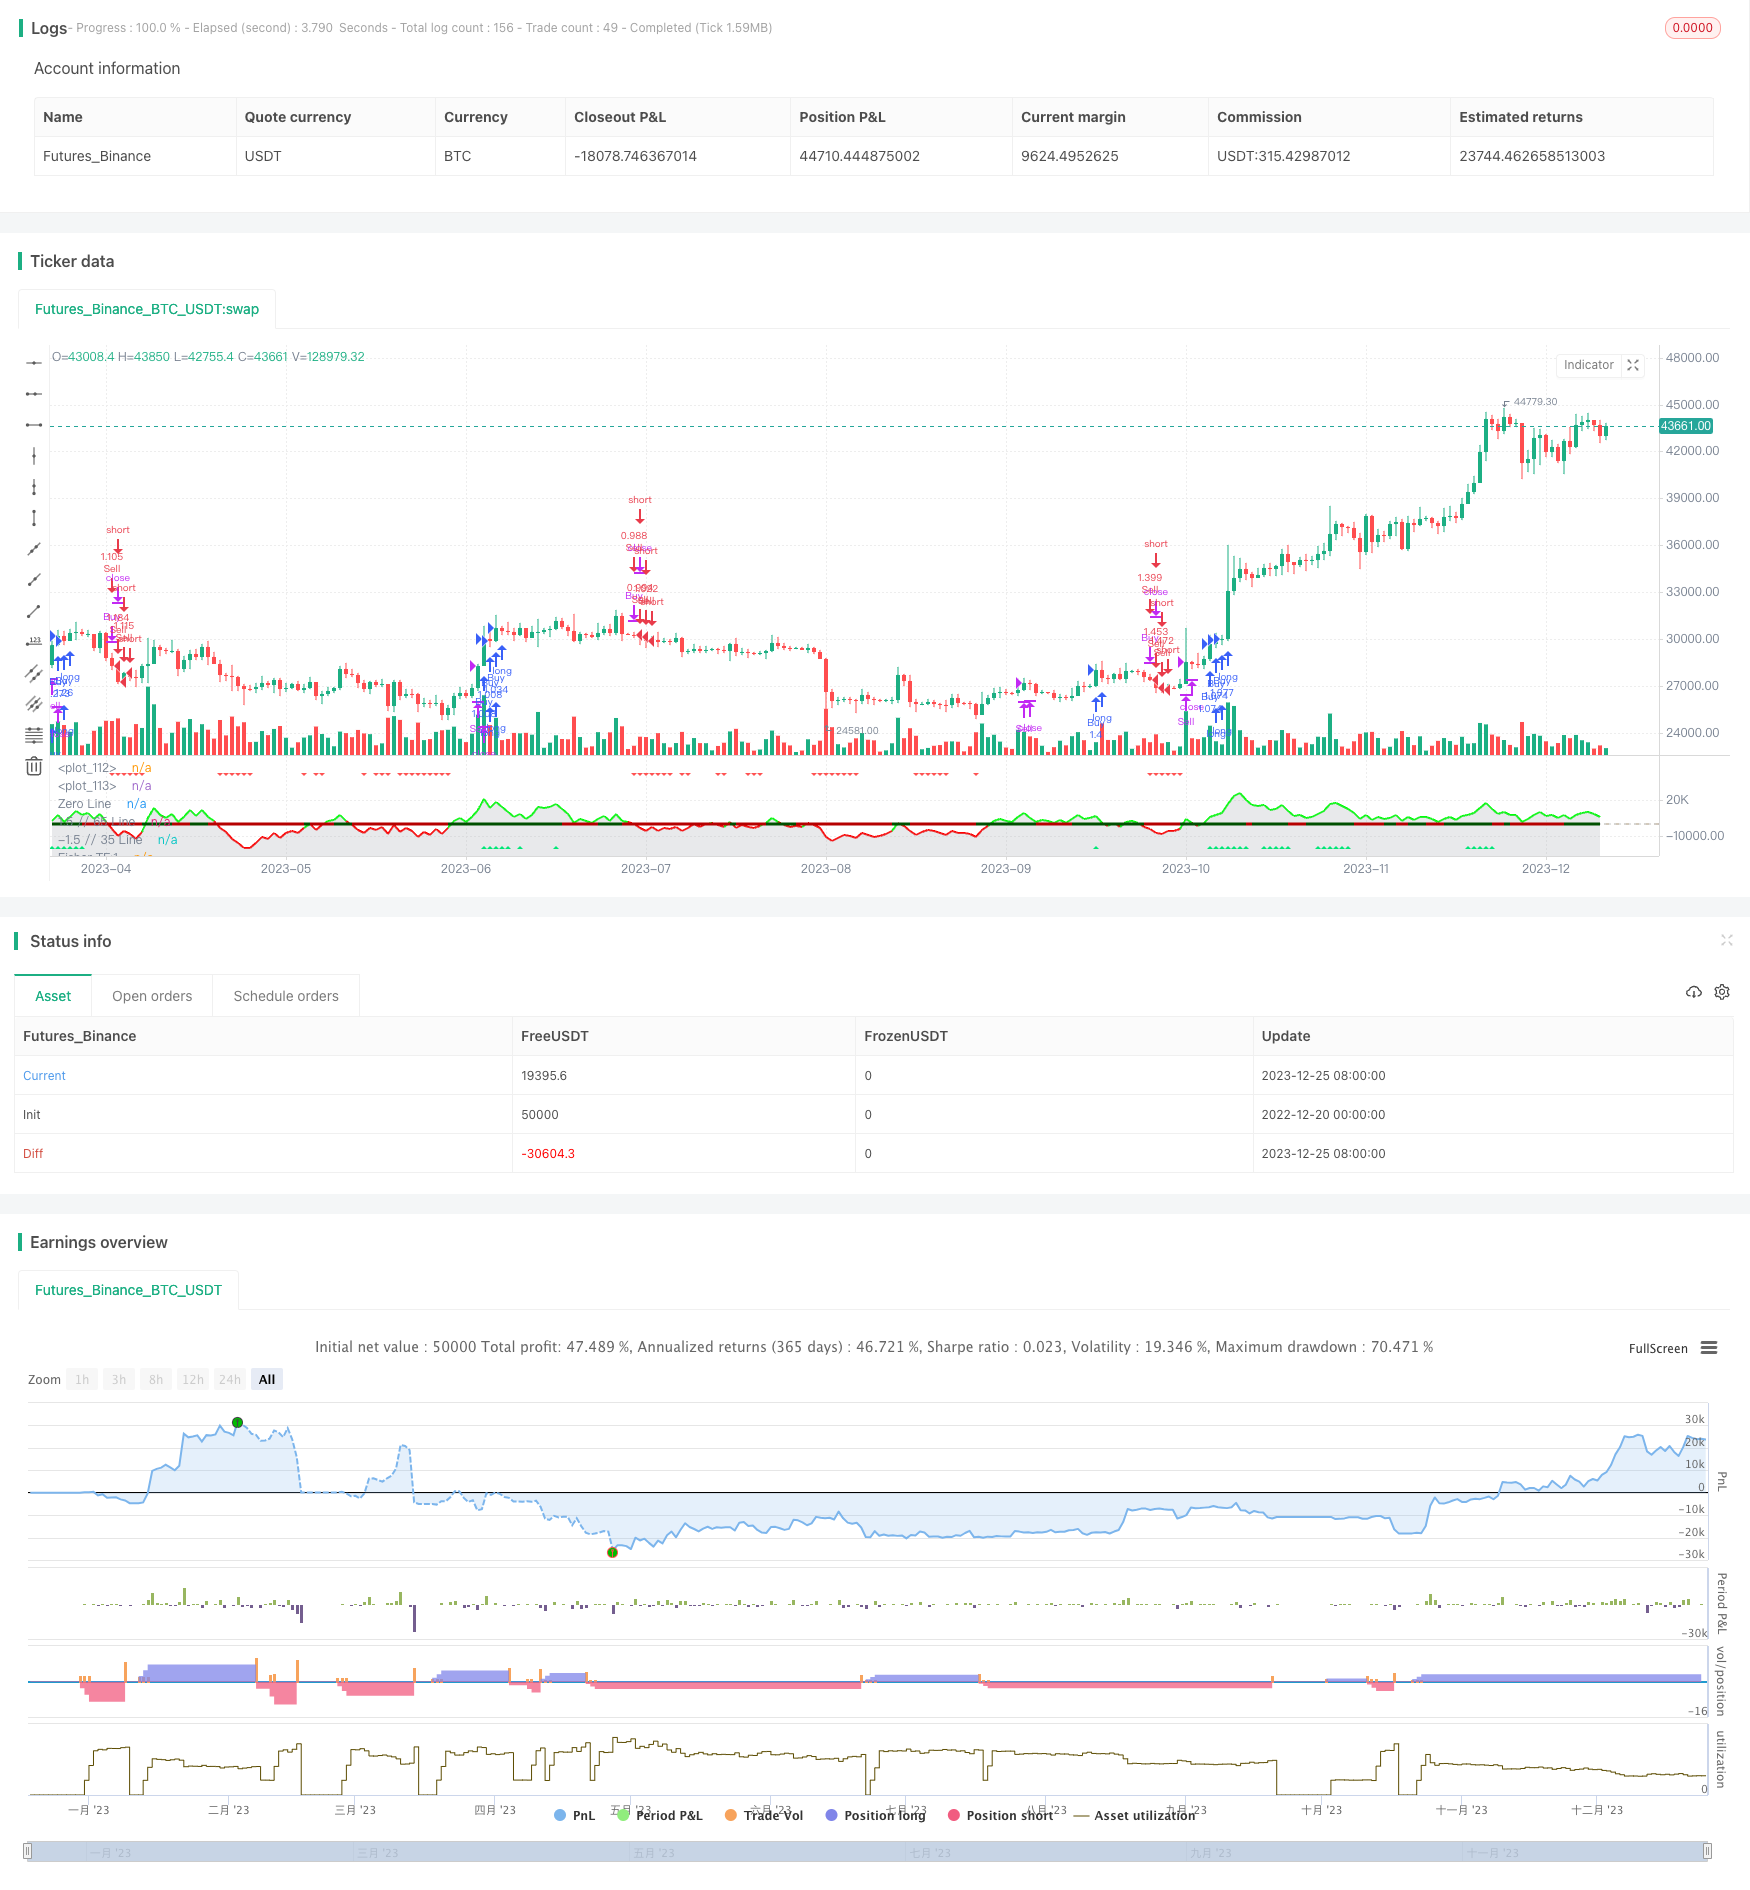
/*backtest
start: 2022-12-20 00:00:00
end: 2023-12-26 00:00:00
period: 1d
basePeriod: 1h
exchanges: [{"eid":"Futures_Binance","currency":"BTC_USDT"}]
*/

//@version=5
//author Sdover0123
strategy(title='FTR, WMA, OBV & RSI Strat', shorttitle='FTR WMA, OBV, RSI',overlay=false, default_qty_type=strategy.percent_of_equity, initial_capital = 100, default_qty_value=100, commission_value = 0.06, pyramiding = 3)
Len = input.int(10, minval=1, group ="Fisher Transform")
mult1 = input.int(1, minval=1, group ="Fisher Transform")
mult2 = input.int(2, minval=1, group ="Fisher Transform")
mult3 = input.int(4, minval=1, group ="Fisher Transform")
mult4 = input.int(8, minval=1, group ="Fisher Transform")
fish(Length, timeMultiplier) =>
    var nValue1 = 0.0
    var nValue2 = 0.0
    var nFish = 0.0
    xHL2 = hl2
    xMaxH = ta.highest(xHL2, Length * timeMultiplier)
    xMinL = ta.lowest(xHL2, Length * timeMultiplier)
    nValue1 := 0.33 * 2 * ((xHL2 - xMinL) / (xMaxH - xMinL) - 0.5) + 0.67 * nz(nValue1[1])
    if nValue1 > .99
        nValue2 := .999
        nValue2
    else if nValue1 < -.99
        nValue2 := -.999
        nValue2
    else
        nValue2 := nValue1
        nValue2
    nFish := 0.5 * math.log((1 + nValue2) / (1 - nValue2)) + 0.5 * nz(nFish[1])
    nFish
Fisher1 = fish(Len, mult1)
Fisher2 = fish(Len, mult2)
Fisher4 = fish(Len, mult3)
Fisher8 = fish(Len, mult4)

rsiLength = input.int(14, minval=1, group ="Moving Averages")
rsiVal = (ta.rsi(close, rsiLength) - 50) / 10
avg = strategy.position_avg_price

wma(source, length) =>
    sum = 0.0
    for i = 0 to length - 1
        sum := sum + source[i] * (length - i)
    wma = sum / (length * (length + 1) / 2)
    wma

wmaLength = input.int(10, "WMA Length", minval=1, group ="Moving Averages")
wmaClose = wma(close, wmaLength)
// Determine if WMA is bullish or bearish
isWmaBullish = wmaClose > wmaClose[1]
isWmaBearish = wmaClose < wmaClose[1]

//OBV
src = close
length = input.int(20, title="OBV Length", group="On-Balance Volume")
obv1(src) =>
    change_1 = ta.change(src)
    ta.cum(ta.change(src) > 0 ? volume : change_1 < 0 ? -volume : 0 * volume)*0.01
os = obv1(src)
obv_osc = os - ta.ema(os, length)
obc_color = (obv_osc > 0 ? color.rgb(0, 255, 8) : color.rgb(255, 0, 0))
plot(obv_osc, color=obc_color, style=plot.style_line, title='OBV-Points', linewidth=2)
plot(obv_osc, color=color.new(#b2b5be, 70), title='OBV', style=plot.style_area)
obvBullFilter = input.float(0.1, minval = 0, maxval = 5, step = 0.01, title ="OBV Bullish minimum value", group="On-Balance Volume")
obvBearFilter = input.float(-0.1, minval = -5, maxval = 0, step = 0.01, title ="OBV Bearish minimum value", group="On-Balance Volume")
obvBull = obv_osc > obvBullFilter
obvBear = obv_osc < obvBearFilter

// Add buy/sell signals
ReversalFilterDown = input.float(-0.7, 'Reversal Down TP Filter', -4, 4, step = 0.01, group = "RSI Level Filters", tooltip = "This is defined by taking the RSI value -50 and /10. When all Fisher lines are changing colour, this will SL/TP the long")
ReversalFilterUp = input.float(0.7, 'Reversal Up TP Filter', -4, 4, step = 0.01, group = "RSI Level Filters", tooltip = "This is defined by taking the RSI value -50 and /10. When all Fisher lines are changing colour, this will SL/TP the short")
RSILevelBuyFilter = input.float(1.66, 'RSI Level Buy Filter', -4, 4, step = 0.01, group = "RSI Level Filters", tooltip = "This is defined by taking the RSI value -50 and /10. Consider negative values")
RSILevelSellFilter = input.float(1, 'RSI Level Sell Filter', -4, 4, step = 0.01, group = "RSI Level Filters", tooltip = "This is defined by taking the RSI value -50 and /10. Consider negative values")
//buys - if breaking out and all Fisher are green and RSI filter value is met
buySignal = Fisher1 > Fisher1[1] and Fisher2 > Fisher2[1] and Fisher4 > Fisher4[1] and Fisher8 > Fisher8[1] and rsiVal > RSILevelBuyFilter and isWmaBullish and obvBull
ReversalUp = Fisher1 > Fisher1[1] and Fisher2 > Fisher2[1] and Fisher4 > Fisher4[1] and Fisher8 > Fisher8[1] and rsiVal > ReversalFilterUp
//sells - if breaking down and all Fisher are green and RSI filter value is met
sellSignal = Fisher1 < Fisher1[1] and Fisher2 < Fisher2[1] and Fisher4 < Fisher4[1] and Fisher8 < Fisher8[1] and rsiVal < RSILevelSellFilter and isWmaBearish and obvBear
ReversalDown = Fisher1 < Fisher1[1] and Fisher2 < Fisher2[1] and Fisher4 < Fisher4[1] and Fisher8 < Fisher8[1] and rsiVal < ReversalFilterDown


// Buy and Sell conditions
if buySignal and time>timestamp(2022, 06, 01, 09, 30) and barstate.isconfirmed
    strategy.close("Sell", comment = "Close Short")
    strategy.entry("Buy", strategy.long, comment = "Long")

if sellSignal and time>timestamp(2022, 06, 01, 09, 30) and barstate.isconfirmed
    strategy.close("Buy", comment = "Close Long")
    strategy.entry("Sell", strategy.short, comment = "Short")

if ReversalDown
    strategy.close("Buy", comment = "Close Long")

if ReversalUp
    strategy.close("Sell", comment = "Close Short")

//Plotting
//Fisher
plot(Fisher1, color=Fisher1 > nz(Fisher1[1]) ? color.green : color.rgb(255, 0, 0), title='Fisher TF:1')
plot(Fisher2, color=Fisher2 > nz(Fisher2[1]) ? color.green : color.rgb(255, 0, 0), title='Fisher TF:1', linewidth=2)
plot(Fisher4, color=Fisher4 > nz(Fisher4[1]) ? #008000 : #b60000, title='Fisher TF:1', linewidth=3)
plot(Fisher8, color=Fisher8 > nz(Fisher8[1]) ? #004f00 : #b60000, title='Fisher TF:1', linewidth=3)
//RSI
plot(rsiVal, color=rsiVal < 0 ? color.purple : color.yellow, linewidth=2, title='RSI')

//WMA
plot(isWmaBullish ? -2 : na, color=color.rgb(76, 175, 79, 20), linewidth=3, style=plot.style_linebr, title="WMA Bullish")
plot(isWmaBearish ? -2 : na, color=color.rgb(255, 82, 82, 20), linewidth=3, style=plot.style_linebr, title="WMA Bearish")

//Buy/Sell Signals
plotshape(buySignal, title='Buy Signal', location=location.bottom, color=color.new(color.lime, 0), style=shape.triangleup, size=size.small)
plotshape(sellSignal, title='Sell Signal', location=location.top, color=color.new(color.red, 0), style=shape.triangledown, size=size.small)

//Orientation
hline(RSILevelBuyFilter, color=color.rgb(25, 36, 99, 20), linestyle=hline.style_dotted, linewidth=2)
hline(RSILevelSellFilter, color=color.rgb(111, 27, 27, 20), linestyle=hline.style_dotted, linewidth=2)
hline(0, color=color.rgb(181, 166, 144, 39), linestyle=hline.style_dashed, linewidth=2, title = "Zero Line")
hline(1.5, color=color.rgb(217, 219, 220, 50), linestyle=hline.style_dotted, linewidth=2, title = "1.5 // 65 Line")
hline(-1.5, color=color.rgb(217, 219, 220, 50), linestyle=hline.style_dotted, linewidth=2, title = "-1.5 // 35 Line")