Chiến lược mua quá mức và bán quá mức RSI chậm
Tổng quan
Chiến lược mua quá bán RSI chậm mở ra cơ hội giao dịch mới bằng cách kéo dài chu kỳ xem lại RSI, giảm biến động của đường cong RSI. Chiến lược này cũng áp dụng cho các chỉ số kỹ thuật khác như MACD.
Nguyên tắc chiến lược
Ý tưởng cốt lõi của chiến lược này là kéo dài độ dài chu kỳ xem lại của RSI, mặc định 500 chu kỳ, sau đó phẳng đường RSI thông qua SMA, chu kỳ mặc định là 250. Điều này có thể làm giảm đáng kể sự biến động của đường RSI, làm chậm tốc độ phản ứng của RSI, do đó tạo ra cơ hội giao dịch mới.
Chu kỳ xem lại quá dài làm suy yếu tính biến động của đường cong RSI, do đó, tiêu chuẩn đánh giá mua quá mức cũng cần phải được điều chỉnh. Chiến lược đặt đường mua quá mức 52 và đường bán quá mức 48 tùy chỉnh.
Lợi thế chiến lược
- Tạo ra những ý tưởng giao dịch mới bằng cách kéo dài chu kỳ
- Có thể giảm đáng kể tín hiệu giả và tăng sự ổn định
- Có thể tùy chỉnh giá trị thềm mua và bán để phù hợp với các thị trường khác nhau
- Có thể gieo trồng để tăng lãi suất
Rủi ro chiến lược
- Chu kỳ quá dài có thể bỏ lỡ cơ hội ngắn
- Cần kiên nhẫn chờ đợi cơ hội
- Định mức giá trị thềm không chính xác có thể làm tăng tổn thất
- Rủi ro bị lợi nhuận
Giải pháp:
- Giảm thời gian giao dịch, tăng tần suất giao dịch
- Việc xây dựng nhà kho theo lô hàng phân tán rủi ro
- Tối ưu hóa tham số giảm giá để thích ứng với các môi trường thị trường khác nhau
- Thiết lập điểm dừng để tránh thua lỗ lớn
Hướng tối ưu hóa chiến lược
- Tối ưu hóa các tham số của RSI để tìm ra sự kết hợp chu kỳ tốt nhất
- Kiểm tra các tham số chu kỳ phẳng SMA khác nhau
- Tối ưu hóa các tham số mua quá mức để phù hợp với các thị trường khác nhau
- Thêm chiến lược dừng lỗ để kiểm soát tổn thất đơn lẻ
Tóm tắt
Chiến lược bán tháo RSI chậm đã thành công trong việc mở ra một cách giao dịch mới bằng cách kéo dài chu kỳ và sử dụng đường trung bình để kiềm chế biến động. Chiến lược này có khả năng tạo ra lợi nhuận vượt trội ổn định và hiệu quả khi các tham số được tối ưu hóa và rủi ro được kiểm soát.
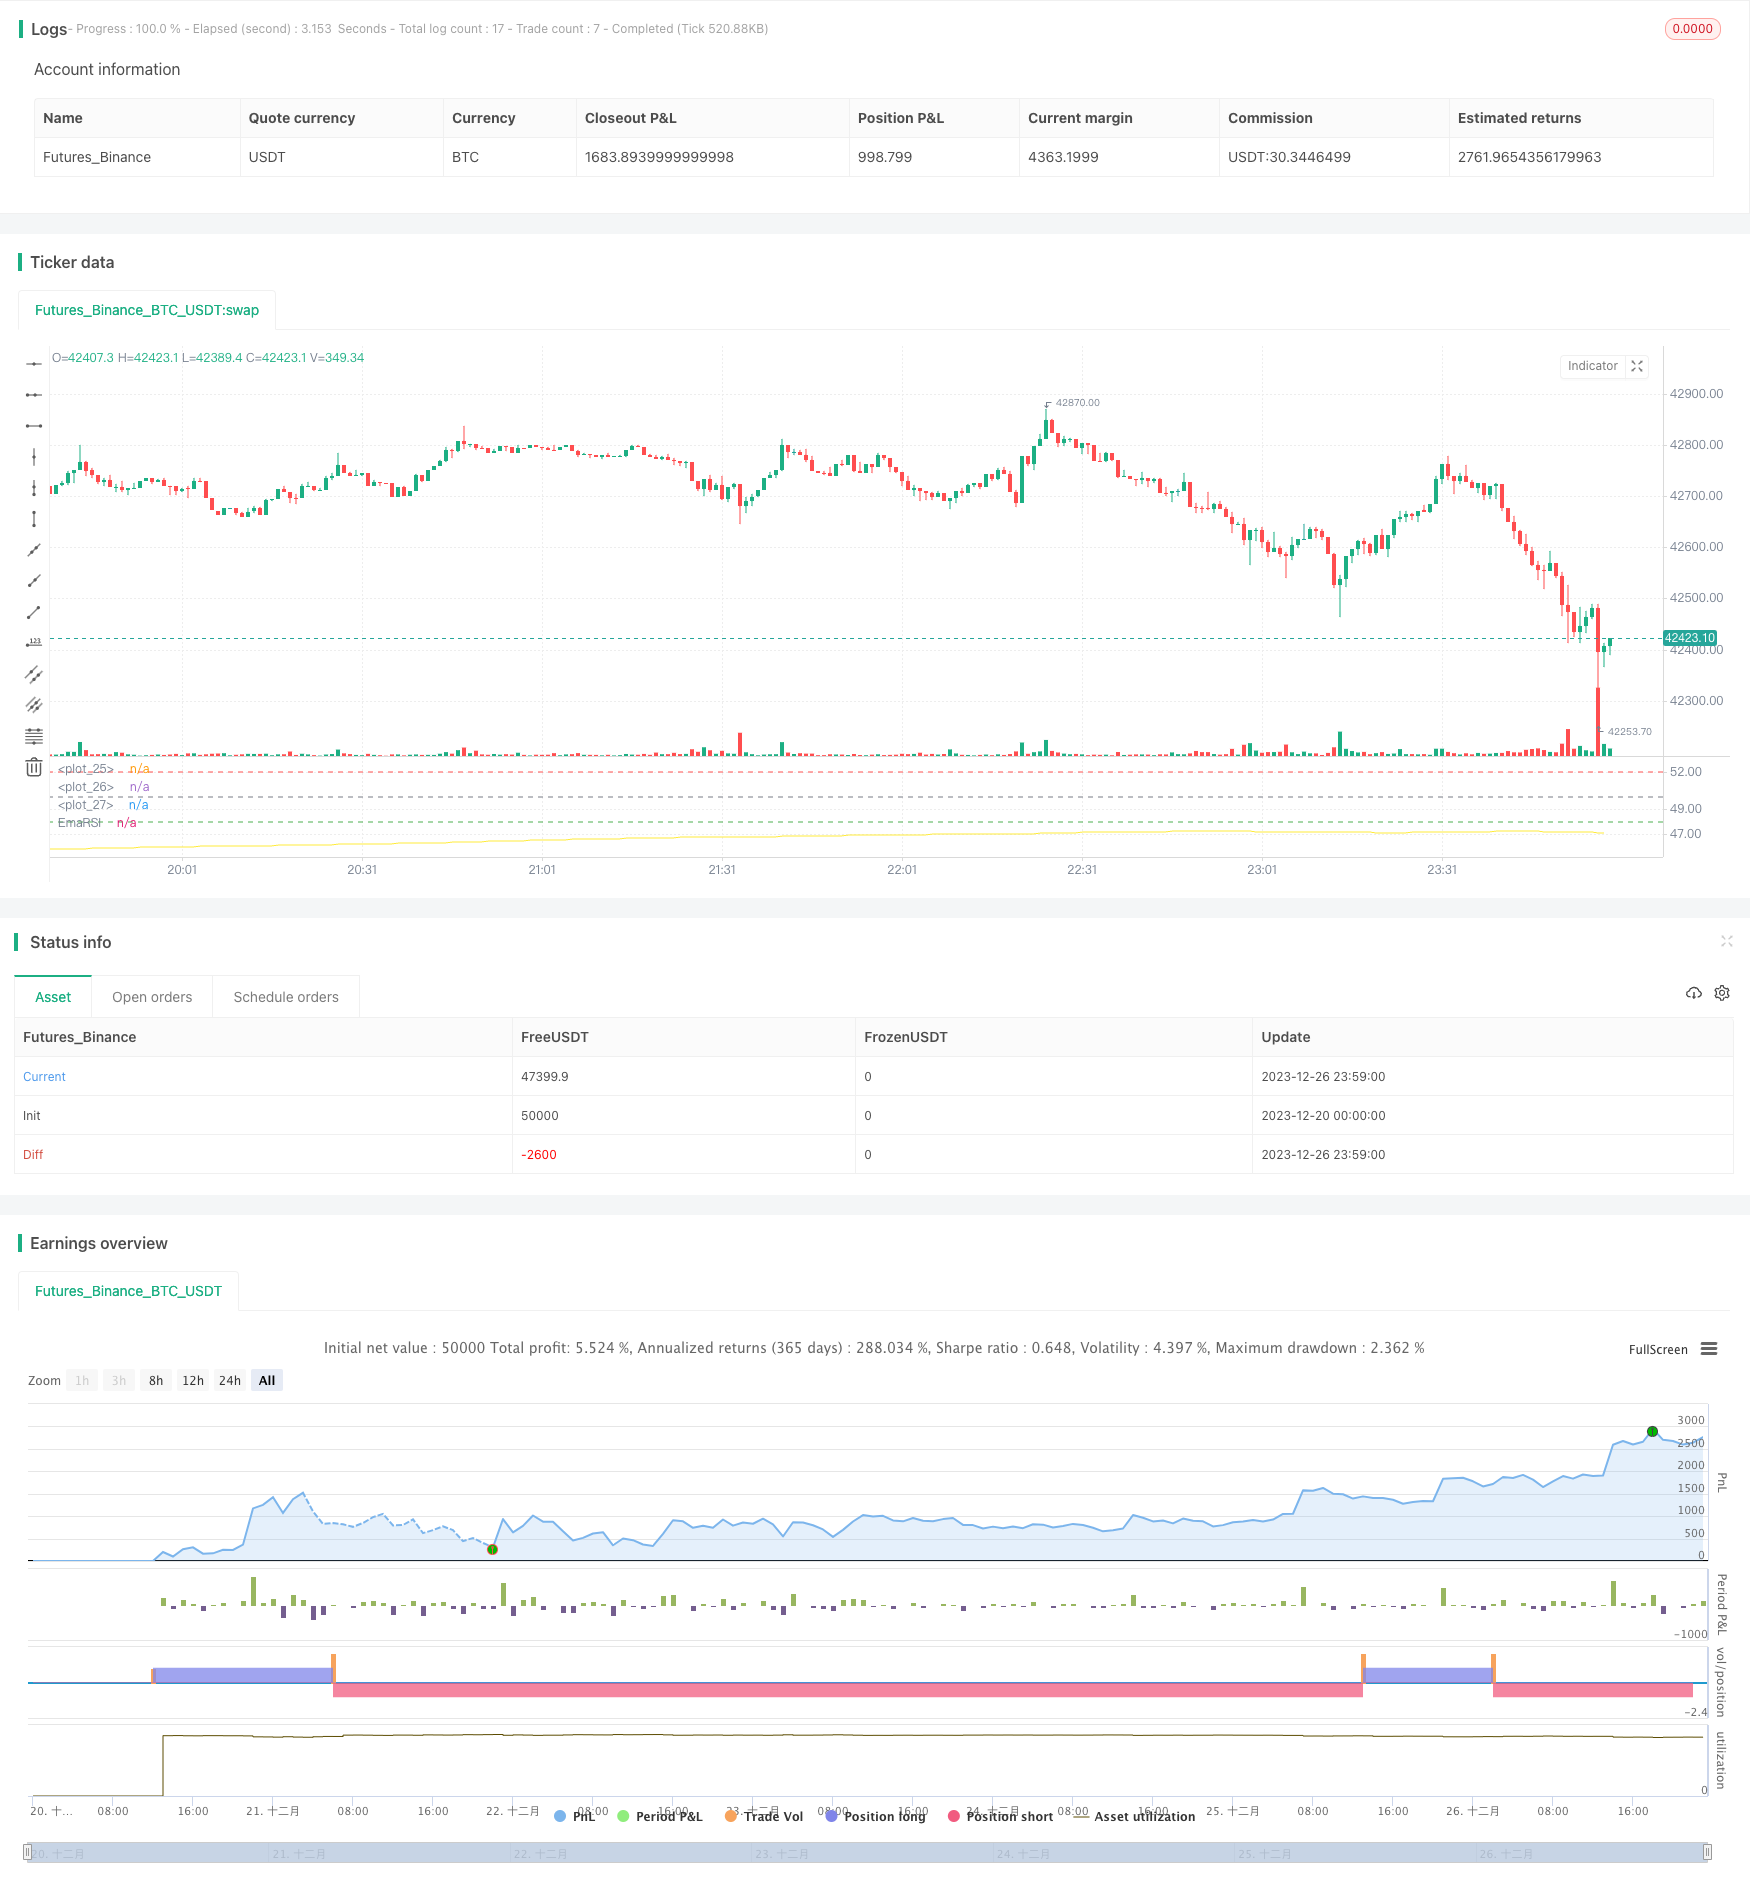
/*backtest
start: 2023-12-20 00:00:00
end: 2023-12-27 00:00:00
period: 1m
basePeriod: 1m
exchanges: [{"eid":"Futures_Binance","currency":"BTC_USDT"}]
*/


// Wilder was a very influential man when it comes to TA. However, I'm one to always try to think outside the box.
// While Wilder recommended that the RSI be used only with a 14 bar lookback period, I on the other hand think there is a lot to learn from RSI if one simply slows down the lookback period
// Same applies for MACD.
// Every market has its dynmaics. So don't narrow your mind by thinking my source code input levels are the only levels that work.
// Since the long lookback period weakens the plot volatility, again, one must think outside the box when trying to guage overbought and oversold levels.

// Good luck and don't bash me if some off-the-wall FA spurned divergence causes you to lose money.
// And NO this doesn't repaint and I won't answer those who ask.
//@version=4

strategy("SLOW RSI OB/OS Strategy", overlay=false)
price = input(ohlc4, title="Price Source")
len = input(500, minval=1, step=5,  title="RSI Length")
smoother = input(250, minval=1, step=5, title="RSI SMA")
up = rma(max(change(price), 0), len)
down = rma(-min(change(price), 0), len)
rsi = down == 0 ? 100 : up == 0 ? 0 : 100 - (100 / (1 + up / down))
EmaRSI = ema(rsi,smoother)
plot(EmaRSI, title="EmaRSI", style=line, linewidth=1, color=yellow)


OB = input(52, step=0.1)
OS = input(48, step=0.1)
hline(OB, linewidth=1, color=red)
hline(OS,linewidth=1, color=green)
hline(50,linewidth=1, color=gray)


long = change(EmaRSI) > 0 and EmaRSI <= 50 and crossover(EmaRSI, OS)
short = change(EmaRSI) < 0 and EmaRSI >= 50 and crossunder(EmaRSI, OB)


strategy.entry("Long", strategy.long, when=long) //_signal or long) //or closeshort_signal)
strategy.entry("Short", strategy.short, when=short) //_signal or short) // or closelong_signal)

// If you want to try to play with exits you can activate these!

//closelong = crossunder(EmaRSI, 0) //or crossunder(EmaRSI, OS)
//closeshort = crossover(EmaRSI, 0) //or crossover(EmaRSI, OB)

//strategy.close("Long", when=closelong)
//strategy.close("Short", when=closeshort)