Chiến lược kiểm tra lại hỗ trợ và kháng cự động
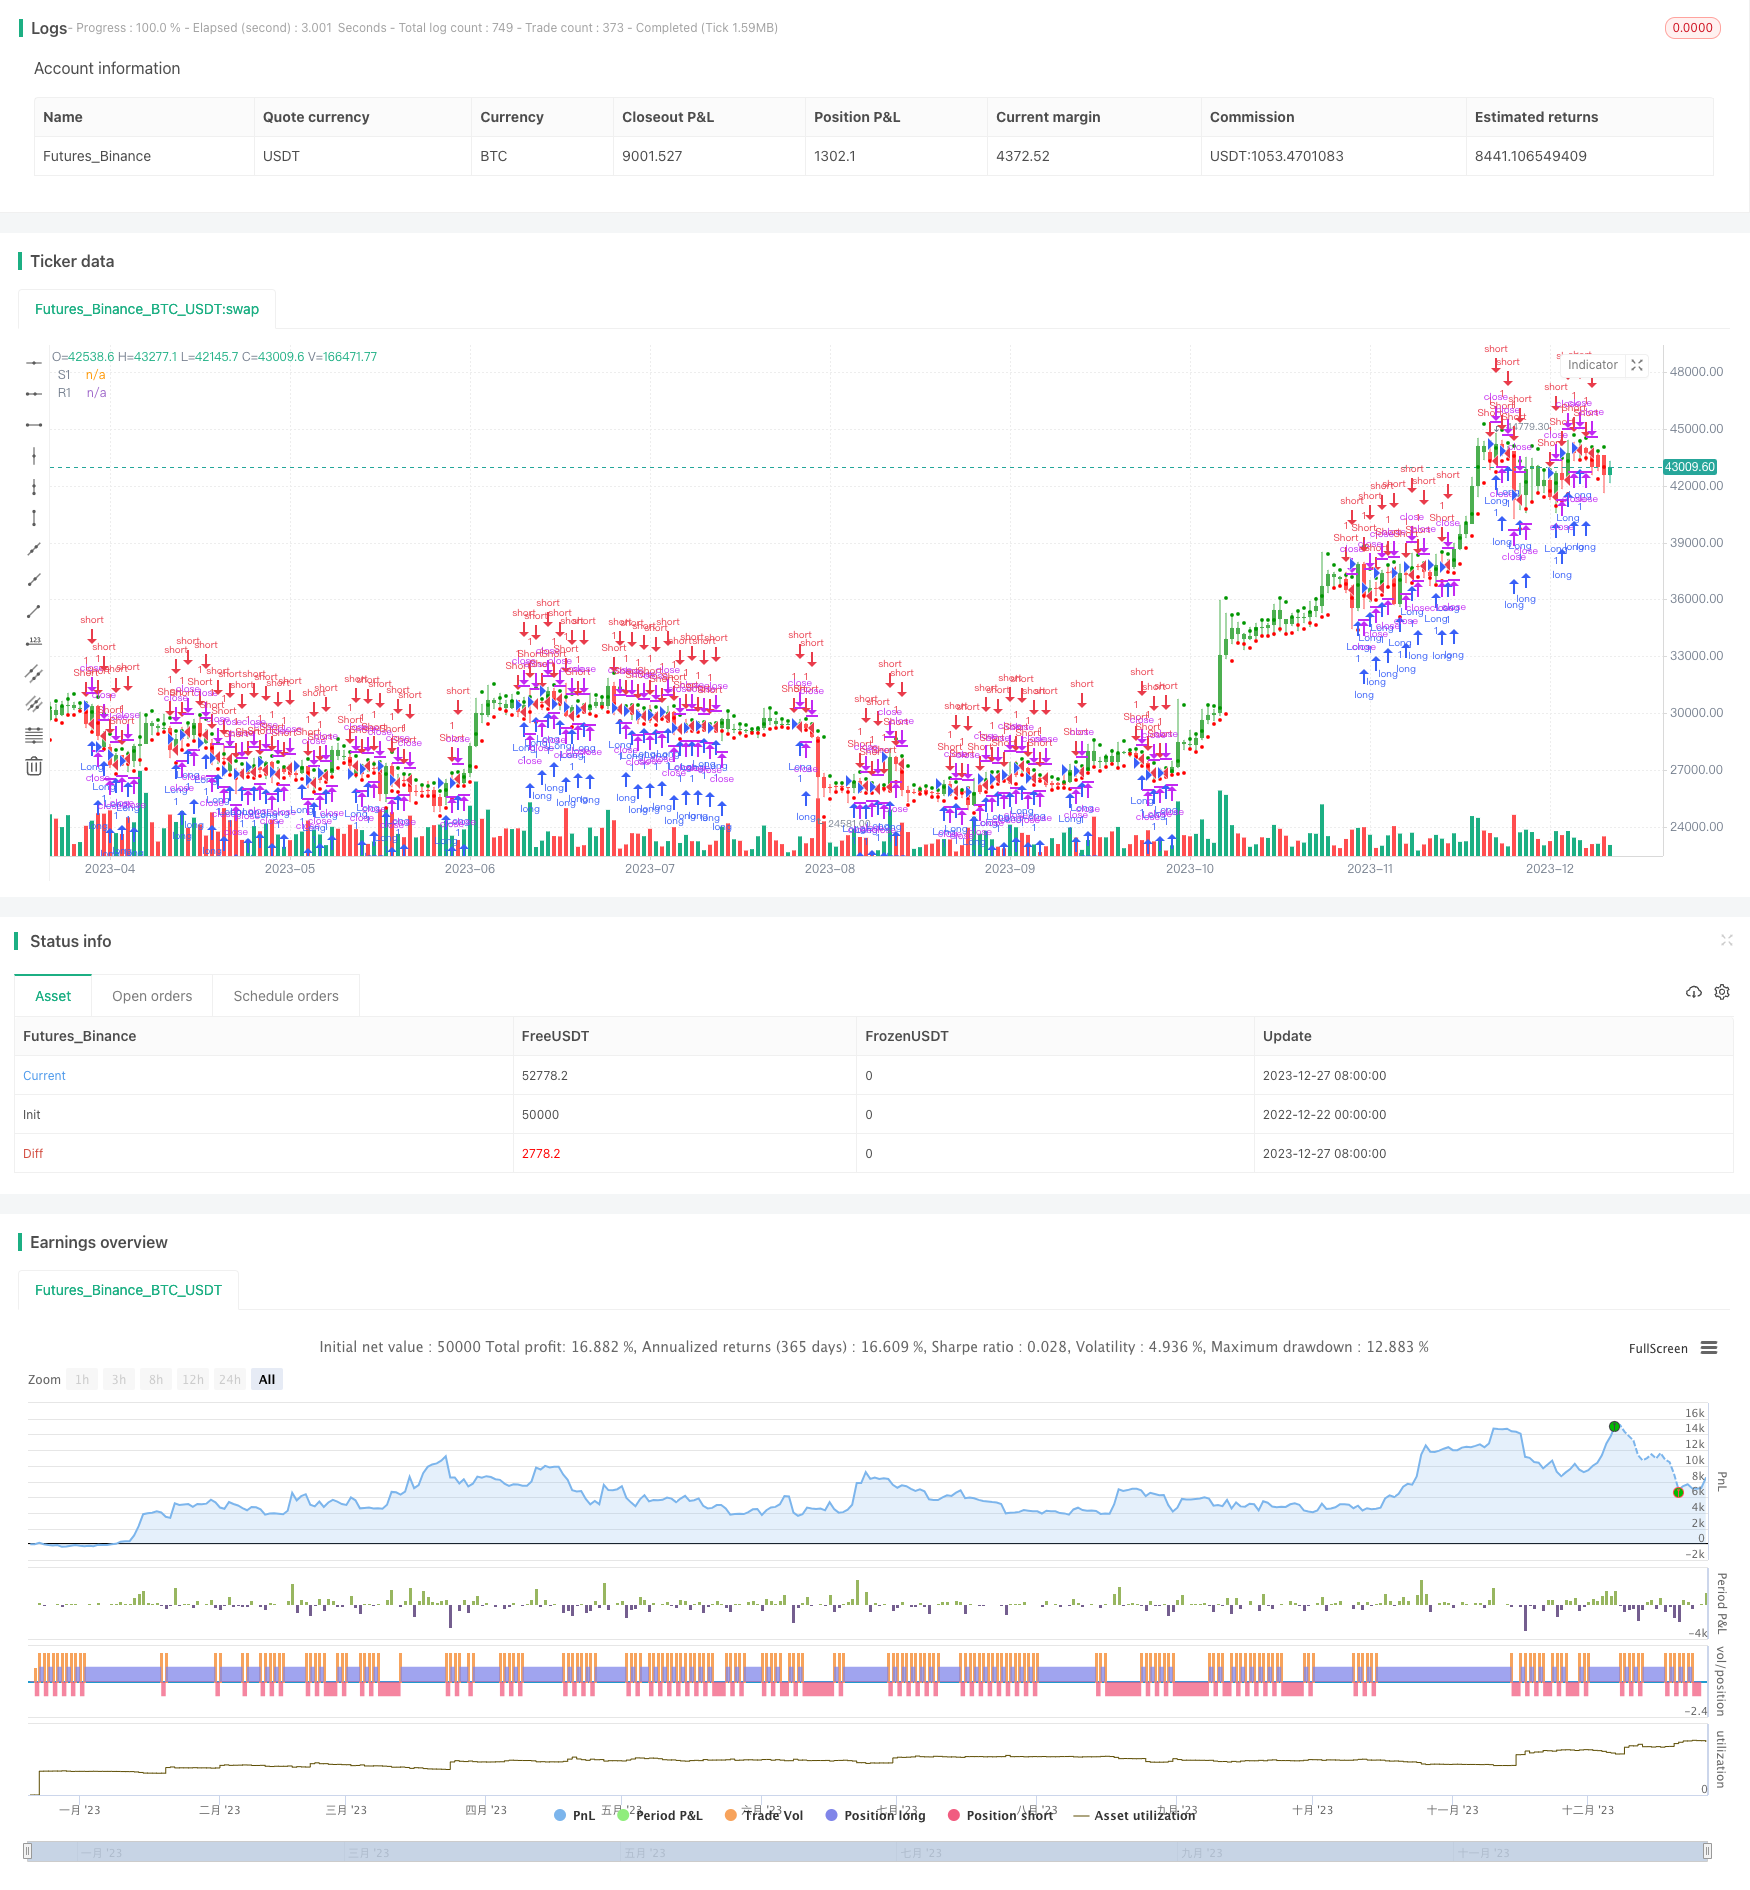
Tổng quan
Chiến lược này dựa trên giá cao nhất, giá thấp nhất và mức kháng cự hỗ trợ được tính toán từ giá đóng cửa của ngày giao dịch trước đó, để thực hiện lệnh dài hoặc ngắn trong ngày giao dịch hiện tại. Khi giá vượt qua ngưỡng kháng cự trên R1, hãy làm nhiều; Khi giá giảm xuống ngưỡng hỗ trợ dưới S1, hãy làm trống. Chiến lược này thuộc chiến lược kháng cự hỗ trợ động.
Nguyên tắc chiến lược
- Xác định mức hỗ trợ S1, mức kháng cự R1 và điểm trung tâm vPP cho ngày giao dịch trước dựa trên giá cao nhất xHigh, giá thấp nhất xLow và giá đóng cửa xClose.
vPP = (xHigh+xLow+xClose) / 3
vR1 = vPP+(vPP-xLow)
vS1 = vPP-(xHigh - vPP)
- Xác định xem giá có vượt vR1 hay vS1 không, nếu vượt vR1 thì tăng, nếu giảm vS1 thì giảm.
pos = iff(close > vR1, 1,
iff(close < vS1, -1, nz(pos[1], 0)))
possig ghi lại hướng giao dịch thực tế. Nếu mở giao dịch đảo ngược reverse=true, tín hiệu giao dịch sẽ bị đảo ngược.
Theo tín hiệu possig, làm thêm khi vượt vR1 và làm trống khi vượt vS1.
Lợi thế chiến lược
- Chiến lược này sử dụng các chỉ số kháng cự hỗ trợ động để nắm bắt các hành động đột phá.
- Các mức kháng cự hỗ trợ được cập nhật hàng ngày và có tính năng động.
- Có thể chọn giao dịch thẳng hoặc giao dịch ngược, áp dụng cho các môi trường thị trường khác nhau.
- Chiến lược này đơn giản, rõ ràng và dễ hiểu.
- Hình ảnh hiển thị mức kháng cự hỗ trợ, trực quan đánh giá xu hướng biến đổi.
Phân tích rủi ro
- Nếu thị trường bị biến động, nó có thể gây ra nhiều tín hiệu mua và bán không cần thiết.
- Trong trường hợp có xu hướng bất thường, kháng cự hỗ trợ có thể tiếp tục kéo dài sau khi bị phá vỡ, gây ra tổn thất.
- Các phương pháp tính toán điểm trục và điểm kháng cự hỗ trợ khá đơn giản và cần được tối ưu hóa hơn nữa.
Phương pháp giải quyết rủi ro:
- Điều chỉnh đúng quy mô nắm giữ để kiểm soát tổn thất đơn lẻ.
- Thiết lập điểm dừng để tránh thiệt hại vượt quá mức chấp nhận được.
- Kết hợp với các chỉ số khác để lọc tín hiệu, tránh giao dịch thường xuyên trong tình huống chấn động.
Hướng tối ưu hóa
- Tối ưu hóa phương pháp tính toán điểm kháng cự hỗ trợ, làm cho nó dự đoán hơn.
- Thêm kết hợp các chỉ số như xu hướng, Momentum, và tránh giao dịch không cần thiết.
- Tăng chiến lược dừng lỗ, kiểm soát đơn vị và tổn thất tối đa.
- Kết hợp các phương pháp học máy để hỗ trợ tính toán bit kháng có thể được tối ưu hóa động.
Tóm tắt
Chiến lược này dựa trên các chỉ số kháng cự hỗ trợ động, giữ vị trí theo hướng phá vỡ giá. Ý tưởng chiến lược đơn giản, dễ hiểu và thực hiện, có thể nắm bắt các điểm biến của xu hướng một cách hiệu quả.
//@version=2
////////////////////////////////////////////////////////////
//  Copyright by HPotter v1.0 14/06/2018
// This Pivot points is calculated on the current day.
// Pivot points simply took the high, low, and closing price from the previous period and
// divided by 3 to find the pivot. From this pivot, traders would then base their
// calculations for three support, and three resistance levels. The calculation for the most
// basic flavor of pivot points, known as ‘floor-trader pivots’, along with their support and
// resistance levels.
//
// You can change long to short in the Input Settings
// WARNING:
// - For purpose educate only
// - This script to change bars colors.
////////////////////////////////////////////////////////////
strategy(title="Dynamic Pivot Point Backtest", shorttitle="Dynamic Pivot Point", overlay = true)
reverse = input(false, title="Trade reverse")
xHigh  = request.security(syminfo.tickerid,"D", high[1])
xLow   = request.security(syminfo.tickerid,"D", low[1])
xClose = request.security(syminfo.tickerid,"D", close[1])
vPP = (xHigh+xLow+xClose) / 3
vR1 = vPP+(vPP-xLow)
vS1 = vPP-(xHigh - vPP)
pos = iff(close > vR1, 1,
       iff(close < vS1, -1, nz(pos[1], 0)))
possig = iff(reverse and pos == 1, -1,
          iff(reverse and pos == -1, 1, pos))
if (possig == 1)
    strategy.entry("Long", strategy.long)
if (possig == -1)
    strategy.entry("Short", strategy.short)
barcolor(possig == -1 ? red: possig == 1 ? green : blue )
plot(vS1, color=#ff0000, title="S1", style = circles, linewidth = 1)
plot(vR1, color=#009600, title="R1", style = circles, linewidth = 1)