Chiến lược dừng lỗ theo đường trung bình động kép
Tổng quan
Chiến lược này dựa trên sự giao thoa của đường trung bình nhanh và đường trung bình chậm để quyết định tháo lỗ nhiều hơn. Khi đường trung bình nhanh vượt qua đường trung bình chậm trên đường trung bình nhanh, và khi đường trung bình nhanh vượt qua đường trung bình chậm dưới đường trung bình chậm. Để theo đuổi lợi nhuận cao hơn, chiến lược này sử dụng cơ chế dừng lỗ theo dõi. Sau khi tháo lỗ, thay vì đặt giá dừng lỗ trực tiếp bên dưới giá giao dịch, nó sẽ thiết lập một giá dừng lỗ theo dõi bên dưới giá giao dịch.
Nguyên tắc chiến lược
Chiến lược này sử dụng trung bình di chuyển đơn giản nhanh (SMA) và SMA chậm để quyết định thời gian để thực hiện nhiều vị trí yên bình. Khi SMA nhanh vượt qua SMA chậm, hãy đánh giá xu hướng biến đổi lên và làm nhiều hơn; khi SMA nhanh vượt qua SMA chậm, hãy đánh giá xu hướng đảo ngược và chuẩn bị vị trí bằng phẳng.
Để theo đuổi lợi nhuận cao hơn, chiến lược này đã giới thiệu cơ chế dừng chân theo dõi. Sau khi thực hiện quá nhiều, thay vì thiết lập lệnh dừng lỗ ở mức giá cố định, nó sẽ thiết lập một giá dừng chân theo dõi, nó sẽ theo dõi lên khi giá tăng, sau mỗi lần giá tăng một tỷ lệ nhất định, giá dừng chân theo dõi sẽ điều chỉnh lên một mức độ nhất định. Khi giá quay trở lại, chạm vào giá dừng chân theo dõi, sẽ kích hoạt lệnh dừng lỗ và dập tắt vị trí.
Cụ thể, công thức tính toán để theo dõi giá dừng là:
Tracking Stop Loss Price = Price × (1 - Tracking Stop Loss Percentage)
Trong đó, phần trăm theo dõi dừng lỗ được thiết lập bởi hàm tham số chiến lược Deviation %. Chiến lược sẽ tính giá dừng chân theo dõi mới mỗi khi K-line đóng cửa sau khi mở vị trí. Giá dừng chân theo dõi mới không thể thấp hơn giá dừng chân theo dõi của K-line trước, để đảm bảo giá dừng chân chỉ có thể di chuyển lên, không thể quay trở lại.
Khi giá giảm, chạm vào giá dừng theo dõi, sẽ kích hoạt tín hiệu thanh toán, vị trí sẽ sử dụng giá thị trường đơn giản thanh toán.
Lợi thế chiến lược
- Sử dụng đường hai chiều để đánh giá xu hướng, đo lại hiệu quả tốt hơn
- Theo dõi lỗ hổng để theo đuổi lợi nhuận cao hơn
- Có thể tùy chỉnh chu kỳ trung bình và stop loss theo dõi
- Trong một xu hướng tăng, đường dừng sẽ di chuyển lên, đảm bảo phần lớn lợi nhuận
- Có thể dừng lại nhanh chóng để tránh tổn thất lớn hơn khi xu hướng đảo ngược
Rủi ro và giải pháp
- Thời điểm giao nhau của đường trung bình không được chọn đúng, có thể gây ra tín hiệu ảo. Các tham số khác nhau có thể được thử nghiệm để tìm kết hợp đường trung bình tốt nhất
- Theo dõi stop loss quá cấp tiến, có thể gây ra stop loss bị phá vỡ quá sớm. Bạn có thể điều chỉnh theo dõi stop loss phần trăm tham số thích hợp
- Các chỉ số khác nên được kết hợp để đánh giá xu hướng và tránh giao dịch trong tình trạng biến động
Hướng tối ưu hóa
- Có thể thử nghiệm các tham số khác nhau của chu kỳ trung bình để tìm ra sự kết hợp tham số tốt nhất
- Có thể thử nghiệm các tham số theo dõi phần trăm dừng khác nhau để tìm mức dừng tối ưu
- Có thể kết hợp các chỉ số khác để đánh giá, tạm dừng giao dịch trong tình huống chấn động, tránh bị ảnh hưởng bởi sự kiện bất ngờ
Tóm tắt
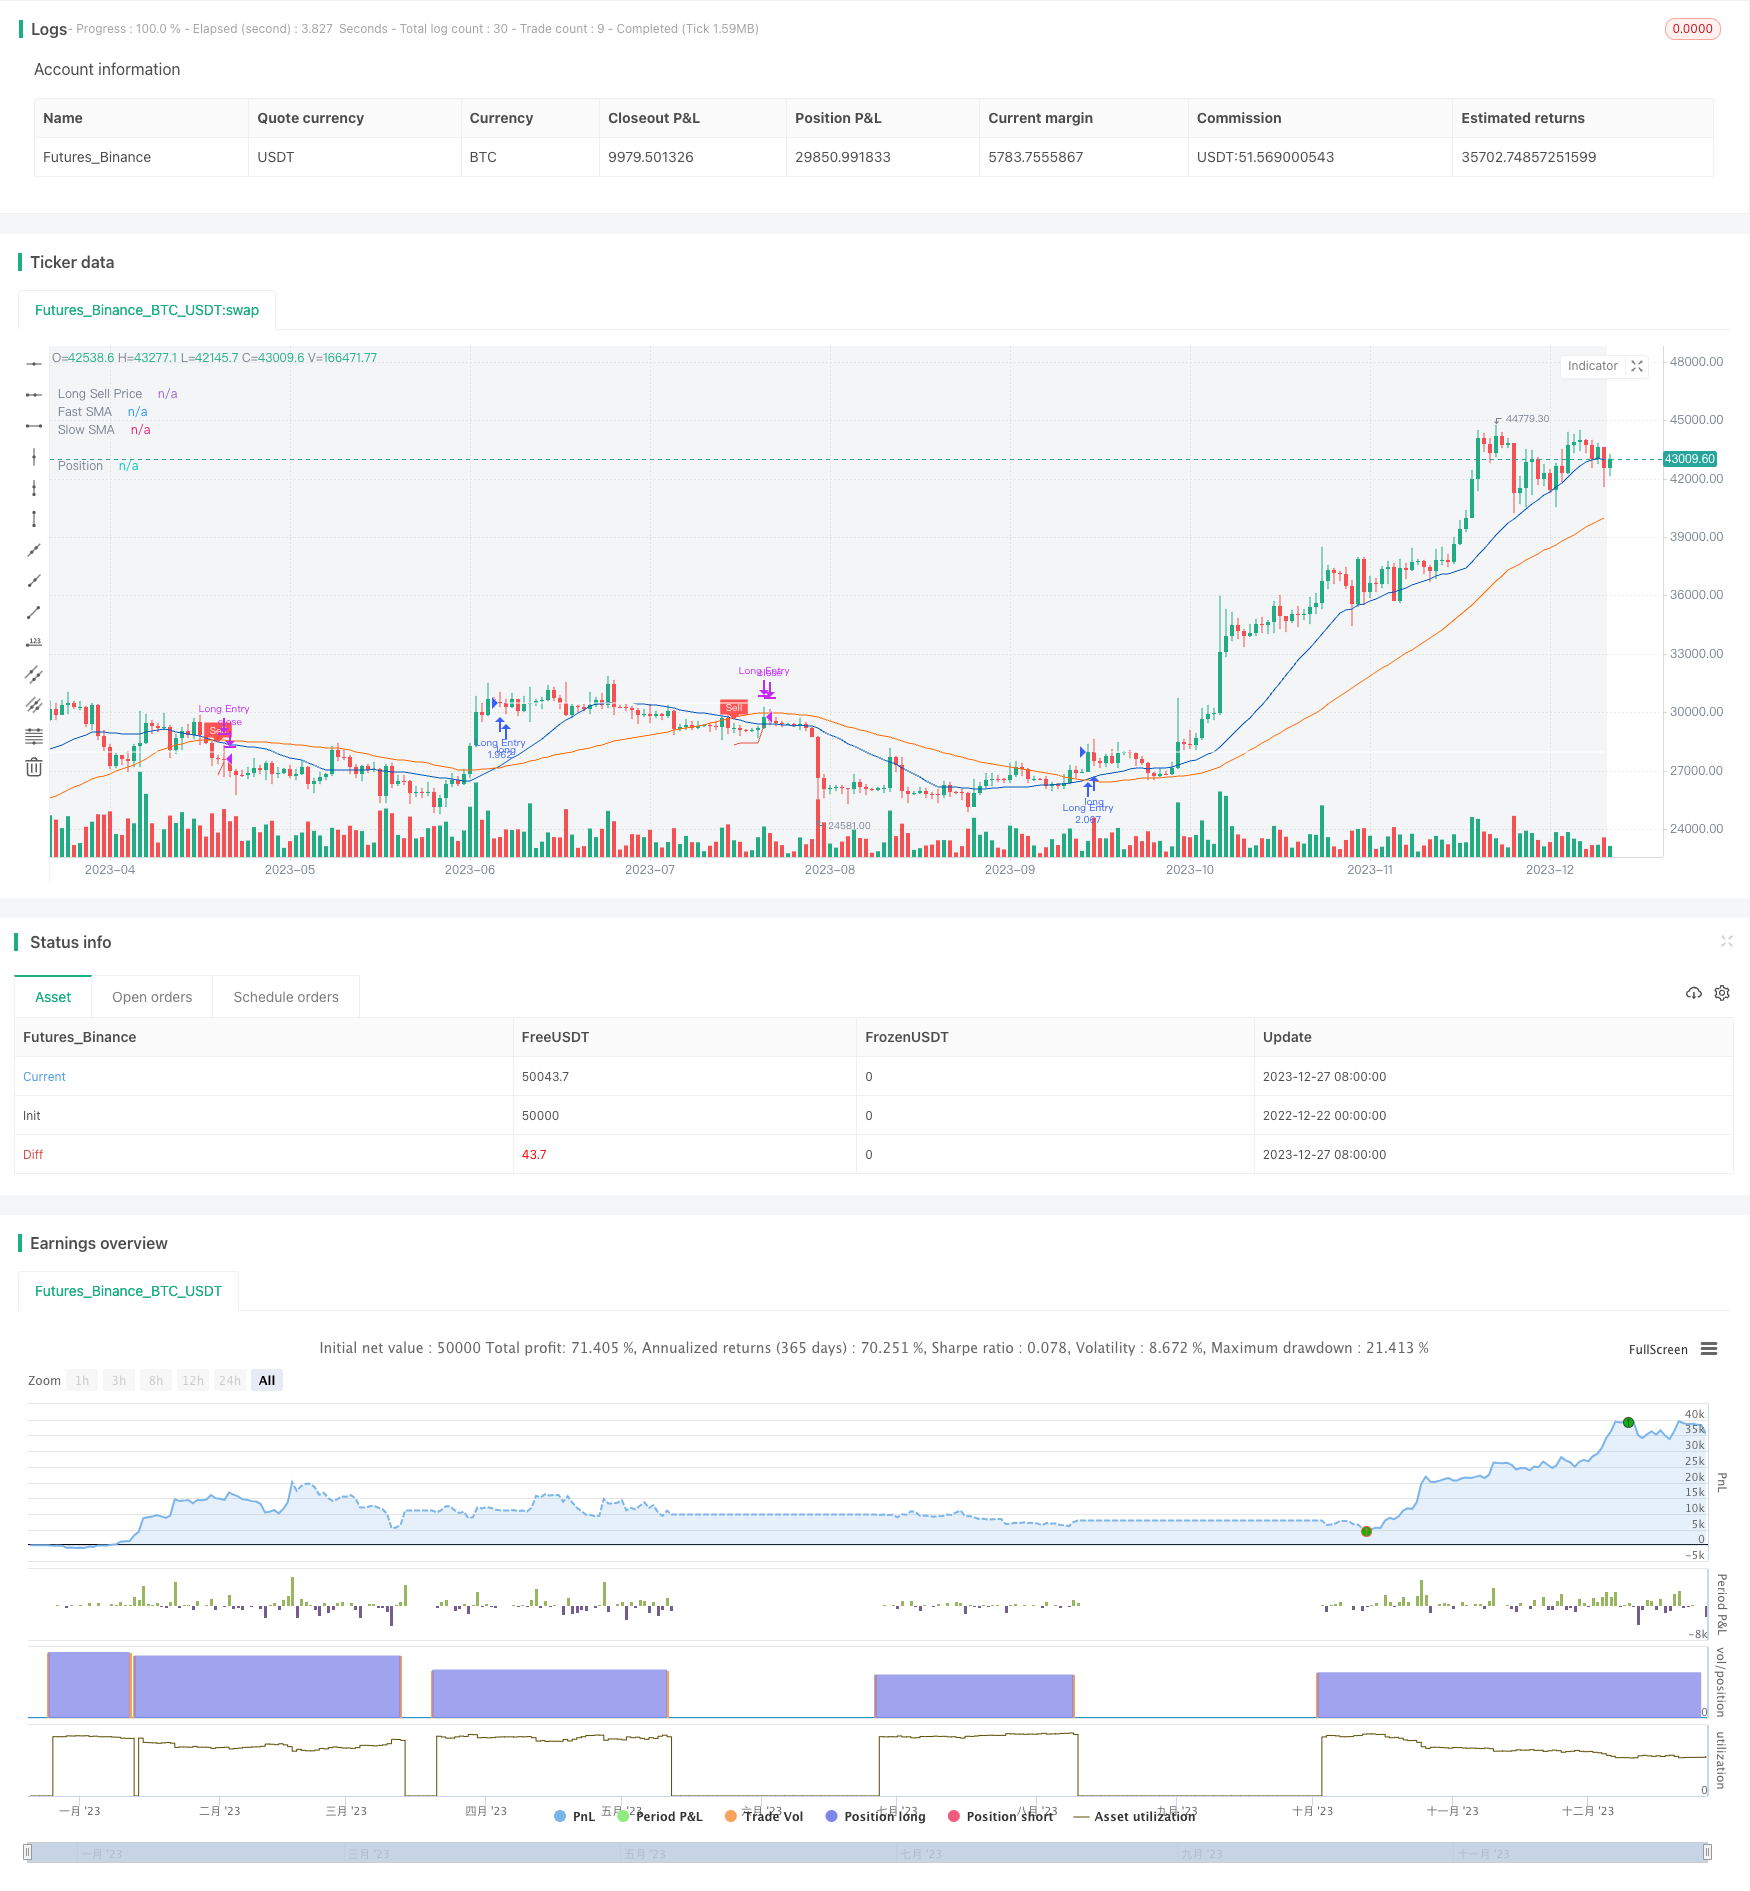
Chiến lược này kết hợp sử dụng chỉ số đường trung bình để xác định hướng xu hướng, và theo dõi cơ chế dừng lỗ để khóa lợi nhuận, hoạt động tốt trong dữ liệu đào tạo. Bằng cách tối ưu hóa các tham số, kiểm soát rủi ro, hy vọng sẽ có được thu nhập ổn định. Tuy nhiên, không có chiến lược nào có thể tránh hoàn toàn thua lỗ, khuyến nghị quản lý vị trí cân bằng thích hợp, thử nghiệm các giống khác nhau, phân tán rủi ro.
/*backtest
start: 2022-12-22 00:00:00
end: 2023-12-28 00:00:00
period: 1d
basePeriod: 1h
exchanges: [{"eid":"Futures_Binance","currency":"BTC_USDT"}]
*/

//@version=5
//
// ▒▒▒▒▒▒▒▒▒▒▒▒▒▒▒▒▒▒▒▒▒▒▒▒▒▒▒▒▒▒▒▒▒▒▒▒▒▒▒▒▒▒▒▒▒▒▒▒▒▒▒▒▒▒▒▒▒▒▒▒▒▒▒▒▒▒▒▒▒▒▒▒▒▒▒▒▒▒▒▒▒▒▒▒▒▒▒▒▒▒▒▒▒▒▒▒▒▒▒▒▒▒▒▒▒▒▒▒▒▒▒▒▒▒
//  -----------------------------------------------------------------------------
//  Copyright 2022 Iason Nikolas | jason5480
//  Trailing Buy script may be freely distributed under the MIT license.
//
//  Permission is hereby granted, free of charge,
//  to any person obtaining a copy of this software and associated documentation files (the "Software"),
//  to deal in the Software without restriction, including without limitation the rights to use, copy, modify, merge,
//  publish, distribute, sublicense, and/or sell copies of the Software, and to permit persons to whom the Software is furnished to do so,
//  subject to the following conditions:
//
//  The above copyright notice and this permission notice shall be included in all copies or substantial portions of the Software.
//
//  THE SOFTWARE IS PROVIDED "AS IS", WITHOUT WARRANTY OF ANY KIND,
//  EXPRESS OR IMPLIED, INCLUDING BUT NOT LIMITED TO THE WARRANTIES OF MERCHANTABILITY,
//  FITNESS FOR A PARTICULAR PURPOSE AND NONINFRINGEMENT. IN NO EVENT SHALL THE AUTHORS OR COPYRIGHT HOLDERS BE LIABLE FOR ANY CLAIM,
//  DAMAGES OR OTHER LIABILITY, WHETHER IN AN ACTION OF CONTRACT, TORT OR OTHERWISE, ARISING FROM,
//  OUT OF OR IN CONNECTION WITH THE SOFTWARE OR THE USE OR OTHER DEALINGS IN THE SOFTWARE.
//
//  -----------------------------------------------------------------------------
//
//  Authors:  @jason5480
//  Revision: v1.0.1
//  Date:     24-Feb-2022
//
//  Description
//  =============================================================================
//  This strategy will go long if fast MA crosses over slow MA.
//  If the 'Enable Trailing` is checked then the strategy instead of exiting from the position
//  directly it will follow the price upwards (percentagewise) with small steps
//  If the price drops by this percentage then the exit order will be executed
//
//  The strategy has the following parameters:
//
//  Fast SMA Length - How many candles back to calculte the fast SMA.
//  Slow SMA Length - How many candles back to calculte the slow SMA.
//  Enable Trailing - Enable or disable the trailing
//  Deviation % - The step to follow the price when the open position condition is met.
//  Source Exit Control - The source price to compare with the exit price to trigger the exit order when trailing.
//
//  -----------------------------------------------------------------------------
//  Disclaimer:
//    1. I am not licensed financial advisors or broker dealer. I do not tell you
//       when or what to buy or sell. I developed this software which enables you
//       execute manual or automated using TradingView. The
//       software allows you to set the criteria you want for entering and exiting
//       trades.
//    2. Do not trade with money you cannot afford to lose.
//    3. I do not guarantee consistent profits or that anyone can make money with no
//       effort. And I am not selling the holy grail.
//    4. Every system can have winning and losing streaks.
//    5. Money management plays a large role in the results of your trading. For
//       example: lot size, account size, broker leverage, and broker margin call
//       rules all have an effect on results. Also, your Take Profit and Stop Loss
//       settings for individual pair trades and for overall account equity have a
//       major impact on results. If you are new to trading and do not understand
//       these items, then I recommend you seek education materials to further your
//       knowledge.
//
//    YOU NEED TO FIND AND USE THE TRADING SYSTEM THAT WORKS BEST FOR YOU AND YOUR
//    TRADING TOLERANCE.
//
//    I HAVE PROVIDED NOTHING MORE THAN A TOOL WITH OPTIONS FOR YOU TO TRADE WITH THIS PROGRAM ON TRADINGVIEW.
//
//    I accept suggestions to improve the script.
//    If you encounter any problems I will be happy to share with me.
//  -----------------------------------------------------------------------------
//
// ▒▒▒▒▒▒▒▒▒▒▒▒▒▒▒▒▒▒▒▒▒▒▒▒▒▒▒▒▒▒▒▒▒▒▒▒▒▒▒▒▒▒▒▒▒▒▒▒▒▒▒▒▒▒▒▒▒▒▒▒▒▒▒▒▒▒▒▒▒▒▒▒▒▒▒▒▒▒▒▒▒▒▒▒▒▒▒▒▒▒▒▒▒▒▒▒▒▒▒▒▒▒▒▒▒▒▒▒▒▒▒▒▒▒
// SETUP ============================================================================================================

strategy(title = 'Trailing Sell',
         shorttitle = 'TS',
         overlay = true,
         pyramiding = 0,
         default_qty_type = strategy.percent_of_equity,
         default_qty_value = 100,
         initial_capital = 100000)

//
// ▒▒▒▒▒▒▒▒▒▒▒▒▒▒▒▒▒▒▒▒▒▒▒▒▒▒▒▒▒▒▒▒▒▒▒▒▒▒▒▒▒▒▒▒▒▒▒▒▒▒▒▒▒▒▒▒▒▒▒▒▒▒▒▒▒▒▒▒▒▒▒▒▒▒▒▒▒▒▒▒▒▒▒▒▒▒▒▒▒▒▒▒▒▒▒▒▒▒▒▒▒▒▒▒▒▒▒▒▒▒▒▒▒▒
// FILTERS ==========================================================================================================

// INPUT ============================================================================================================
usefromDate = input.bool(defval = true, title = 'From', inline = "From Date", group = "Filters")
fromDate = input(defval = timestamp('01 Jan 2021 00:00 UTC'), title = '', inline = "From Date", group = 'Filters')
usetoDate = input.bool(defval = false, title = 'To ', inline = "To Date", group = "Filters")
toDate = input(defval = timestamp('31 Dec 2121 23:59 UTC'), title = '', inline = "To Date", group = 'Filters')

// LOGIC ============================================================================================================
isWithinPeriod() => true // create function "within window of time"

// PLOT =============================================================================================================
bgcolor(color = isWithinPeriod() ? color.new(color.gray, 90) : na, title = 'Period')

//
// ▒▒▒▒▒▒▒▒▒▒▒▒▒▒▒▒▒▒▒▒▒▒▒▒▒▒▒▒▒▒▒▒▒▒▒▒▒▒▒▒▒▒▒▒▒▒▒▒▒▒▒▒▒▒▒▒▒▒▒▒▒▒▒▒▒▒▒▒▒▒▒▒▒▒▒▒▒▒▒▒▒▒▒▒▒▒▒▒▒▒▒▒▒▒▒▒▒▒▒▒▒▒▒▒▒▒▒▒▒▒▒▒▒▒
// STRATEGY =========================================================================================================

// INPUT ============================================================================================================
fastMALen = input.int(defval = 21, title = 'Fast/Slow SMA Length', inline = 'MA Length', group = 'Strategy')
slowMALen = input.int(defval = 49, title = '', tooltip = 'How many candles back to calculte the fast/slow SMA.', inline = 'MA Length', group = 'Strategy')

// LOGIC ============================================================================================================
fastMA = ta.sma(close, fastMALen)
slowMA = ta.sma(close, slowMALen)

bool openLongPosition = isWithinPeriod() and ta.crossover(fastMA, slowMA)
bool closeLongPosition = ta.crossunder(fastMA, slowMA)

// PLOT =============================================================================================================
var fastColor = color.new(#0056BD, 0)
plot(series = fastMA, title = 'Fast SMA', color = fastColor, linewidth = 1, style = plot.style_line)
var slowColor = color.new(#FF6A00, 0)
plot(series = slowMA, title = 'Slow SMA', color = slowColor, linewidth = 1, style = plot.style_line)

plotshape(series = closeLongPosition and strategy.position_size > 0 ? fastMA : na, title = 'Sell', text = 'Sell', style = shape.labeldown, location = location.absolute, color = color.new(color.red, 0), textcolor = color.new(color.white, 0), size = size.tiny)

//
// ▒▒▒▒▒▒▒▒▒▒▒▒▒▒▒▒▒▒▒▒▒▒▒▒▒▒▒▒▒▒▒▒▒▒▒▒▒▒▒▒▒▒▒▒▒▒▒▒▒▒▒▒▒▒▒▒▒▒▒▒▒▒▒▒▒▒▒▒▒▒▒▒▒▒▒▒▒▒▒▒▒▒▒▒▒▒▒▒▒▒▒▒▒▒▒▒▒▒▒▒▒▒▒▒▒▒▒▒▒▒▒▒▒▒
// EXIT ============================================================================================================

// INPUT ============================================================================================================
enableTrailing = input.bool(defval = true, title = 'Enable Trailing', tooltip = 'Enable or disable the trailing for exit position.', group = 'Exit')
devExitPerc = input.float(defval = 3.0, title = 'Deviation %', minval = 0.01, maxval = 100, step = 0.05, tooltip = 'The step to follow the price when the open position condition is met.', group = 'Exit') / 100
ctrLongExitSrc = input.source(defval = low, title = 'Source Exit Control', tooltip = 'The source price to compare with the exit price to trigger the exit order when trailing.', group = 'Exit')

// LOGIC ============================================================================================================
var bool exitLongPosition = false

int barsSinceOpenLong = nz(ta.barssince(openLongPosition), 999999)
int barsSinceCloseLong = nz(ta.barssince(closeLongPosition), 999999)
int barsSinceExitLong = nz(ta.barssince(exitLongPosition), 999999)
bool closeLongIsActive = barsSinceOpenLong >= barsSinceCloseLong
bool exitLongIsPending = barsSinceExitLong >= barsSinceCloseLong
bool tryExitLongPosition = isWithinPeriod() and closeLongIsActive and exitLongIsPending

float longExitPrice = na
longExitPrice := if closeLongPosition and strategy.position_size > 0
    close * (1 - devExitPerc)
else if tryExitLongPosition
    math.max(high * (1 - devExitPerc), nz(longExitPrice[1], 999999))
else
    na

exitLongPosition := enableTrailing ? isWithinPeriod() and ta.crossunder(closeLongPosition ? close : ctrLongExitSrc, longExitPrice) : closeLongPosition

// PLOT =============================================================================================================
var sellPriceColor = color.new(#e25141, 0)
plot(series = enableTrailing ? longExitPrice : na, title = 'Long Sell Price', color = sellPriceColor, linewidth = 1, style = plot.style_linebr)

//
// ▒▒▒▒▒▒▒▒▒▒▒▒▒▒▒▒▒▒▒▒▒▒▒▒▒▒▒▒▒▒▒▒▒▒▒▒▒▒▒▒▒▒▒▒▒▒▒▒▒▒▒▒▒▒▒▒▒▒▒▒▒▒▒▒▒▒▒▒▒▒▒▒▒▒▒▒▒▒▒▒▒▒▒▒▒▒▒▒▒▒▒▒▒▒▒▒▒▒▒▒▒▒▒▒▒▒▒▒▒▒▒▒▒▒
// POSITION ORDERS ==================================================================================================

// LOGIC ============================================================================================================
// getting into LONG position
strategy.entry(id = 'Long Entry', direction = strategy.long, when = openLongPosition, alert_message = 'Long(' + syminfo.ticker + '): Started')
// submit close order on trend reversal
strategy.close(id = 'Long Entry', when = exitLongPosition, comment = 'Close Long', alert_message = 'Long(' + syminfo.ticker + '): Closed at market price')

// PLOT =============================================================================================================
var posColor = color.new(color.white, 0)
plot(series = strategy.position_avg_price, title = 'Position', color = posColor, linewidth = 1, style = plot.style_linebr)

// ==================================================================================================================