Chiến lược theo xu hướng tăng giá Golden Cross
Tổng quan
Chiến lược này được thiết kế dựa trên nguyên tắc chéo vàng của đường trung bình di chuyển. Cụ thể hơn, nó sử dụng đường trung bình di chuyển đơn giản của hai chu kỳ khác nhau, đường 50 chu kỳ và đường 200 chu kỳ. Khi đường 50 chu kỳ từ bên dưới phá vỡ đường 200 chu kỳ, tạo ra tín hiệu mua; Khi đường 50 chu kỳ từ phía trên phá vỡ đường 200 chu kỳ, tạo ra tín hiệu bán.
Nguyên tắc chiến lược
Chiến lược này được viết bằng ngôn ngữ Pine Script, và logic chính như sau:
- Tính toán hai SMA: 50 chu kỳ SMA và 200 chu kỳ SMA
- Xác định giao dịch vàng: làm nhiều hơn khi đeo SMA 200 trên SMA 50
- Xác định giao thoa chết: Hạ điểm khi giao thoa 200 vòng SMA dưới SMA 50 vòng
Tầm quan trọng của việc sử dụng chỉ số SMA ở đây là nó có thể loại bỏ tiếng ồn của dữ liệu thị trường một cách hiệu quả, Capture xu hướng dài hạn. Đường SMA nhanh xuyên qua đường SMA chậm, cho thấy động lực tăng ngắn hạn đã đánh bại xu hướng giảm dài hạn, và tạo ra tín hiệu mua.
Lợi thế chiến lược
Chiến lược này có một số lợi thế:
- Các nguyên tắc rất đơn giản, dễ hiểu và dễ thực hiện.
- PARAMETERS được thiết lập hợp lý, có thể tùy chỉnh hai chu kỳ SMA để phù hợp với thị trường khác nhau.
- Nó được viết bằng phiên bản ổn định của ngôn ngữ Pine và hoạt động hiệu quả.
- Các thiết lập trực quan rất thông tin và dễ sử dụng.
Rủi ro và giải pháp
Chiến lược này cũng có một số rủi ro:
Có thể xảy ra phá vỡ giả, khiến chiến lược tạo ra tín hiệu sai. Hai tham số SMA có thể được điều chỉnh thích hợp để giảm khả năng phá vỡ giả.
Không đáp ứng được thị trường ngắn hạn, chỉ phù hợp với các nhà đầu tư dài hạn.
Khả năng rút lui có thể lớn hơn. Có thể thiết lập điểm dừng lỗ hoặc điều chỉnh quản lý vị trí thích hợp.
Tối ưu hóa tư duy
Chiến lược này có thể được tối ưu hóa từ các khía cạnh sau:
Thêm bộ lọc cho các chỉ số khác, kết hợp nhiều điều kiện mua / bán, giảm khả năng tín hiệu giả.
Tăng cơ chế dừng lỗ. Cưỡng chế dừng lỗ khi giá giảm xuống một mức nhất định.
Tối ưu hóa quản lý vị trí. Ví dụ: tăng vị trí theo xu hướng, theo dõi dừng lỗ, v.v. Kiểm soát rút lui và theo đuổi lợi nhuận cao hơn.
Tối ưu hóa tham số. Đánh giá ảnh hưởng của các tham số khác nhau đối với tỷ lệ lợi nhuận / rủi ro.
Tóm tắt
Chiến lược này nói chung là một chiến lược theo dõi xu hướng điển hình. Nó sử dụng lợi thế của SMA, đơn giản và hiệu quả Capture xu hướng đường dài.
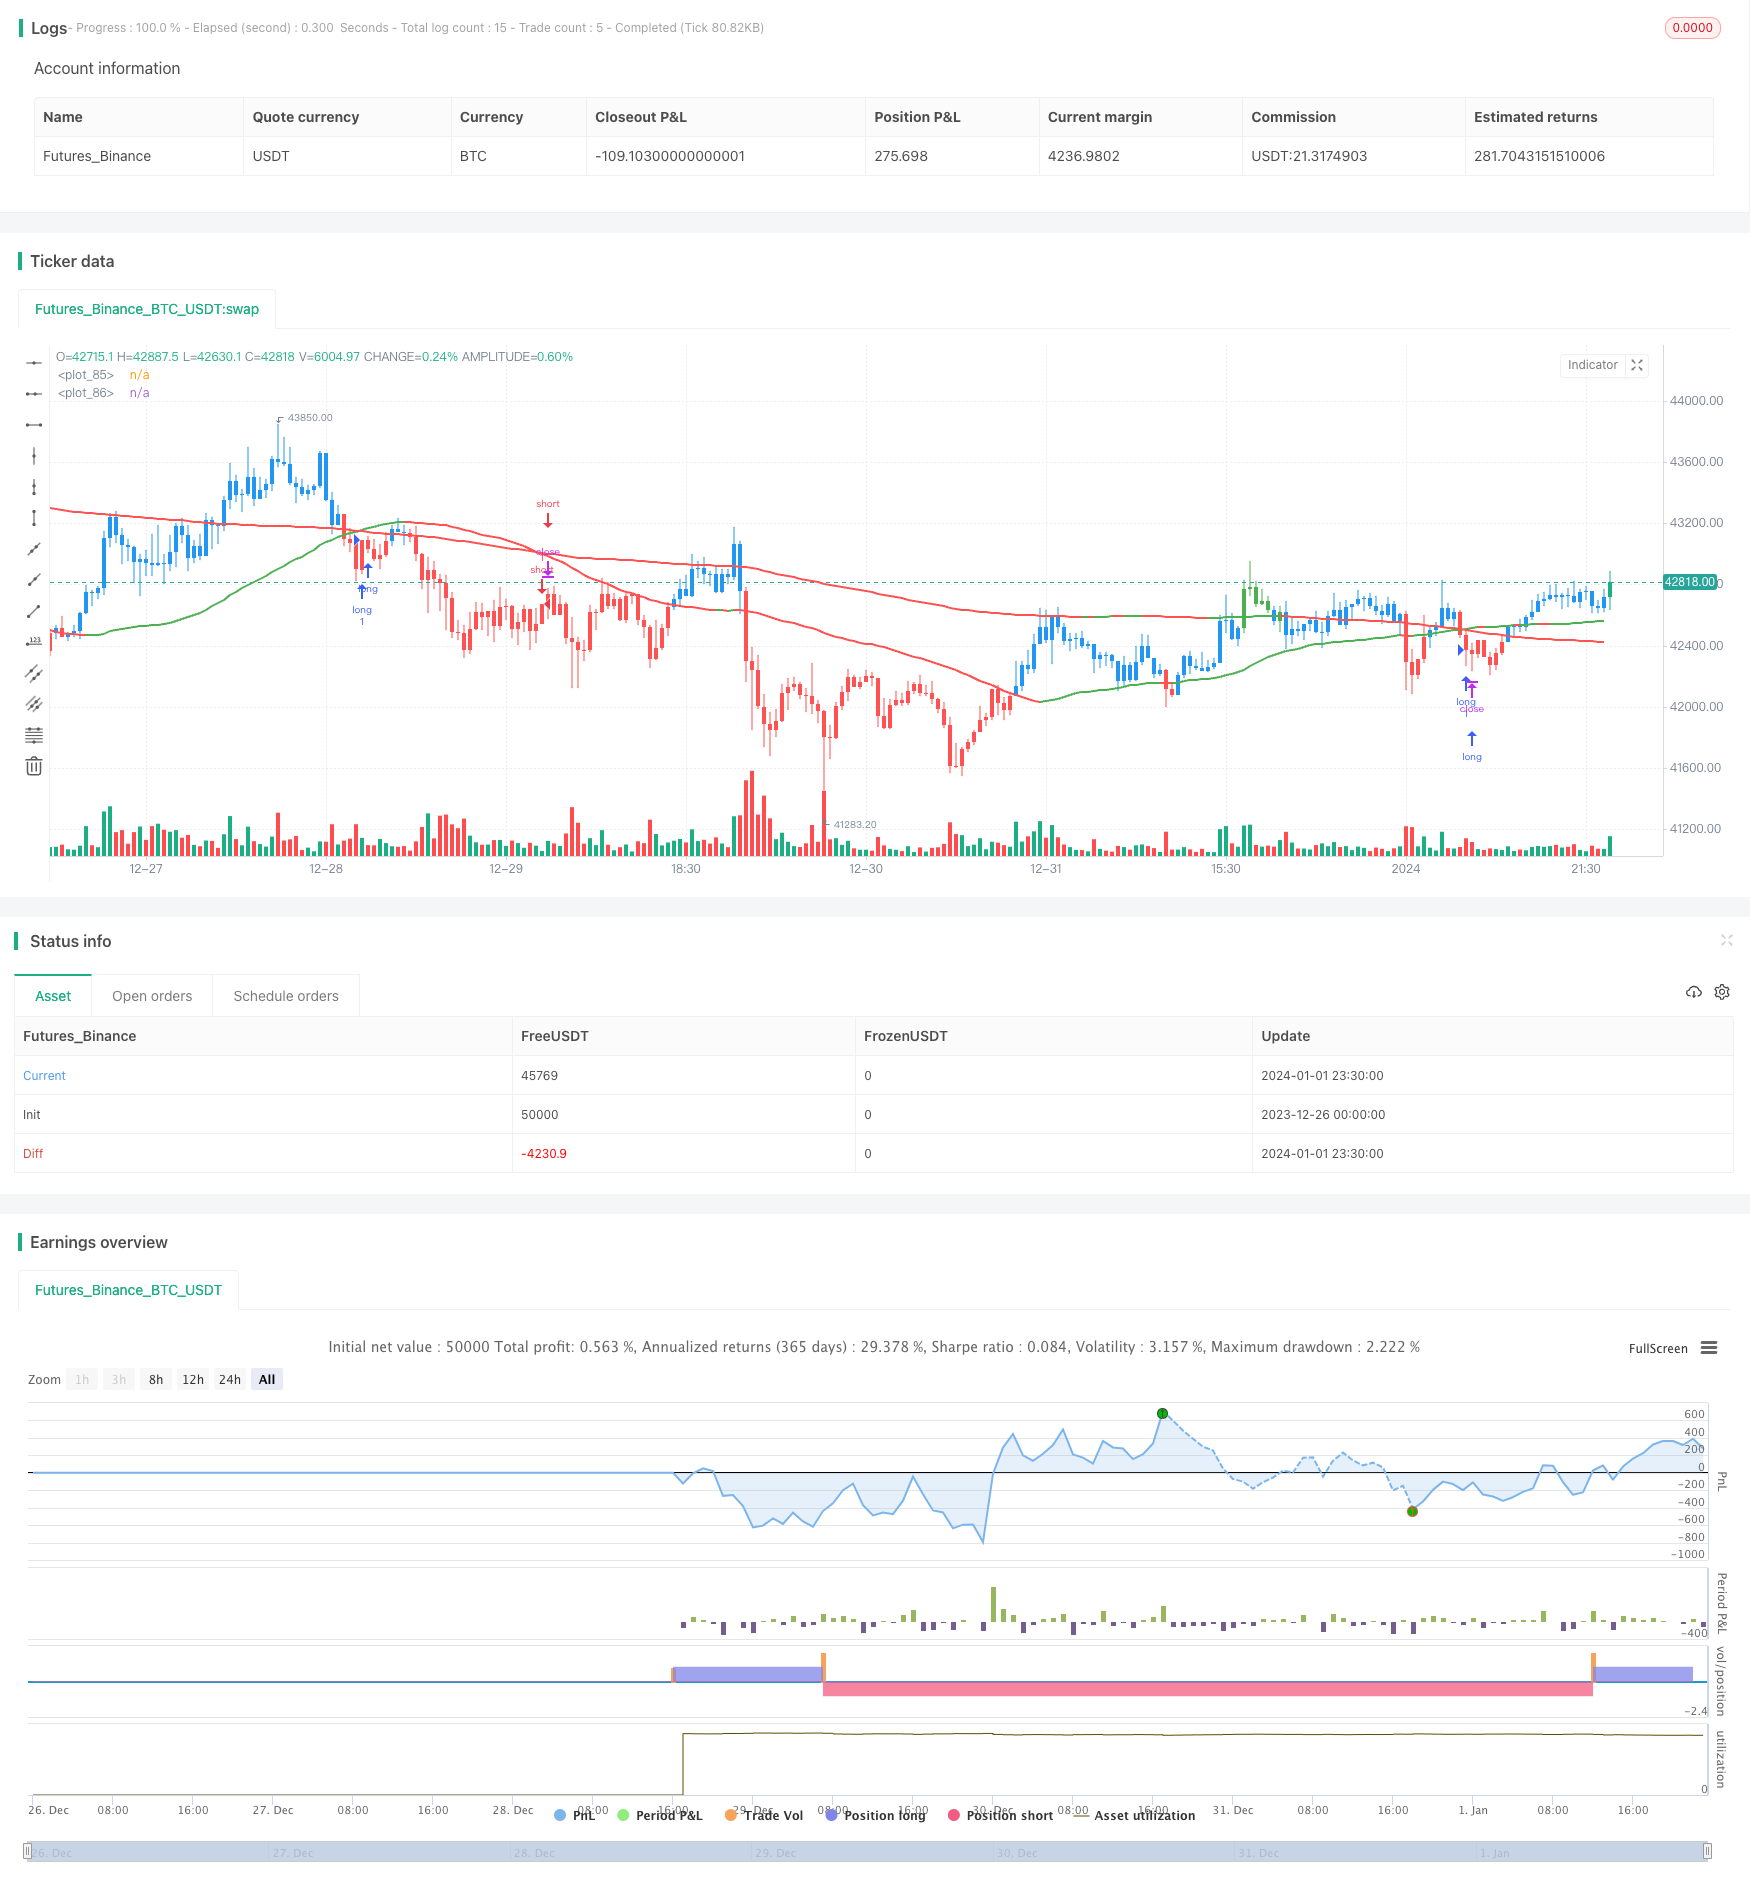
/*backtest
start: 2023-12-26 00:00:00
end: 2024-01-02 00:00:00
period: 30m
basePeriod: 15m
exchanges: [{"eid":"Futures_Binance","currency":"BTC_USDT"}]
*/

// @version=4
//
// This source code is subject to the terms of the Mozilla Public License 2.0 at https://mozilla.org/MPL/2.0/
// www.tradingview.com/u/TradeFab/
// www.tradefab.com
// ___  __        __   __  __       __
//  |  |__)  /\  |  \ |__ |__  /\  |__)
//  |  |  \ /~~\ |__/ |__ |   /~~\ |__)
//
// DISCLAIMER: Futures, stocks and options trading involves substantial risk of loss
// and is not suitable for every investor. You are responsible for all the risks and
// financial resources you use and for the chosen trading system.
// Past performance is not indicative for future results. In making an investment decision,
// traders must rely on their own examination of the entity making the trading decisions!
//
// TradeFab's Golden Cross Strategy.
// The strategy goes long when the faster SMA 50 (the simple moving average of the last 50 bars) crosses
// above the SMA 200. Orders are closed when the SMA 50 crosses below SMA 200. The strategy does not short.
//
VERSION = "1.2"
// 1.2 FB 2020-02-09 converted to Pine version 4
// 1.1 FB 2017-01-15 added short trading
// 1.0 FB 2017-01-13 basic version using SMAs
//
strategy(
   title        = "TFs Golden Cross " + VERSION,
   shorttitle   = "TFs Golden Cross " + VERSION,
   overlay      = true
   )


///////////////////////////////////////////////////////////
// === INPUTS ===
///////////////////////////////////////////////////////////
inFastSmaPeriod     = input(title="Fast SMA Period", type=input.integer, defval=50, minval=1)
inSlowSmaPeriod     = input(title="Slow SMA Period", type=input.integer, defval=200, minval=1)

// backtest period
testStartYear       = input(title="Backtest Start Year",    type=input.integer, defval=2019, minval=2000)
testStartMonth      = input(title="Backtest Start Month",   type=input.integer, defval=1, minval=1, maxval=12)
testStartDay        = input(title="Backtest Start Day",     type=input.integer, defval=1, minval=1, maxval=31)
testStopYear        = input(title="Backtest Stop Year",     type=input.integer, defval=2099, minval=2000)
testStopMonth       = input(title="Backtest Stop Month",    type=input.integer, defval=12, minval=1, maxval=12)
testStopDay         = input(title="Backtest Stop Day",      type=input.integer, defval=31, minval=1, maxval=31)


///////////////////////////////////////////////////////////
// === LOGIC ===
///////////////////////////////////////////////////////////
smaFast = sma(close, inFastSmaPeriod)
smaSlow = sma(close, inSlowSmaPeriod)

bullishCross = crossover (smaFast, smaSlow)
bearishCross = crossunder(smaFast, smaSlow)

// detect valid backtest period
isTestPeriod() => true


///////////////////////////////////////////////////////////
// === POSITION EXECUTION ===
///////////////////////////////////////////////////////////
strategy.entry("long",  strategy.long,  when=bullishCross)
strategy.entry("short", strategy.short, when=bearishCross)


///////////////////////////////////////////////////////////
// === PLOTTING ===
///////////////////////////////////////////////////////////
// background color
nopColor = color.new(color.gray, 50)
bgcolor(not isTestPeriod() ? nopColor : na)

bartrendcolor =
   close > smaFast and
   close > smaSlow and
   change(smaSlow) > 0
       ? color.green
       : close < smaFast and
         close < smaSlow and
         change(smaSlow) < 0
             ? color.red
             : color.blue
barcolor(bartrendcolor)
plot(smaFast, color=change(smaFast) > 0 ? color.green : color.red, linewidth=2)
plot(smaSlow, color=change(smaSlow) > 0 ? color.green : color.red, linewidth=2)

// label
posColor = color.new(color.green, 75)
negColor = color.new(color.red, 75)
dftColor = color.new(color.blue, 75)
posProfit= (strategy.position_size != 0) ? (close * 100 / strategy.position_avg_price - 100) : 0.0
posDir   = (strategy.position_size  > 0) ? "long" : strategy.position_size < 0 ? "short" : "flat"
posCol   = (posProfit > 0) ? posColor : (posProfit < 0) ? negColor : dftColor

var label lb = na
label.delete(lb)
lb := label.new(bar_index, max(high, highest(5)[1]),
   color=posCol,
   text="Pos: "+ posDir +
      "\nPnL: "+tostring(posProfit, "#.##")+"%" +
      "\nClose: "+tostring(close, "#.##"))