Chiến lược theo dõi định lượng thị trường tăng giá
Tổng quan
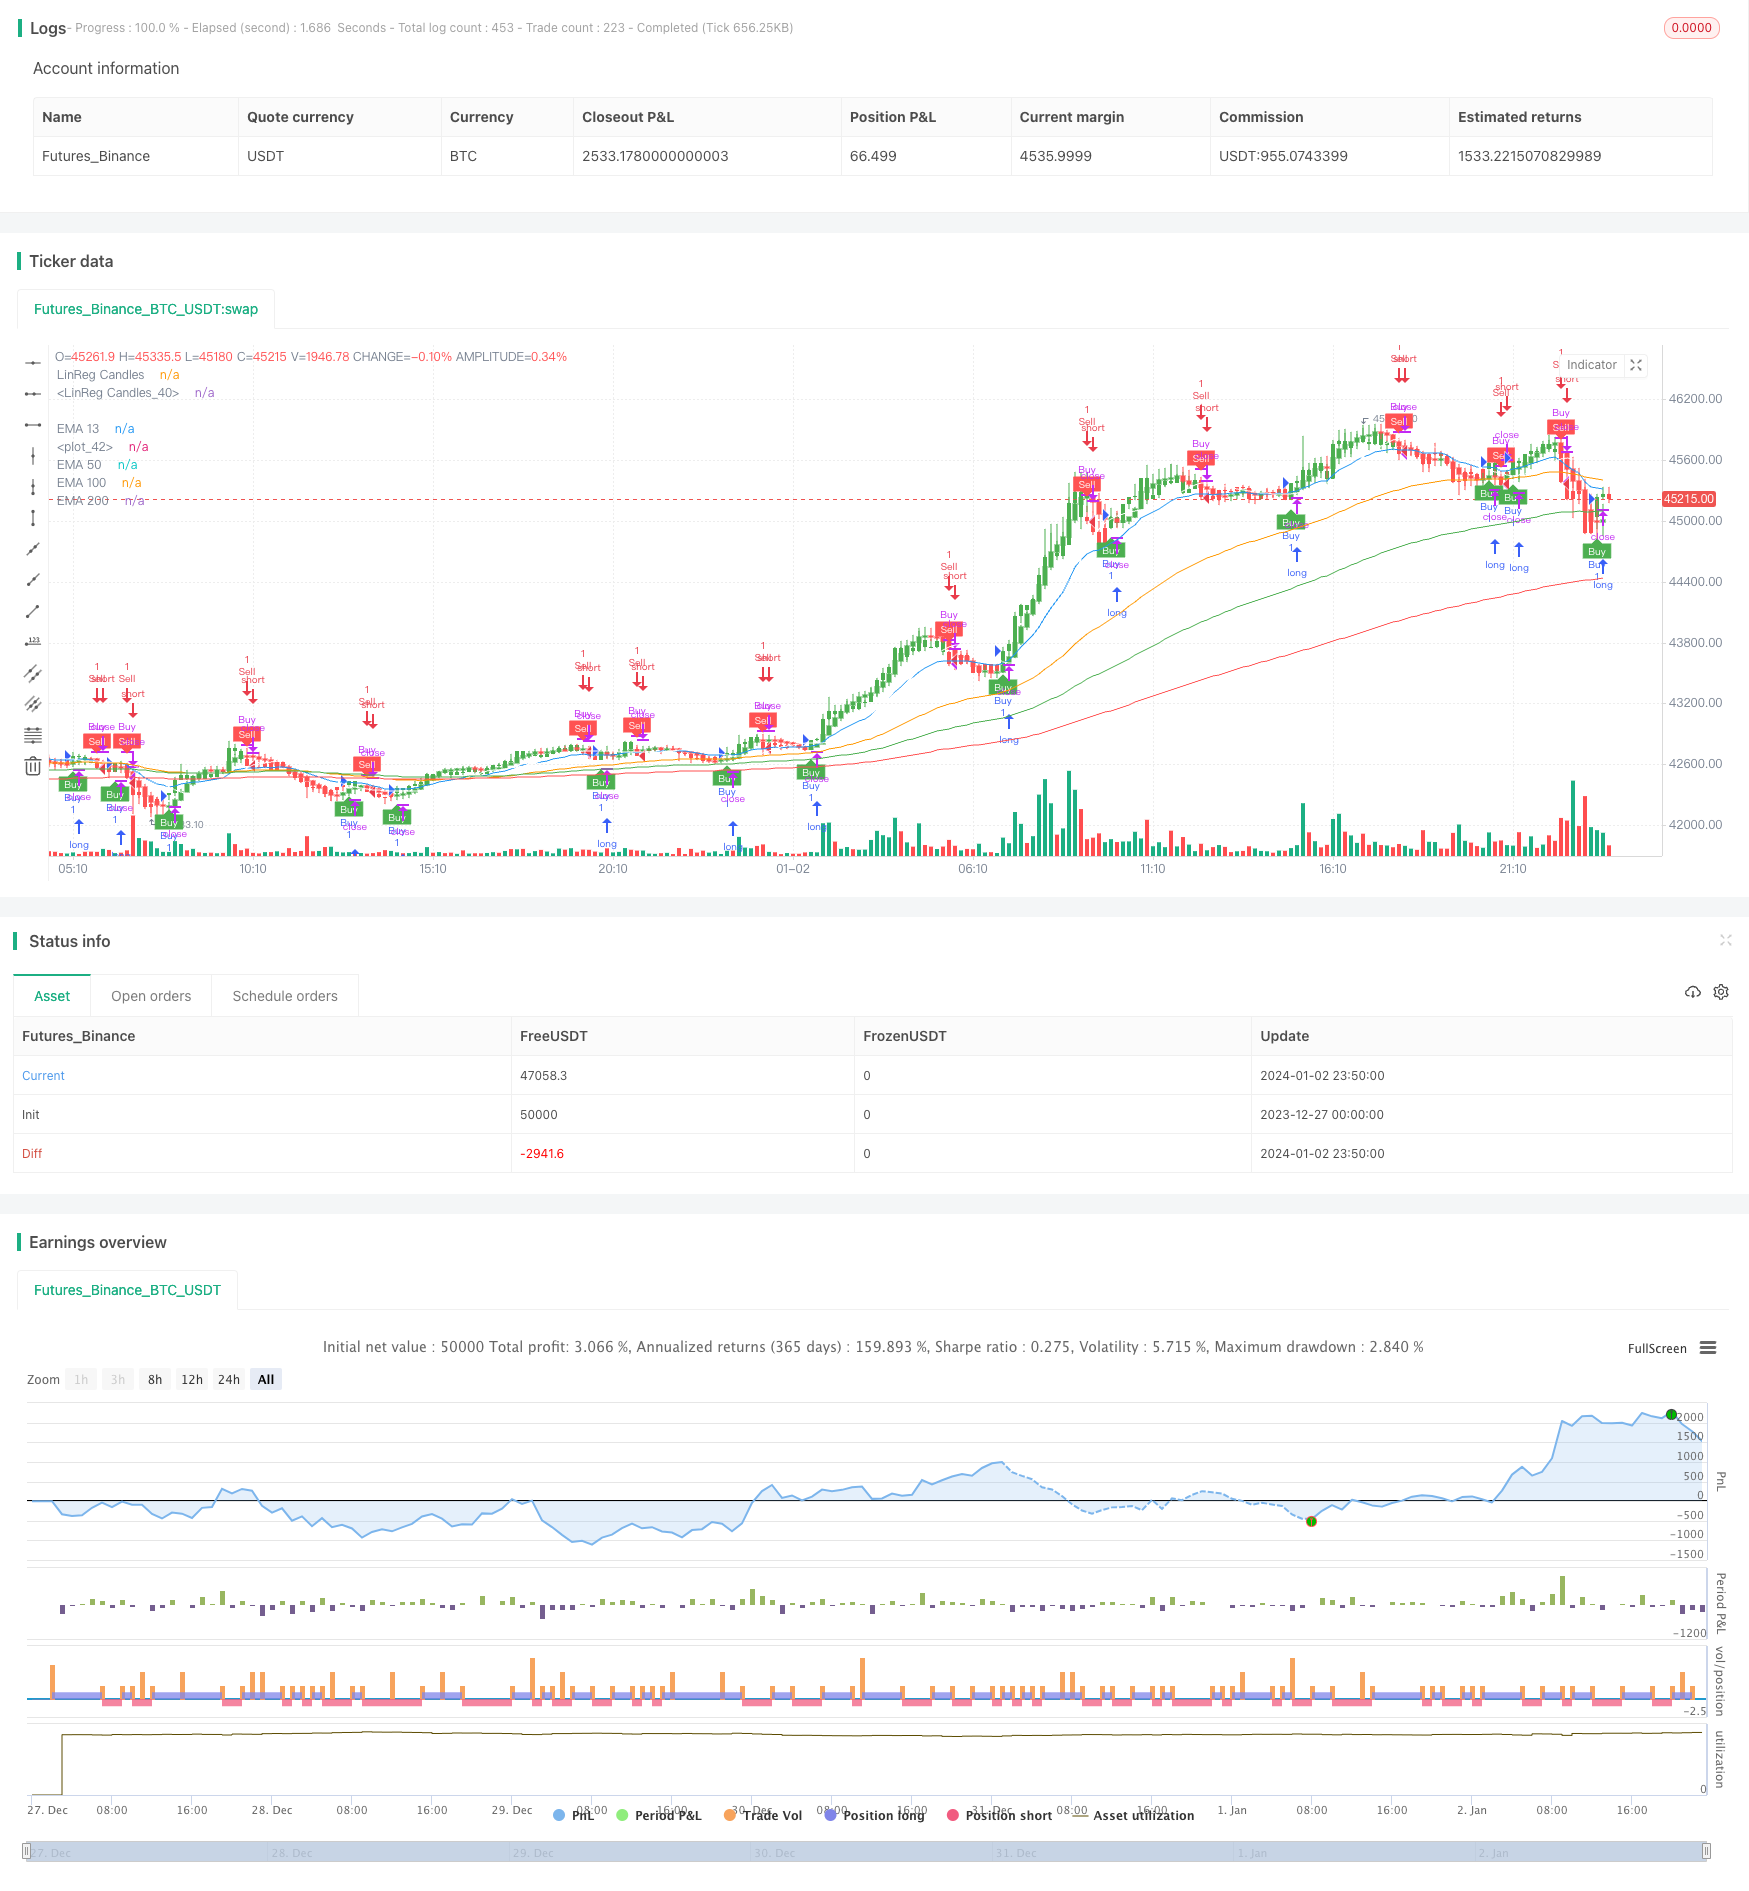
Chiến lược theo dõi thị trường bò định lượng là một chiến lược theo dõi xu hướng dựa trên đường trung bình EMA và điểm dừng ATR. Nó sử dụng đường trung bình EMA để xác định hướng của xu hướng lớn, sử dụng điểm dừng động theo dõi ATR để khóa lợi nhuận theo xu hướng và tối đa hóa lợi nhuận.
Nguyên tắc chiến lược
Chiến lược này bao gồm:
- EMA đánh giá xu hướng chính
Sử dụng đường 13, đường 50 và đường 100 để tạo ra một quan điểm đa không gian để đánh giá xu hướng chính.
- ATR dừng động
Sử dụng chỉ số ATR để tính toán phạm vi biến động giá trong chu kỳ này, để thiết lập điểm dừng lỗ và thực hiện dừng lỗ.
- Tín hiệu mịn.
Đơn giản hóa SMA của một chu kỳ nhất định cho giá đóng cửa đường K, tránh tín hiệu sai.
- Tín hiệu đa không gian
Khi giá vượt qua đường trung bình EMA, hãy làm nhiều, khi vượt qua đường trung bình EMA, hãy làm trống.
Phân tích lợi thế
Chiến lược này có những ưu điểm sau:
- Kiểm soát rút lui là tuyệt vời, có thể kiểm soát rút lui tối đa trong vòng 160%.
- Theo dõi dừng lỗ thông minh hơn so với dừng cố định và có thể khóa nhiều xu hướng hơn.
- Sử dụng EMA để đánh giá xu hướng chính, tránh hoạt động đảo ngược.
- Dòng K mịn, có thể lọc tín hiệu giả, tăng tỷ lệ thắng.
Phân tích rủi ro
Chiến lược này cũng có những rủi ro:
- Cài đặt tham số cố định có thể không phù hợp với các giống khác nhau và cần được tối ưu hóa.
- Trong trường hợp bị chấn động, có thể xảy ra nhảy vọt.
- Cần hỗ trợ ổn định máy chủ để tránh bị mất tín hiệu.
Các biện pháp có thể được sử dụng để giảm thiểu các rủi ro trên bằng các phương pháp như tối ưu hóa tham số, kiểm tra thích ứng.
Hướng tối ưu hóa
Chiến lược này có thể được tối ưu hóa theo các hướng sau:
- Sử dụng thuật toán học máy để tự động tối ưu hóa các tham số.
- Tăng cơ chế tự điều chỉnh để giảm tổn thất, điều chỉnh theo tình hình thị trường
- Tăng các điều kiện lọc tổng hợp, tăng sự ổn định của chiến lược.
- Cân nhắc thử nghiệm đa giống để cải thiện khả năng thích ứng của chiến lược.
Tóm tắt
Chiến lược này nói chung là một chiến lược định lượng dựa trên thiết kế theo dõi xu hướng. Nó sử dụng EMA để xác định hướng xu hướng, đồng thời sử dụng ATR để dừng lỗ thông minh. Có thể kiểm soát hiệu quả việc rút lui và thu lợi nhuận xu hướng.
/*backtest
start: 2023-12-27 00:00:00
end: 2024-01-03 00:00:00
period: 10m
basePeriod: 1m
exchanges: [{"eid":"Futures_Binance","currency":"BTC_USDT"}]
*/

//@version=4
strategy("Combined Strategy", overlay=true)

// Input variables for EMA Crossover
ema13_length = input(13, title="EMA 13 Length")
ema50_length = input(50, title="EMA 50 Length")
ema100_length = input(100, title="EMA 100 Length")
ema200_length = input(200, title="EMA 200 Length")

// Calculate EMAs for EMA Crossover
ema13 = ema(close, ema13_length)
ema50 = ema(close, ema50_length)
ema100 = ema(close, ema100_length)
ema200 = ema(close, ema200_length)

// Plot EMAs for EMA Crossover
plot(ema13, color=color.blue, title="EMA 13")
plot(ema50, color=color.orange, title="EMA 50")
plot(ema100, color=color.green, title="EMA 100")
plot(ema200, color=color.red, title="EMA 200")

// Input variables for LinReg Candles
signal_length = input(title="Signal Smoothing", type=input.integer, minval=1, maxval=200, defval=11)
sma_signal = input(title="Simple MA (Signal Line)", type=input.bool, defval=true)

lin_reg = input(title="Lin Reg", type=input.bool, defval=true)
linreg_length = input(title="Linear Regression Length", type=input.integer, minval=1, maxval=200, defval=11)

// Calculate LinReg Candles
bopen = lin_reg ? linreg(open, linreg_length, 0) : open
bhigh = lin_reg ? linreg(high, linreg_length, 0) : high
blow = lin_reg ? linreg(low, linreg_length, 0) : low
bclose = lin_reg ? linreg(close, linreg_length, 0) : close

r = bopen < bclose

signal = sma_signal ? sma(bclose, signal_length) : ema(bclose, signal_length)

plotcandle(r ? bopen : na, r ? bhigh : na, r ? blow: na, r ? bclose : na, title="LinReg Candles", color=color.green, wickcolor=color.green, bordercolor=color.green, editable=true)
plotcandle(r ? na : bopen, r ? na : bhigh, r ? na : blow, r ? na : bclose, title="LinReg Candles", color=color.red, wickcolor=color.red, bordercolor=color.red, editable=true)

plot(signal, color=color.white)

// Input variables for UT Bot Alerts
a = input(1, title="Key Value. 'This changes the sensitivity'")
c = input(10, title="ATR Period")
h = input(false, title="Signals from Heikin Ashi Candles")

// Calculate UT Bot Alerts
xATR = atr(c)
nLoss = a * xATR

src = h ? security(heikinashi(syminfo.tickerid), timeframe.period, close, lookahead=false) : close

xATRTrailingStop = 0.0
xATRTrailingStop := iff(src > nz(xATRTrailingStop[1], 0) and src[1] > nz(xATRTrailingStop[1], 0), max(nz(xATRTrailingStop[1]), src - nLoss),
   iff(src < nz(xATRTrailingStop[1], 0) and src[1] < nz(xATRTrailingStop[1], 0), min(nz(xATRTrailingStop[1]), src + nLoss),
   iff(src > nz(xATRTrailingStop[1], 0), src - nLoss, src + nLoss)))

pos = 0
pos := iff(src[1] < nz(xATRTrailingStop[1], 0) and src > nz(xATRTrailingStop[1], 0), 1,
   iff(src[1] > nz(xATRTrailingStop[1], 0) and src < nz(xATRTrailingStop[1], 0), -1, nz(pos[1], 0)))

xcolor = pos == -1 ? color.red: pos == 1 ? color.green : color.blue

ema = ema(src,1)
above = crossover(ema, xATRTrailingStop)
below = crossover(xATRTrailingStop, ema)

buy = src > xATRTrailingStop and above
sell = src < xATRTrailingStop and below

barbuy = src > xATRTrailingStop
barsell = src < xATRTrailingStop

strategy.entry("Buy", strategy.long, when=buy)
strategy.close("Buy", when=sell)
strategy.entry("Sell", strategy.short, when=sell)
strategy.close("Sell", when=buy)

plotshape(buy, title="Buy", text='Buy', style=shape.labelup, location=location.belowbar, color=color.green, textcolor=color.white, transp=0, size=size.tiny)
plotshape(sell, title="Sell", text='Sell', style=shape.labeldown, location=location.abovebar, color=color.red, textcolor=color.white, transp=0, size=size.tiny)

barcolor(barbuy ? color.green : na)
barcolor(barsell ? color.red : na)

alertcondition(buy, "UT Long", "UT Long")
alertcondition(sell, "UT Short", "UT Short")