Chiến lược giao dịch định lượng dựa trên Bollinger Bands và VWAP
Tổng quan
Chiến lược này kết hợp hai chỉ số Brin Band (BB) và giá trị trung bình bình thường (VWAP) để đưa ra quyết định mua và bán. Nó có thể phát hiện bất thường giá ngắn hạn và sau đó giao dịch, phù hợp với giao dịch ngắn hạn.
Nguyên tắc chiến lược
Chiến lược này được sử dụng để mua và bán theo các quy tắc sau:
Đường EMA nhanh cao hơn đường EMA chậm như một điều kiện tiên quyết cho xu hướng
Khi giá đóng cửa cao hơn VWAP, đánh giá là giá tăng và mua
Nếu 10 dòng K trước đó có giá đóng cửa thấp hơn đường ray dưới Brin, nó sẽ được coi là mua bất thường
Khi giá đóng cửa cao hơn giá Brin lên đường, giá đã bị đảo ngược và bán ra
Cụ thể, chiến lược này đánh giá EMA 50 ngày cao hơn EMA 200 ngày, sử dụng EMA chậm để đánh giá xu hướng lớn. Sau đó, kết hợp với VWAP để đánh giá liệu giá có đang trong xu hướng tăng trong thời gian ngắn hay không.
Quy tắc exit đơn giản hơn, khi giá cao hơn giá Bollinger Bands, giá đã bị đảo ngược và thoát ra.
Phân tích lợi thế
Chiến lược này kết hợp nhiều chỉ số để xác định giá bất thường, có thể làm tăng hiệu quả của tín hiệu nhập. Sử dụng EMA để xác định xu hướng lớn có thể tránh hoạt động ngược. Kết hợp với VWAP có thể nắm bắt cơ hội tăng giá ngắn hạn. Sử dụng Bollinger Bands để xác định giá bất thường có thể xác định chính xác thời gian giao dịch ngắn.
Phân tích rủi ro
- EMA phán quyết xu hướng lớn không được phép dẫn đến hoạt động đối kháng
- Chỉ số VWAP được sử dụng tốt nhất cho hiệu quả dữ liệu theo giờ hoặc theo ngày, nếu sử dụng hiệu quả dữ liệu theo ngày sẽ được giảm giá
- Thiết lập tham số băng tần Brin không đúng, giới hạn đường lên xuống quá rộng hoặc quá hẹp có thể gây ra tín hiệu bị lỗi
Đối với những rủi ro này, bạn có thể điều chỉnh các tham số chu kỳ EMA thích hợp hoặc thử các chỉ số khác để xác định xu hướng lớn. Các tham số VWAP được áp dụng cho dữ liệu trong ngày hoặc điều chỉnh thành các chỉ số đường ngắn khác. Điều chỉnh tham số Brin để tìm kiếm độ rộng tối ưu.
Hướng tối ưu hóa
- Hãy thử các chỉ số khác để đánh giá xu hướng lớn, như MACD
- Tối ưu hóa EMA và tham số Brin để tìm cấu hình tốt nhất
- Tăng hệ thống chống thiệt hại
- Kết hợp với các chỉ số khác để lọc các tín hiệu giả
- Kiểm tra các loại khác nhau và dữ liệu chu kỳ
Tóm tắt
Chiến lược này kết hợp hai chỉ số Brin Belt và VWAP để đánh giá bất thường giá ngắn hạn như thời điểm nhập. Sử dụng EMA để đánh giá xu hướng lớn để tránh hoạt động ngược. Có thể nhanh chóng phát hiện cơ hội xu hướng giá ngắn.
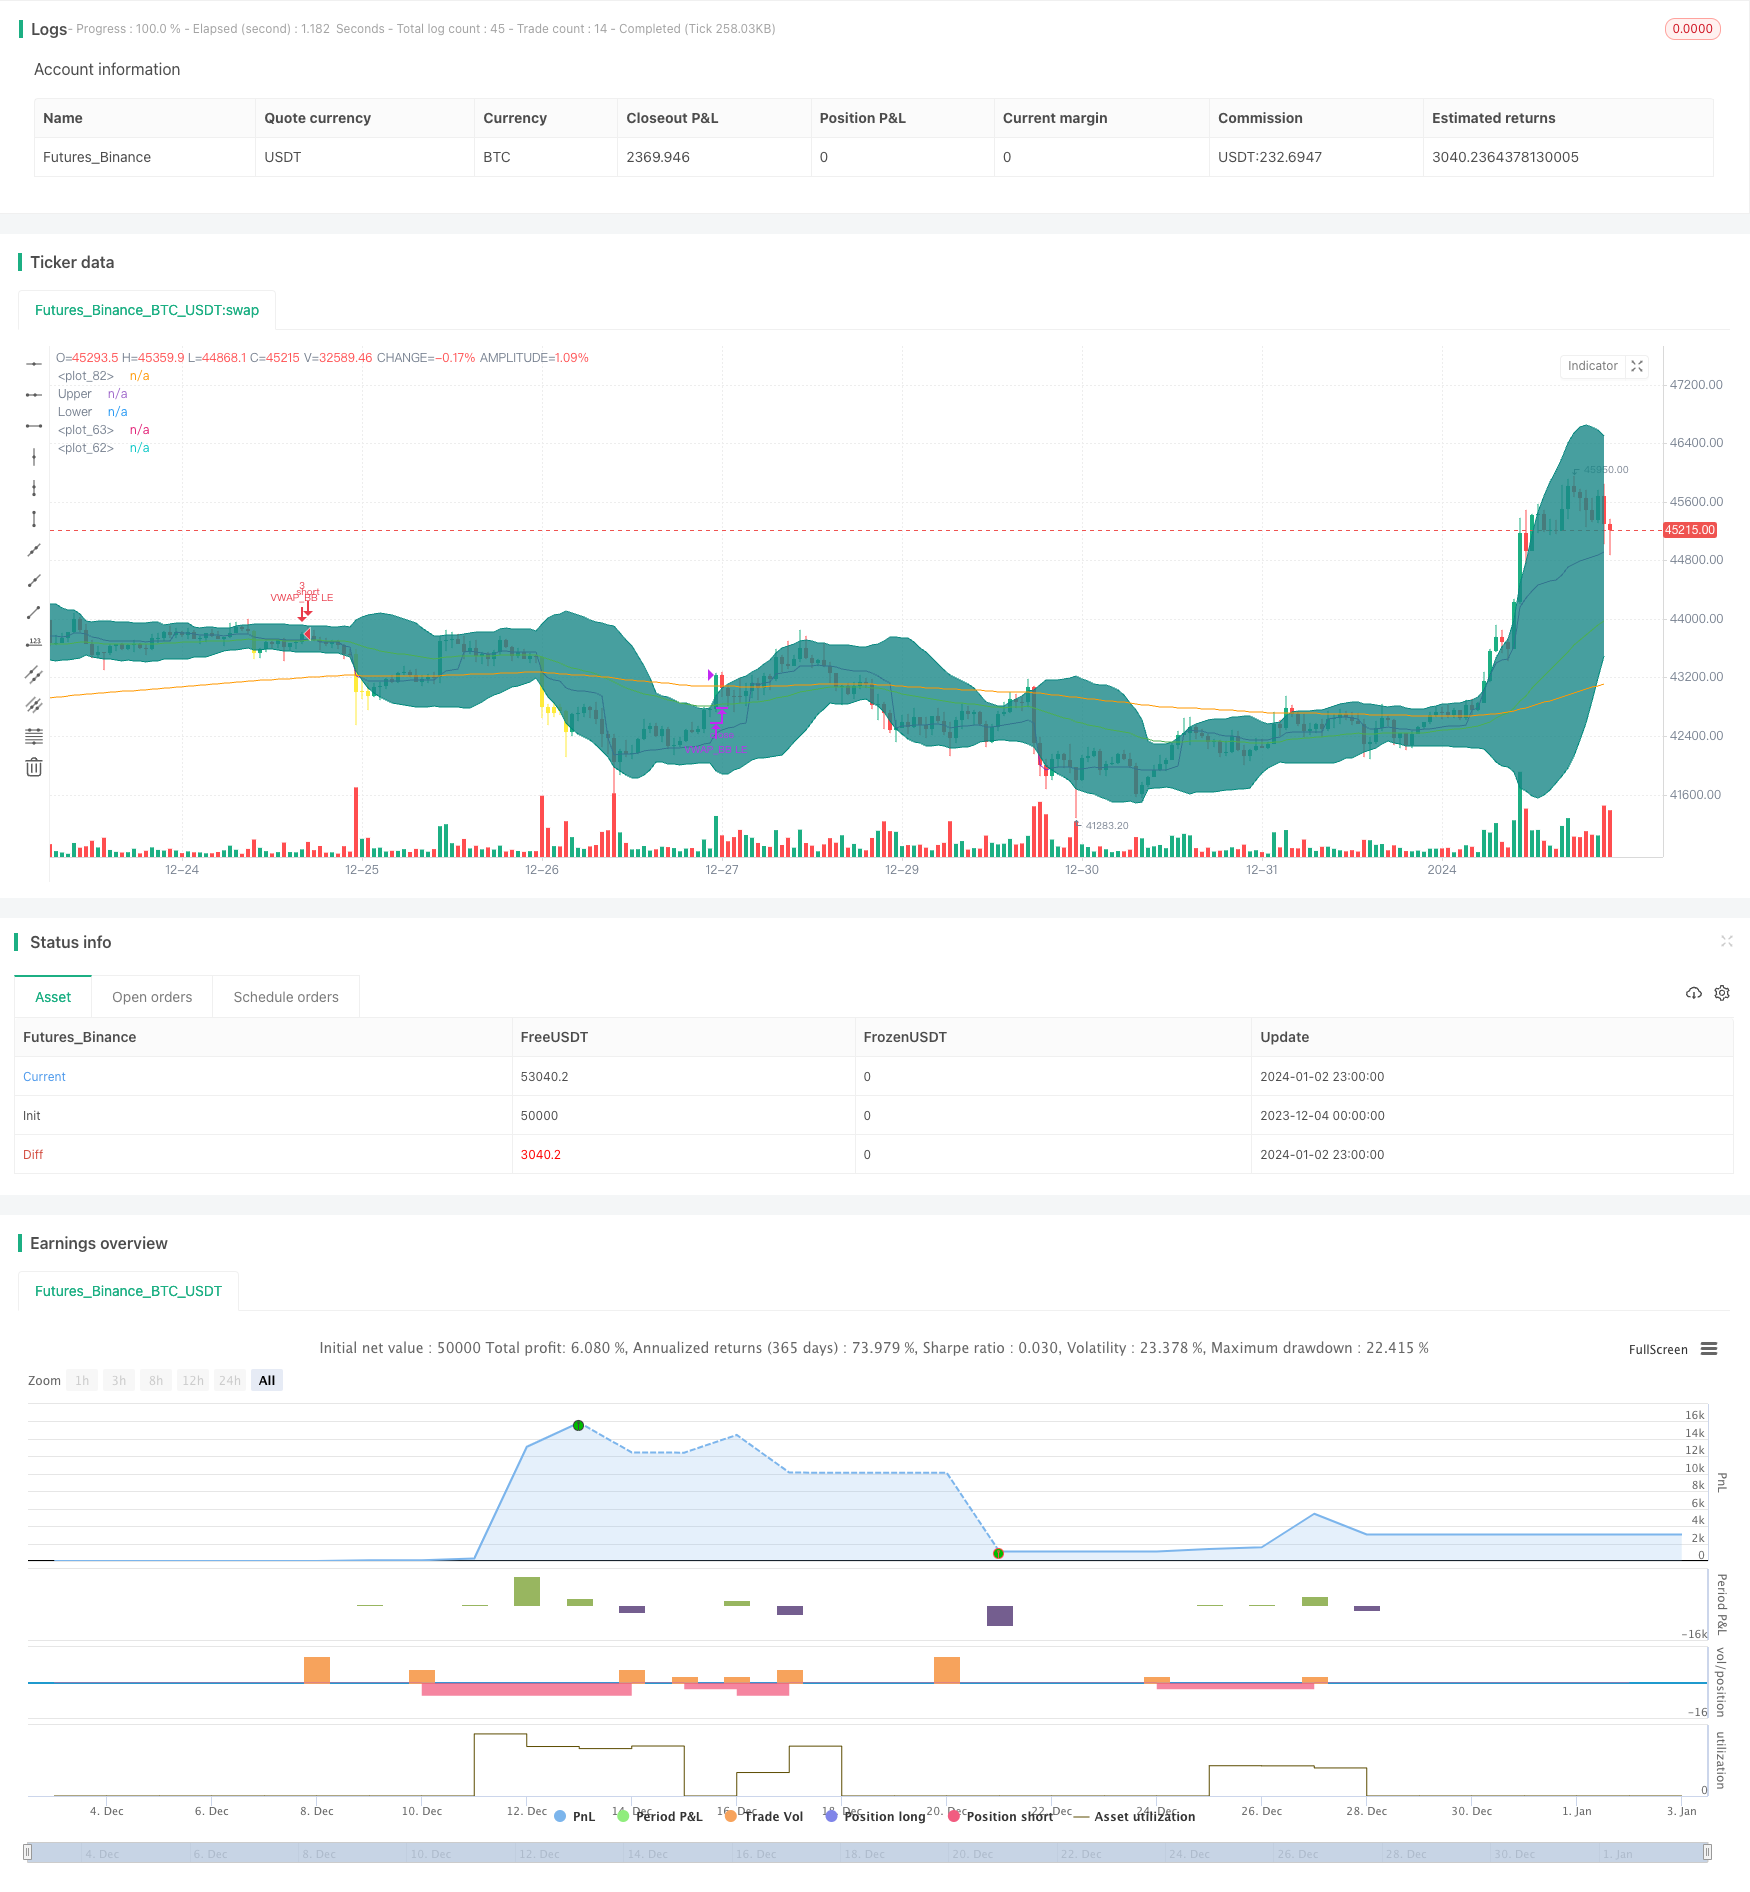
/*backtest
start: 2023-12-04 00:00:00
end: 2024-01-03 00:00:00
period: 1h
basePeriod: 15m
exchanges: [{"eid":"Futures_Binance","currency":"BTC_USDT"}]
*/

// This source code is subject to the terms of the Mozilla Public License 2.0 at https://mozilla.org/MPL/2.0/
// © mohanee

//@version=4
strategy(title="VWAP and BB strategy [EEMANI]", overlay=true,pyramiding=2, default_qty_value=3, default_qty_type=strategy.fixed,    initial_capital=10000, currency=currency.USD)
//This strategy combines VWAP and BB indicators
//BUY RULE
//1. EMA50 > EMA 200
//2. if current close > vwap session  value
//3. check if  price dipped BB lower band for any of last 10 candles
//EXIT RULE
//1. price closes above BB upper band
//STOP LOSS EXIT
//1. As configured --- default is set to 5%

is_price_dipped_bb(pds,source1) =>
    t_bbDipped=false
    for i=1 to pds
        t_bbDipped:=  (t_bbDipped   or  close[i]<source1) ? true : false
        if t_bbDipped==true
            break
        else
            continue

    t_bbDipped

// variables  BEGIN
shortEMA = input(50, title="fast EMA", minval=1)
longEMA = input(200, title="slow EMA", minval=1)

//BB

smaLength = input(20, title="BB SMA Length", minval=1)
bbsrc = input(close, title="BB Source")


//addOnDivergence = input(true,title="Add to existing on Divergence")
//exitOption = input(title="exit on RSI or BB", type=input.string, options=["RSI", "BB"],      defval="BB")

//bbSource = input(title="BB  source", type=input.string, options=["close", "vwap"],      defval="close")

//vwap_res = input(title="VWAP Resolution", type=input.resolution, defval="session")
stopLoss = input(title="Stop Loss%", defval=5, minval=1)

//variables  END


longEMAval= ema(close, longEMA)
shortEMAval= ema(close, shortEMA)


vwapVal=vwap(close)


// Drawings

//plot emas
plot(longEMAval, color = color.orange, linewidth = 1, transp=0)
plot(shortEMAval, color = color.green, linewidth = 1, transp=0)


//bollinger calculation
mult = input(2.0, minval=0.001, maxval=50, title="StdDev")
basis = sma(bbsrc, smaLength)
dev = mult * stdev(bbsrc, smaLength)
upperBand = basis + dev
lowerBand = basis - dev
offset = input(0, "Offset", type = input.integer, minval = -500, maxval = 500)
//bollinger calculation

//plot bb
//plot(basis, "Basis", color=#872323, offset = offset)
p1 = plot(upperBand, "Upper", color=color.teal, offset = offset)
p2 = plot(lowerBand, "Lower", color=color.teal, offset = offset)
fill(p1, p2, title = "Background", color=#198787, transp=95)


plot(vwapVal, color = color.purple, linewidth = 1, transp=0)


// Colour background

barcolor(shortEMAval>longEMAval and close<=lowerBand ? color.yellow: na)


//longCondition=  shortEMAval > longEMAval and  close>open and  close>vwapVal
longCondition= shortEMAval >= longEMAval  and  close>=vwapVal and close>open  //      close>vwapVal   and


//Entry
strategy.entry(id="VWAP_BB LE", comment="VB LE" , long=true,  when= longCondition and  is_price_dipped_bb(10,lowerBand) )  //and strategy.position_size<1

//add to the existing position
//strategy.entry(id="VWAP_RSI LE", comment="VR LE Add" , long=true,  when= addOnDivergence==true and strategy.position_size>=1 and close<strategy.position_avg_price   and (close<lowerBand or  low<lowerBand) and rsiVal>rsi_buy_line)

barcolor(strategy.position_size>=1  ? color.blue: na)


strategy.close(id="VWAP_BB LE", comment="TP Exit VB LE",   when=crossover(close,upperBand) )

//stoploss
stopLossVal =   strategy.position_avg_price * (1-(stopLoss*0.01) )
strategy.close(id="VB LE", comment="SL Exit",   when= close < stopLossVal)