Chiến lược giao dịch ngắn hạn theo xu hướng
Ngày tạo:
2024-01-04 17:52:21
sửa đổi lần cuối:
2024-01-04 17:52:21
sao chép:
3
Số nhấp chuột:
704
1
tập trung vào
1751
Người theo dõi
Tổng quan
Chiến lược này dựa trên chỉ số định xu hướng ADX trung bình và chỉ số định xu hướng và kết hợp đường trung bình, để đánh giá và theo dõi xu hướng. Khi đánh giá xu hướng đảo ngược, sử dụng hoạt động phá vỡ, giao dịch ngắn.
Nguyên tắc chiến lược
- Sử dụng chỉ số xu hướng trung bình của ADX để xác định xu hướng. Khi ADX lớn hơn 20, nó cho biết hiện tại đang trong tình trạng xu hướng.
- EMA là một chỉ số đánh giá xu hướng, EMA Gold Fork cho thấy xu hướng tăng, Dead Fork cho thấy xu hướng giảm.
- VWAP là một giá tham chiếu quan trọng, giá ở trên VWAP là thị trường nhiều đầu, dưới là thị trường trống.
- Xác định xu hướng và sự đảo ngược của thị trường dựa trên nhiều chỉ số trên, thực hiện các hoạt động phá vỡ, theo dõi xu hướng và giao dịch ngắn.
Phân tích lợi thế
- Các chỉ số tổng hợp được sử dụng để đánh giá xu hướng và chính xác các xu hướng lớn.
- VWAP là giá tham chiếu quan trọng, tránh giao dịch trong khu vực không có hiệu lực.
- ADX đánh giá xu hướng và thực hiện các hoạt động khác để giảm các giao dịch không hiệu lực.
- Hành động đột phá có tỷ lệ thành công cao, phù hợp với xu hướng.
Phân tích rủi ro
- Có khả năng phá vỡ thất bại dẫn đến dừng lỗ. Bạn có thể giảm rủi ro bằng cách tối ưu hóa vị trí dừng lỗ.
- Có nhiều giao dịch, giao dịch đơn lẻ có thể bị thua lỗ. Bạn có thể điều chỉnh số vị trí thích hợp, giảm tỷ lệ thua lỗ đơn lẻ.
- Lựa chọn thời gian giao dịch và loại giao dịch cũng ảnh hưởng đến hiệu suất của chiến lược. Bạn có thể thử nghiệm các thời gian giao dịch khác nhau và các loại giao dịch khác nhau.
Hướng tối ưu hóa
- Tối ưu hóa tham số ADX để tìm ra xu hướng phân biệt tốt hơn và giá trị ADX tổng hợp.
- Tối ưu hóa các tham số đường trung bình để tìm ra các đường trung bình tốt hơn để đại diện cho xu hướng.
- Tối ưu hóa vị trí dừng lỗ. Nới rộng phạm vi dừng lỗ thích hợp, tránh chi phí dừng lỗ quá cao.
- Tối ưu hóa kích thước vị trí. Giảm rủi ro giao dịch đơn lẻ.
Tóm tắt
Chiến lược này sử dụng các chỉ số đường trung bình, chỉ số đánh giá xu hướng và giá tham chiếu quan trọng để đánh giá chính xác xu hướng lớn; và khi đánh giá xu hướng đảo ngược, sử dụng hoạt động đột phá để theo dõi xu hướng và thực hiện giao dịch đường ngắn. Bằng cách tối ưu hóa tham số, bạn có thể cải thiện hơn nữa hiệu suất của chiến lược.
Mã nguồn chiến lược
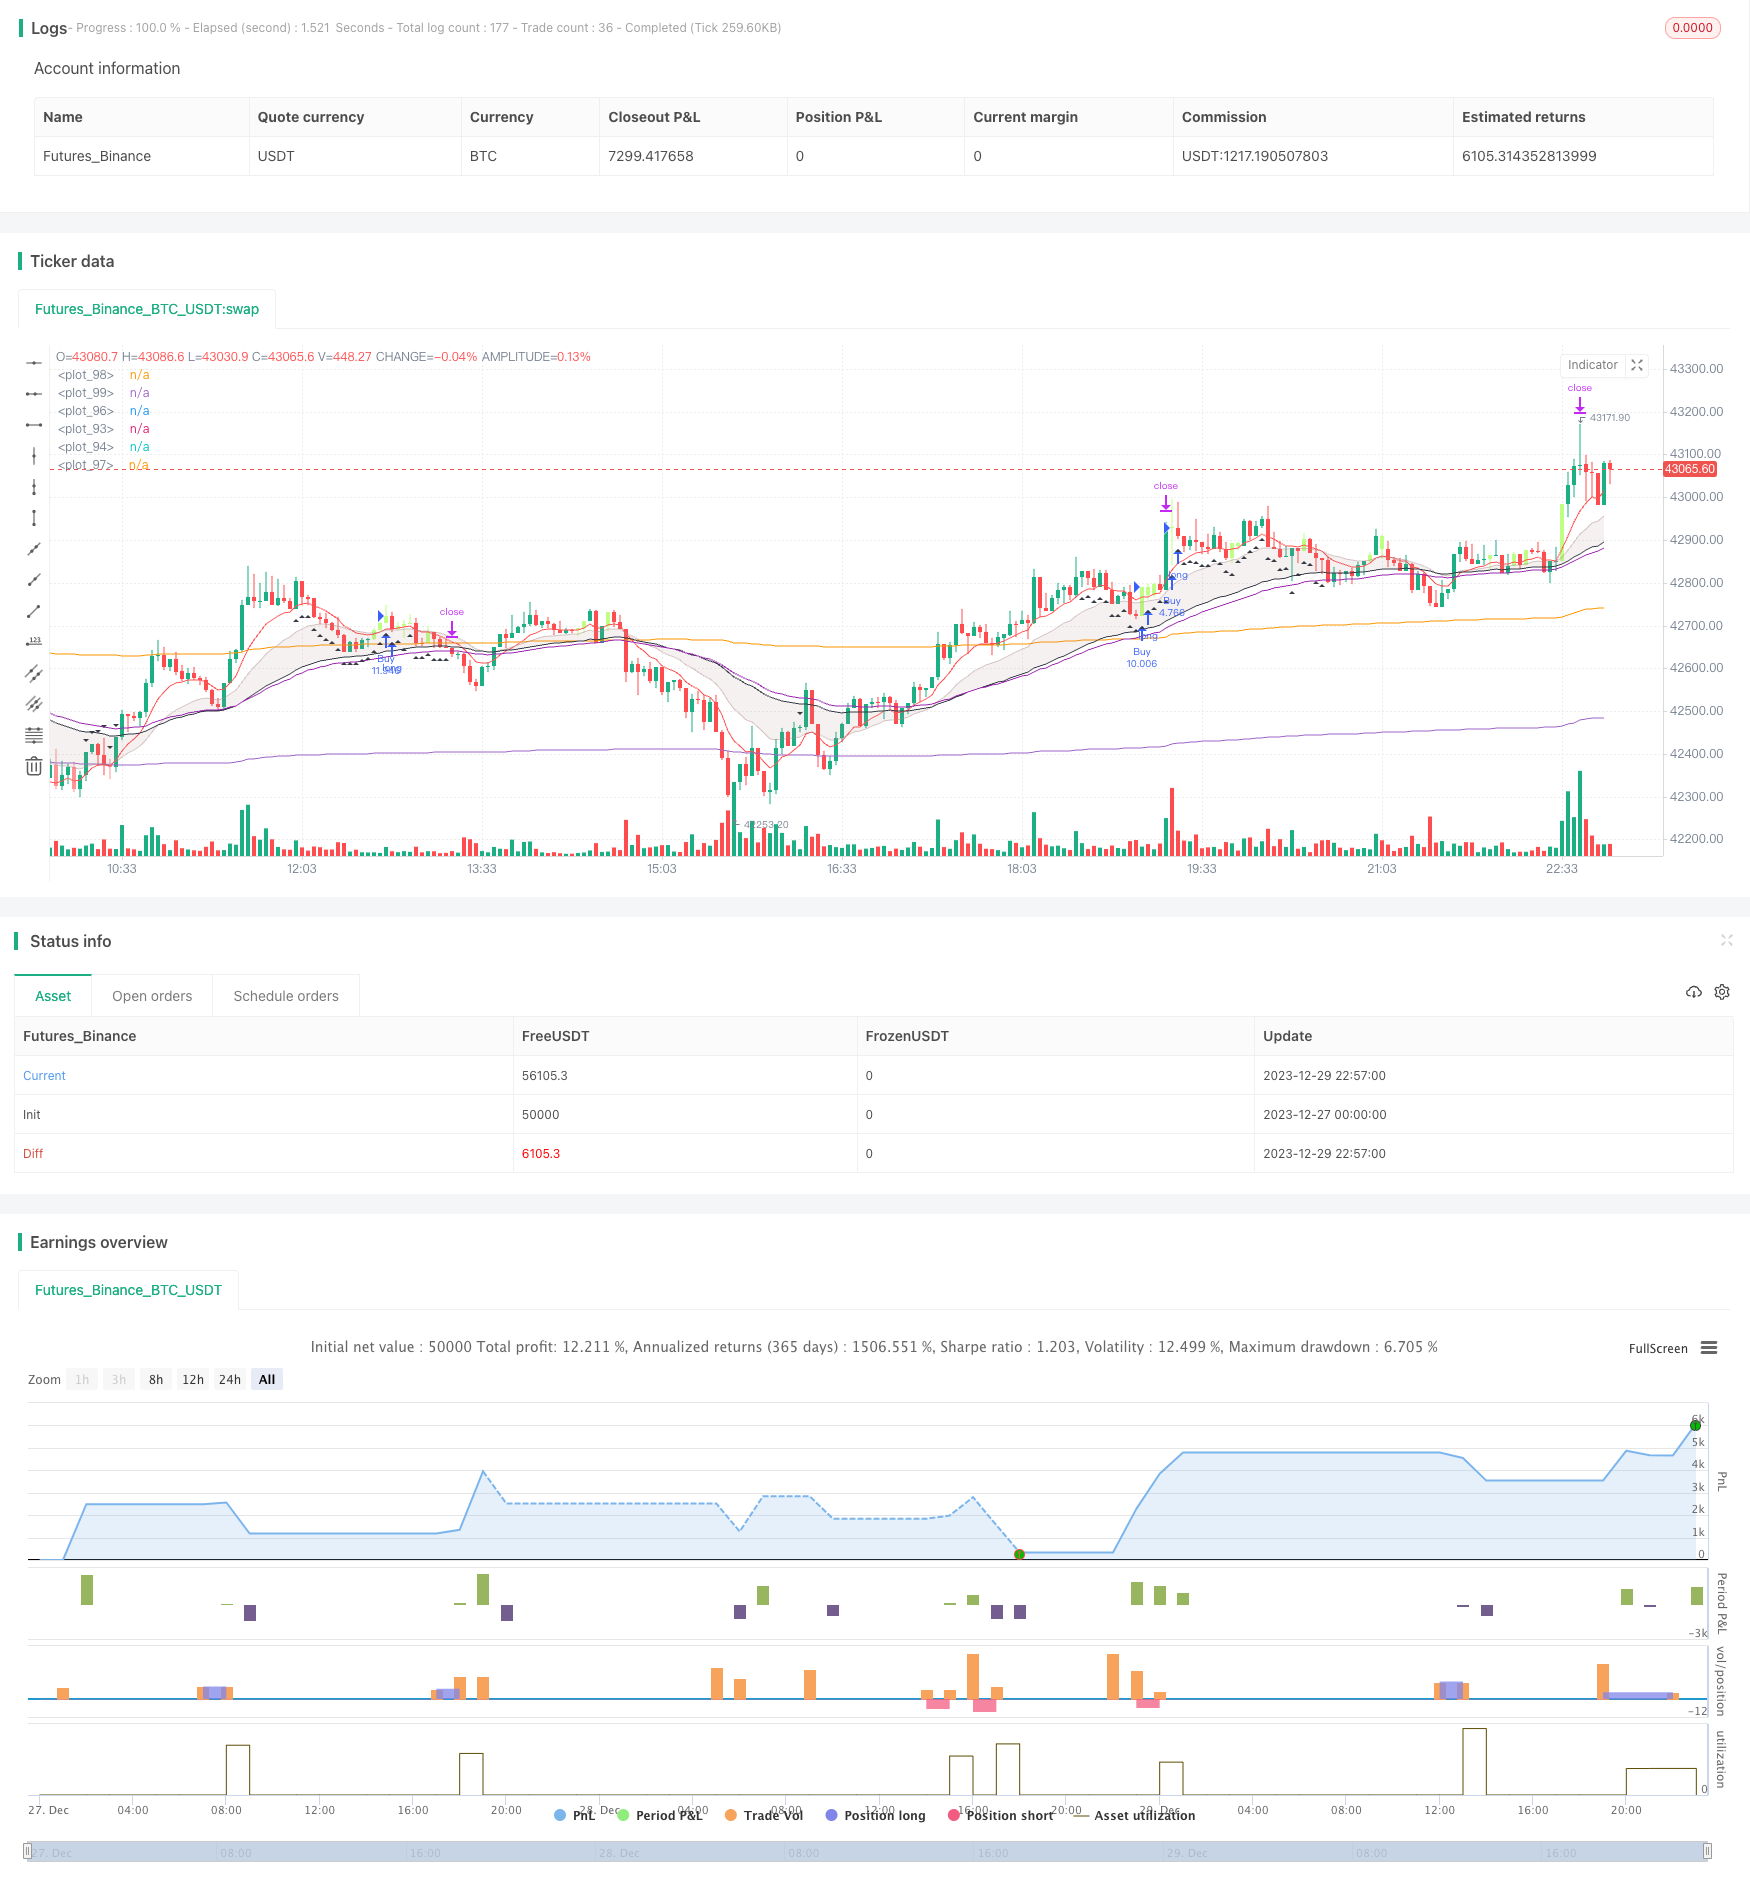
/*backtest
start: 2023-12-27 00:00:00
end: 2023-12-29 23:00:00
period: 3m
basePeriod: 1m
exchanges: [{"eid":"Futures_Binance","currency":"BTC_USDT"}]
*/

// This source code is subject to the terms of the Mozilla Public License 2.0 at https://mozilla.org/MPL/2.0/
// © mariocastel

//@version=5
strategy("Wave Rider", overlay=true, initial_capital = 100000)

session = input(defval = "1400-1500", title = "Session Time")
t = not na(time(timeframe.period,session))
RR = input.float(1.5, "Risk to reward", step=0.5)
var bool movetoBE = input(false, "Move to Break Even")
BE = input.float(1, "Break Even at", step=0.5)

vwap_mult = 0.001 * input(3, "VWAP Multiplier")
aboveVWAP = ta.vwap(close) * (1 + vwap_mult)
belowVWAP = ta.vwap(close) * (1 - vwap_mult)
sym = input("BTC_USDT:swap", "VWAP Source")

QQQaboveVWAP = request.security(sym, "3", aboveVWAP)
QQQbelowVWAP = request.security(sym, "3", belowVWAP)
QQQclose = request.security(sym, "3", close)

ema20 = ta.ema(close, 20)
ema50 = ta.ema(close, 50)
ema60 = ta.ema(close, 60)
ema9 = ta.ema(close, 9)

opentrades = strategy.opentrades > 0

aboveEMA = close > ema60
belowEMA = close < ema60

uptrend = aboveEMA and aboveEMA[1] and aboveEMA[2] and aboveEMA[3] and aboveEMA[4] and aboveEMA[5] and aboveEMA[6] and aboveEMA[7] and aboveEMA[8] and aboveEMA[9] and aboveEMA[10] and aboveEMA[11] and aboveEMA[12] and aboveEMA[13] and aboveEMA[14] and aboveEMA[15] and aboveEMA[16] and aboveEMA[17] and aboveEMA[18] and aboveEMA[19] and aboveEMA[20] and aboveEMA[21] and aboveEMA[22] and aboveEMA[23] and aboveEMA[24] and aboveEMA[25] and aboveEMA[26] and aboveEMA[27] and aboveEMA[28] and aboveEMA[29]
downtrend = belowEMA and belowEMA[1] and belowEMA[2] and belowEMA[3] and belowEMA[4] and belowEMA[5] and belowEMA[6] and belowEMA[7] and belowEMA[8] and belowEMA[9] and belowEMA[10] and belowEMA[11] and belowEMA[12] and belowEMA[13] and belowEMA[14] and belowEMA[15] and belowEMA[16] and belowEMA[17] and belowEMA[18] and belowEMA[19] and belowEMA[20] and belowEMA[21] and belowEMA[22] and belowEMA[23] and belowEMA[24] and belowEMA[25] and belowEMA[26] and belowEMA[27] and belowEMA[28] and belowEMA[29]

buy = (low < ema20 and low > ema50 and close > ema9) and QQQclose > QQQaboveVWAP  or (low[1] < ema20 and low[1] > ema50 and close > ema9) and QQQclose > QQQaboveVWAP and uptrend
sell = (high > ema20 and high < ema50 and close < ema9) and QQQclose < QQQbelowVWAP  or (high[1] > ema20 and high[1] < ema50 and close < ema9) and QQQclose < QQQbelowVWAP and downtrend

var float entry = na
var float sl = na
var float qty = na
var float tp = na
var float be = na

if ema20 > ema50 and ema9 > ema20
    if buy and not opentrades and t and uptrend
        alert("Wave Rider Setup")
        entry := close
        sl := ema50
        qty := 1000/(close - sl) * 1
        if close - sl > syminfo.mintick*300
            tp := close + ((close - sl)*1)
        else
            tp := close + ((close - sl)*RR)
        be := close + ((close - sl)*BE)
        strategy.entry("Buy", strategy.long, qty=qty)
        strategy.exit("Close Buy", "Buy",qty=qty, stop=sl, limit=tp)

if ema20 < ema50 and ema9 < ema20
    if sell and not opentrades and t and downtrend
        alert("Wave Rider Setup")
        entry := close
        sl := ema50
        qty := 1000/(sl - close) * 1
        if sl - close > syminfo.mintick*300
            tp := close - ((sl - close)*1)
        else
            tp := close - ((sl - close)*RR)
        be := close - ((sl - close)*BE)
        strategy.entry("Sell", strategy.short, qty=qty)
        strategy.exit("Close Sell", "Sell", qty=qty, stop=sl, limit=tp)

// Adjust BEs
if movetoBE == true
    if strategy.position_size > 0
        if high >= be
            sl := entry
            strategy.cancel("Close Buy")
            strategy.exit("Close Buy", "Buy", qty=qty, stop=sl, limit=tp)
    if strategy.position_size < 0
        if low <= be
            sl := entry
            strategy.cancel("Close Sell")
            strategy.exit("Close Sell", "Sell", qty=qty, stop=sl, limit=tp)


EoD_time = timestamp(year, month, dayofmonth, 15, 58, 00)
EoD = time == EoD_time
if EoD
    strategy.close_all()

barcolor(color=buy ? color.rgb(191, 255, 131): na)
barcolor(color=sell ? color.rgb(255, 149, 149): na)
ema20plot = plot(ema20, color=color.rgb(168, 131, 131, 55))
ema50plot = plot(ema50, color=color.black)
fill(ema20plot, ema50plot, color=color.rgb(168, 131, 131, 85))
plot(ema9, color=color.red)
plot(ema60, color=color.purple)
plot(QQQaboveVWAP)
plot(QQQbelowVWAP)
plotshape(uptrend, style=shape.triangleup, location=location.belowbar, color=color.black)
plotshape(downtrend, style=shape.triangledown, location=location.abovebar, color=color.black)