Chiến lược đột phá tăng giá tùy chỉnh
Tổng quan
Chiến lược đột phá lên tùy chỉnh là một chiến lược giao dịch định lượng dựa trên phán đoán về xu hướng giá. Chiến lược này được tính toán bằng cách tính toán tỷ lệ K-line trong chu kỳ được chỉ định để xác định liệu thị trường có đang ở trong tình trạng tăng liên tục hay không.
Nguyên tắc chiến lược
Chỉ số cốt lõi của chiến lược này là tỷ lệ thẳng K. Đường thẳng K cho thấy giá tăng trong chu kỳ này từ mức thấp khi mở cửa và giá đóng cửa cao hơn giá mở cửa. Chiến lược sử dụng số lượng đường thẳng K chiếm tỷ lệ của tất cả các đường K trong chu kỳ chuyển tiếp được chỉ định bởi người dùng thống kê, khi tỷ lệ lớn hơn giới hạn trên thì đánh giá hiện tại đang trong tình trạng tăng liên tục, và khi đó làm nhiều; khi tỷ lệ nhỏ hơn giới hạn dưới thì đánh giá hiện tại đang trong tình trạng giảm liên tục, và khi đó không có.
Ví dụ: người dùng đặt số chu kỳ là 20, giới hạn trên là 70, giới hạn dưới là 30. Chiến lược quay trở lại 20 đường K gần nhất, nếu trong số đó có 16 đường là đường K thẳng, tỷ lệ là 16⁄20 = 80%.
Phân tích lợi thế
Chiến lược này có những lợi thế sau:
- Các chiến lược của họ đơn giản, trực quan và dễ hiểu.
- Chỉ cần một chỉ số, giảm nguy cơ tối ưu hóa quá mức;
- Người dùng có thể tùy chỉnh các tham số cho các giống khác nhau;
- Có chức năng ngăn chặn thiệt hại tích hợp, giúp ngăn chặn thiệt hại lớn;
- Có thể thực hiện lệnh ngược trực tiếp, không cần phải chờ đợi để mở lại và theo dõi nhanh hơn.
Phân tích rủi ro
Chiến lược này cũng có một số rủi ro:
- Một chỉ số có thể tạo ra một tín hiệu sai.
- Các tham số chỉ số dễ bị tối ưu hóa quá mức, hiệu quả của đĩa cứng có thể khác nhau;
- Trong trường hợp biến động mạnh, lệnh dừng có thể bị phá vỡ và dẫn đến tổn thất;
- Chức năng mở cửa ngược có thể làm tăng tổn thất;
- Hiệu quả có liên quan đến giống và cần được thử nghiệm riêng biệt.
Để giảm thiểu rủi ro, có thể tối ưu hóa các khía cạnh sau:
- Thêm các điều kiện lọc để tránh tín hiệu sai;
- Tối ưu hóa chiến lược dừng lỗ, giảm thiểu tổn thất đơn lẻ;
- Đánh giá và kiểm soát mức độ tổn thất đơn lẻ;
- Kết quả thử nghiệm ở các giống khác nhau.
Hướng tối ưu hóa
Chiến lược này có thể được tối ưu hóa theo các hướng sau:
- Tăng các chỉ số phán đoán phụ trợ như tính hợp lý của giá cả, tránh các tín hiệu sai
- Tối ưu hóa phương thức dừng lỗ, có thể xem xét dừng di chuyển, dừng rung, v.v
- Thêm các điều kiện lọc mở kho, chẳng hạn như phá vỡ đường Brinh và nhập lại
- Kiểm tra sự phù hợp của các tham số thẳng K đối với các giống khác nhau
- Đánh giá mức thu hồi tối đa, kiểm soát mức lỗ đơn lẻ
Tóm tắt
Các chiến lược đột phá tùy chỉnh là một chiến lược tổng thể rõ ràng và đơn giản, sử dụng các chỉ số đơn giản để đánh giá xu hướng tăng hoặc giảm liên tục thông qua tỷ lệ thống kê theo đường K. Chiến lược này dễ hiểu, thân thiện với người dùng và phù hợp với thực tiễn của người mới bắt đầu giao dịch định lượng. Tuy nhiên, chỉ có một số biến động lợi nhuận dựa trên chỉ số và tham số đặt ra, cần tiếp tục tối ưu hóa chiến lược đối với rủi ro, cho phép nó có thể kiếm được lợi nhuận ổn định trong nhiều thị trường hơn.
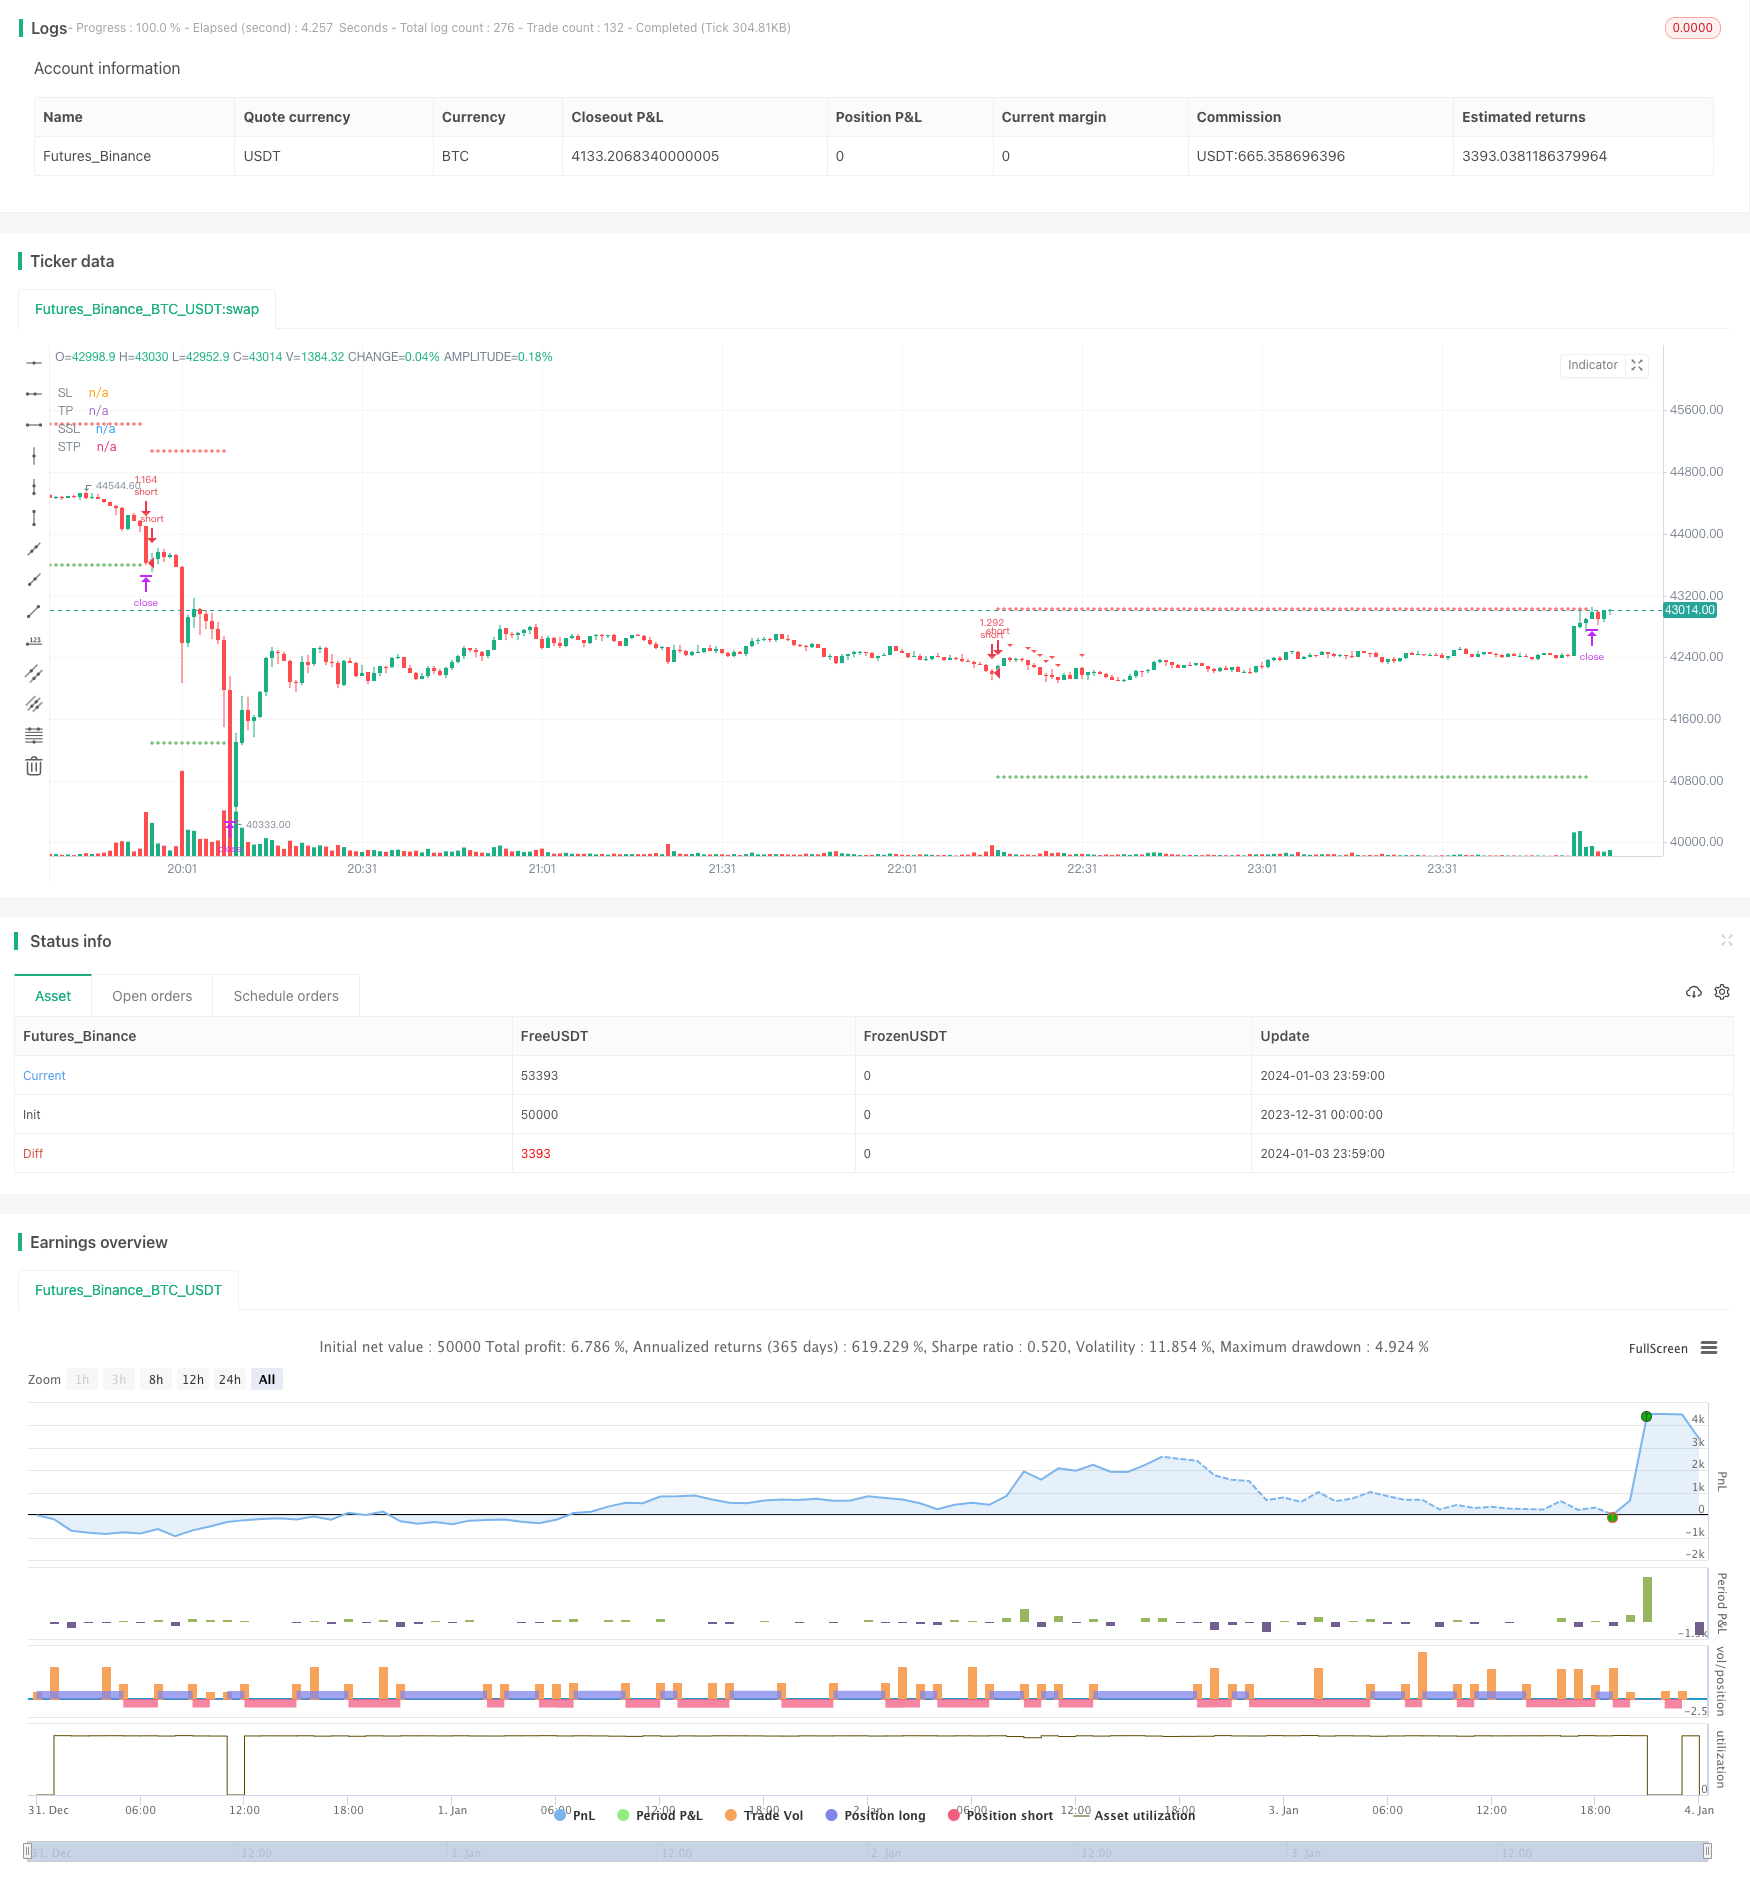
/*backtest
start: 2023-12-31 00:00:00
end: 2024-01-04 00:00:00
period: 1m
basePeriod: 1m
exchanges: [{"eid":"Futures_Binance","currency":"BTC_USDT"}]
*/


// This source code is subject to the terms of the Mozilla Public License 2.0 at https://mozilla.org/MPL/2.0/
// © ZenAndTheArtOfTrading
// © TweakerID

// Based on the calculations by ZenAndTheArtOfTrading, I added stop loss, take profit and reverse line codes.
// The Positive Bars % calculates the number of green (positive) bars, relative to a lookback period, defined
// by the user. If the percentage is low, it means that there was a bigger number of red candles in the
// lookback period. The strategy goes long when the percentage is high and short when it's low, although
// this logic can be reversed with positive results on different time frames.

//@version=4
strategy("Positive Bars % Strat",
     overlay=true,
     default_qty_type=strategy.percent_of_equity,
     default_qty_value=100,
     initial_capital=10000,
     commission_value=0.04,
     calc_on_every_tick=false,
     slippage=0)

direction = input(0, title = "Strategy Direction", type=input.integer, minval=-1, maxval=1)
strategy.risk.allow_entry_in(direction == 0 ? strategy.direction.all : (direction < 0 ? strategy.direction.short : strategy.direction.long))

/////////////////////// STRATEGY INPUTS ////////////////////////////////////////
title1=input(true, "-----------------Strategy Inputs-------------------")

lookback = input(title="Lookback", type=input.integer, defval=13)
upperLimit = input(title="Upper Limit", type=input.integer, defval=70)
lowerLimit = input(title="Lower Limit", type=input.integer, defval=30)

/////////////////////// BACKTESTER /////////////////////////////////////////////
title2=input(true, "-----------------General Inputs-------------------")

// Backtester General Inputs
i_SL=input(true, title="Use Stop Loss and Take Profit")
i_SLType=input(defval="ATR Stop", title="Type Of Stop", options=["Strategy Stop", "Swing Lo/Hi", "ATR Stop"])
i_SPL=input(defval=10, title="Swing Point Lookback")
i_PercIncrement=input(defval=2, step=.1, title="Swing Point SL Perc Increment")*0.01
i_ATR = input(14, title="ATR Length")
i_ATRMult = input(10, step=.1, title="ATR Multiple")
i_TPRRR = input(1.6, step=.1, title="Take Profit Risk Reward Ratio")

// Bought and Sold Boolean Signal
bought = strategy.position_size > strategy.position_size[1]
 or strategy.position_size < strategy.position_size[1]

// Price Action Stop and Take Profit
LL=(lowest(i_SPL))*(1-i_PercIncrement)
HH=(highest(i_SPL))*(1+i_PercIncrement)
LL_price = valuewhen(bought, LL, 0)
HH_price = valuewhen(bought, HH, 0)
entry_LL_price = strategy.position_size > 0 ? LL_price : na
entry_HH_price = strategy.position_size < 0 ? HH_price : na
tp=strategy.position_avg_price + (strategy.position_avg_price - entry_LL_price)*i_TPRRR
stp=strategy.position_avg_price - (entry_HH_price - strategy.position_avg_price)*i_TPRRR

// ATR Stop
ATR=atr(i_ATR)*i_ATRMult
ATRLong = ohlc4 - ATR
ATRShort = ohlc4 + ATR
ATRLongStop = valuewhen(bought, ATRLong, 0)
ATRShortStop = valuewhen(bought, ATRShort, 0)
LongSL_ATR_price = strategy.position_size > 0 ? ATRLongStop : na
ShortSL_ATR_price = strategy.position_size < 0 ? ATRShortStop : na
ATRtp=strategy.position_avg_price + (strategy.position_avg_price - LongSL_ATR_price)*i_TPRRR
ATRstp=strategy.position_avg_price - (ShortSL_ATR_price - strategy.position_avg_price)*i_TPRRR

// Strategy Stop
float LongStop = na
float ShortStop = na
float StratTP = na
float StratSTP = na

/////////////////////// STRATEGY LOGIC /////////////////////////////////////////

//Calculations
positiveBars = 0
for i = (lookback - 1) to 0
    if close[i] > open[i]
        positiveBars := positiveBars + 1
positiveBarsPercent = (positiveBars / lookback) * 100

BUY=positiveBarsPercent >= upperLimit
SELL=positiveBarsPercent <= lowerLimit

//Trading Inputs
DPR=input(true, "Allow Direct Position Reverse")
reverse=input(false, "Reverse Trades")

// Entries
if reverse
    if not DPR
        strategy.entry("long", strategy.long, when=SELL and strategy.position_size == 0)
        strategy.entry("short", strategy.short, when=BUY and strategy.position_size == 0)
    else
        strategy.entry("long", strategy.long, when=SELL)
        strategy.entry("short", strategy.short, when=BUY)
else
    if not DPR
        strategy.entry("long", strategy.long, when=BUY and strategy.position_size == 0)
        strategy.entry("short", strategy.short, when=SELL and strategy.position_size == 0)
    else
        strategy.entry("long", strategy.long, when=BUY)
        strategy.entry("short", strategy.short, when=SELL)


SL= i_SLType == "Swing Lo/Hi" ? entry_LL_price : i_SLType == "ATR Stop" ? LongSL_ATR_price : LongStop
SSL= i_SLType == "Swing Lo/Hi" ? entry_HH_price : i_SLType == "ATR Stop" ? ShortSL_ATR_price : ShortStop
TP= i_SLType == "Swing Lo/Hi" ? tp : i_SLType == "ATR Stop" ? ATRtp : StratTP
STP= i_SLType == "Swing Lo/Hi" ? stp : i_SLType == "ATR Stop" ? ATRstp : StratSTP

strategy.exit("TP & SL", "long", limit=TP, stop=SL, when=i_SL)
strategy.exit("TP & SL", "short", limit=STP, stop=SSL, when=i_SL)

/////////////////////// PLOTS //////////////////////////////////////////////////

plot(i_SL and strategy.position_size > 0 ? SL : na , title='SL', style=plot.style_cross, color=color.red)
plot(i_SL and strategy.position_size < 0 ? SSL : na , title='SSL', style=plot.style_cross, color=color.red)
plot(i_SL and strategy.position_size > 0 ? TP : na, title='TP', style=plot.style_cross, color=color.green)
plot(i_SL and strategy.position_size < 0 ? STP : na, title='STP', style=plot.style_cross, color=color.green)
// Draw price action setup arrows
plotshape(BUY ? 1 : na, style=shape.triangleup, location=location.belowbar,
 color=color.green, title="Bullish Setup", size=size.auto)
plotshape(SELL ? 1 : na, style=shape.triangledown, location=location.abovebar,
 color=color.red, title="Bearish Setup", size=size.auto)