Chiến lược dừng lỗ theo sau dựa trên điểm dừng lỗ và chốt lời
Tổng quan
Ý tưởng cốt lõi của chiến lược này là sử dụng sự giao thoa của EMA và WMA làm tín hiệu đầu vào và kết hợp với các điểm dừng dựa trên tính toán điểm để giao dịch. Ưu điểm lớn nhất của nó là có thể kiểm soát rủi ro rất linh hoạt và chính xác, bằng cách điều chỉnh kích thước điểm để kiểm soát mức độ dừng lỗ.
Nguyên tắc chiến lược
Khi EMA từ dưới lên phá vỡ WMA, nó sẽ tạo ra một tín hiệu nhiều; khi EMA từ trên xuống phá vỡ WMA, nó sẽ tạo ra một tín hiệu trống. Sau khi vào vị trí, nó sẽ tính toán điểm vào trong thời gian thực và thiết lập điểm dừng và dừng trên cơ sở đó. Ví dụ: thiết lập điểm dừng 20 điểm, điểm dừng 100 điểm, giá dừng cụ thể sẽ là giá vào giảm 20 điểm*Giá trị hợp đồng, giá dừng là giá nhập thêm 100 điểm*Giá trị hợp đồng. Để kiểm soát rủi ro và lợi nhuận.
Trong khi đó, chiến lược này cũng kết hợp các lệnh dừng hiện tại với các lệnh dừng lịch sử để so sánh, điều chỉnh vị trí dừng di chuyển, để đạt được giá theo dõi dừng di chuyển.
Phân tích lợi thế
Điểm lợi lớn nhất của chiến lược này so với điểm cố định hoặc phần trăm dừng thông thường là có thể kiểm soát rủi ro rất linh hoạt và chính xác. Kích thước của điểm điều chỉnh có thể ảnh hưởng trực tiếp đến kích thước của mức dừng. Điều này rất phù hợp với các giống khác nhau và có thể được điều chỉnh tinh tế theo tần suất và mức độ biến động của thị trường.
Ngoài ra, dừng lưu động cũng là một tính năng rất thực tế. Nó có thể theo dõi và điều chỉnh vị trí dừng lỗ theo sự thay đổi thời gian thực của tình hình, trong khi đảm bảo kiểm soát rủi ro, có thể theo đuổi lợi nhuận lớn nhất có thể.
Phân tích rủi ro
Rủi ro của chiến lược này chủ yếu đến từ hai chỉ số EMA và WMA. Khi thị trường thay đổi mạnh, chúng thường phát ra tín hiệu sai, dễ bị dừng. Trong trường hợp này, khuyến nghị nới lỏng điểm dừng thích hợp hoặc xem xét thay thế các chỉ số khác.
Một điểm rủi ro khác là việc dừng lỗ rất khó để cân bằng. Nếu theo đuổi mức dừng cao hơn, thường cần phải chịu rủi ro lớn hơn, điều này dễ bị dừng lại khi thị trường chuyển hướng. Vì vậy, các thiết lập dừng lỗ cần được kiểm tra và đánh giá cẩn thận.
Hướng tối ưu hóa
Chiến lược này có thể được tối ưu hóa theo các hướng sau:
- Kiểm tra các kết hợp EMA và WMA với các tham số khác nhau để tìm ra tham số tốt nhất;
- Hãy thử thay thế hoặc kết hợp các chỉ số khác như MACD, KDJ để xem có thể tăng tỷ lệ thắng hay không.
- Đánh giá rủi ro và lợi ích của các điểm dừng lỗ khác nhau để tìm ra cấu hình tối ưu;
- Nghiên cứu các đặc điểm của các giống khác nhau, điều chỉnh các tham số cho các thị trường khác nhau;
- Tham gia thuật toán học máy để tối ưu hóa động của tham số.
Tóm tắt
Ý tưởng cốt lõi của chiến lược đơn giản và rõ ràng, dựa trên chỉ số EMA và WMA, sử dụng cơ chế dừng lỗ dựa trên tính toán điểm để kiểm soát rủi ro. Ưu điểm của chiến lược là kiểm soát rủi ro chính xác và linh hoạt, có thể được điều chỉnh thích hợp cho các thị trường khác nhau.
/*backtest
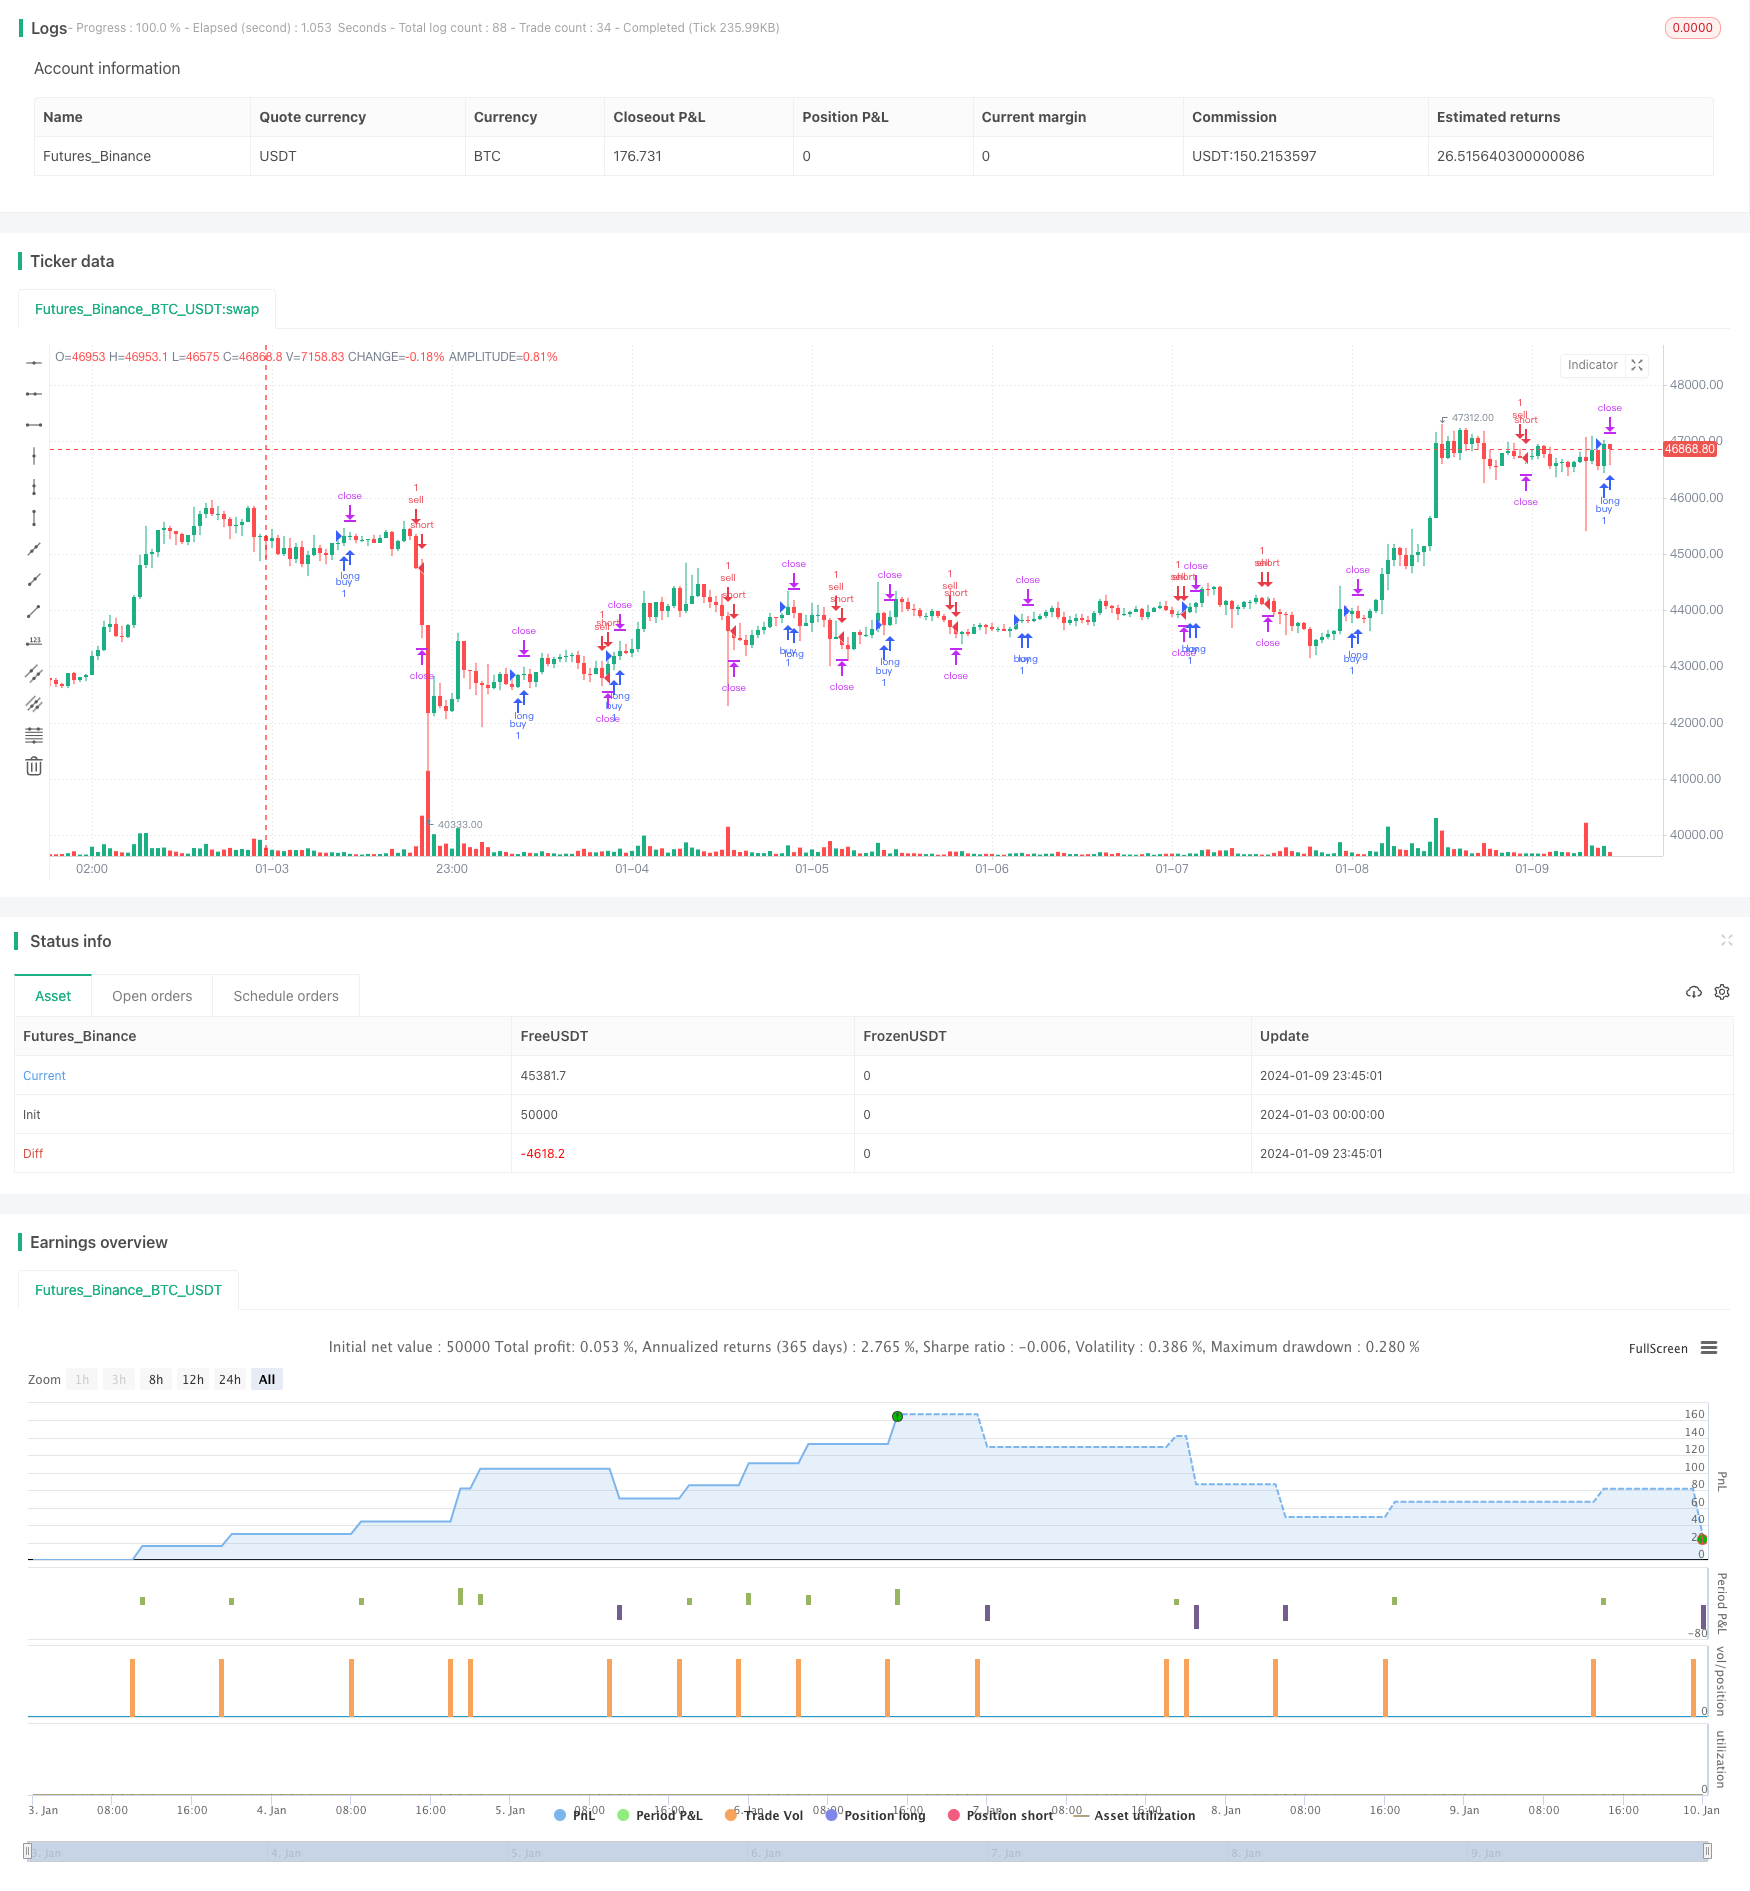
start: 2024-01-03 00:00:00
end: 2024-01-10 00:00:00
period: 45m
basePeriod: 5m
exchanges: [{"eid":"Futures_Binance","currency":"BTC_USDT"}]
*/
// inspiration script from: @ahmad_naquib
// inspiration script link: https://www.tradingview.com/script/tGTV8MkY-Two-Take-Profits-and-Two-Stop-Loss/
// inspiration strategy script name: Two Take Profits and Two Stop Loss
////////////
// Do not use this strategy, it's just an exmaple !! The goal from this script is to show you TP and SL based on PIPS
////////////
//@version=5
strategy('SL & TP based on Pips', "PIP SL & TP", overlay=true, initial_capital=1000)
// MA
ema_period = input(title='EMA period', defval=10)
wma_period = input(title='WMA period', defval=20)
ema = ta.ema(close, ema_period)
wma = ta.wma(close, wma_period)
// Entry Conditions
long = ta.crossover(ema, wma) and nz(strategy.position_size) == 0
short = ta.crossunder(ema, wma) and nz(strategy.position_size) == 0
// Pips Calculation
pip1 = input(20, title = "TP PIP", group = "PIP CALCULATION") * 10 * syminfo.mintick
pip2 = input(20, title = "SL PIP", group = "PIP CALCULATION") * 10 * syminfo.mintick
// Trading parameters
var bool LS = na
var bool SS = na
var float EP = na // Entry Position
var float TVL = na
var float TVS = na
var float TSL = na
var float TSS = na
var float TP1 = na
//var float TP2 = na
var float SL1 = na
///var float SL2 = na
// SL & TP Values
// there's also SL2 and TP2 in case you want to add them to your script,
//also you can add a break event in the strategy.entry section.
if short or long and strategy.position_size == 0
EP := close
SL1 := EP - pip2 * (short ? -1 : 1)
//SL2 := EP - pip2 * (short ? -1 : 1)
TP1 := EP + pip1 * (short ? -1 : 1)
//TP2 := EP + pip1 * 2 * (short ? -1 : 1)
// current trade direction
LS := long or strategy.position_size > 0
SS := short or strategy.position_size < 0
// adjust trade parameters and trailing stop calculations
TVL := math.max(TP1, open) - pip1[1]
TVS := math.min(TP1, open) + pip1[1]
TSL := open[1] > TSL[1] ? math.max(TVL, TSL[1]) : TVL
TSS := open[1] < TSS[1] ? math.min(TVS, TSS[1]) : TVS
//if LS and high > TP1
//if open <= TP1
//SL2 := math.min(EP, TSL)
//if SS and low < TP1
//if open >= TP1
//SL2 := math.max(EP, TSS)
// Closing conditions
// and those are a closing conditions in case you want to add them.
//close_long = LS and open < SL2
//close_short = SS and open > SL2
// Buy
if (long and not SS)
strategy.entry('buy', strategy.long)
strategy.exit('exit1', from_entry='buy', stop=SL1, limit=TP1, qty_percent=100)
//strategy.exit('exit2', from_entry='buy', stop=SL2, limit=TP2)
// Sell
if (short and not LS)
strategy.entry('sell', strategy.short)
strategy.exit('exit3', from_entry='sell', stop=SL1, limit=TP1, qty_percent=100)
//strategy.exit('exit4', from_entry='sell', stop=SL2, limit=TP2)
// Plots
// those are plots for the lines of The tp and sl. they are really useful, and in the next update I will use a filling option.
a = plot(strategy.position_size > 0 ? SL1 : na, color=color.new(#af0829, 30), linewidth = 2, style=plot.style_linebr)
b = plot(strategy.position_size < 0 ? SL1 : na, color=color.new(#af0829, 30), linewidth = 2, style=plot.style_linebr)
c = plot(strategy.position_size > 0 ? TP1 : na, color=color.new(#2e7e00, 30), linewidth = 2, style=plot.style_linebr)
d = plot(strategy.position_size < 0 ? TP1 : na, color=color.new(#2e7e00, 30), linewidth = 2, style=plot.style_linebr)
g = plot(strategy.position_size >= 0 ? na : EP, color=color.new(#ffffff, 50), style=plot.style_linebr)
h = plot(strategy.position_size <= 0 ? na : EP, color=color.new(#ffffff, 50), style=plot.style_linebr)
// those are plot for the TP2 and SL2, they are optional if you want to add them.
//e = plot(strategy.position_size > 0 ? TP2 : na, color=color.new(#00ced1, 0), style=plot.style_linebr)
//f = plot(strategy.position_size < 0 ? TP2 : na, color=color.new(#00ced1, 0), style=plot.style_linebr)
//those are the plot for the ema and wma strategy for short and long signal. they are not really a good strategy, I just used them as an example
//but you have the option to plot them or not.
// do not use this strategy, it's just an exmaple !! The goal from this script is to show you TP and SL based on PIPS
//plot(ema, title='ema', color=color.new(#fff176, 0))
//plot(wma, title='wma', color=color.new(#00ced1, 0))