Chiến lược dừng lỗ động
Tổng quan
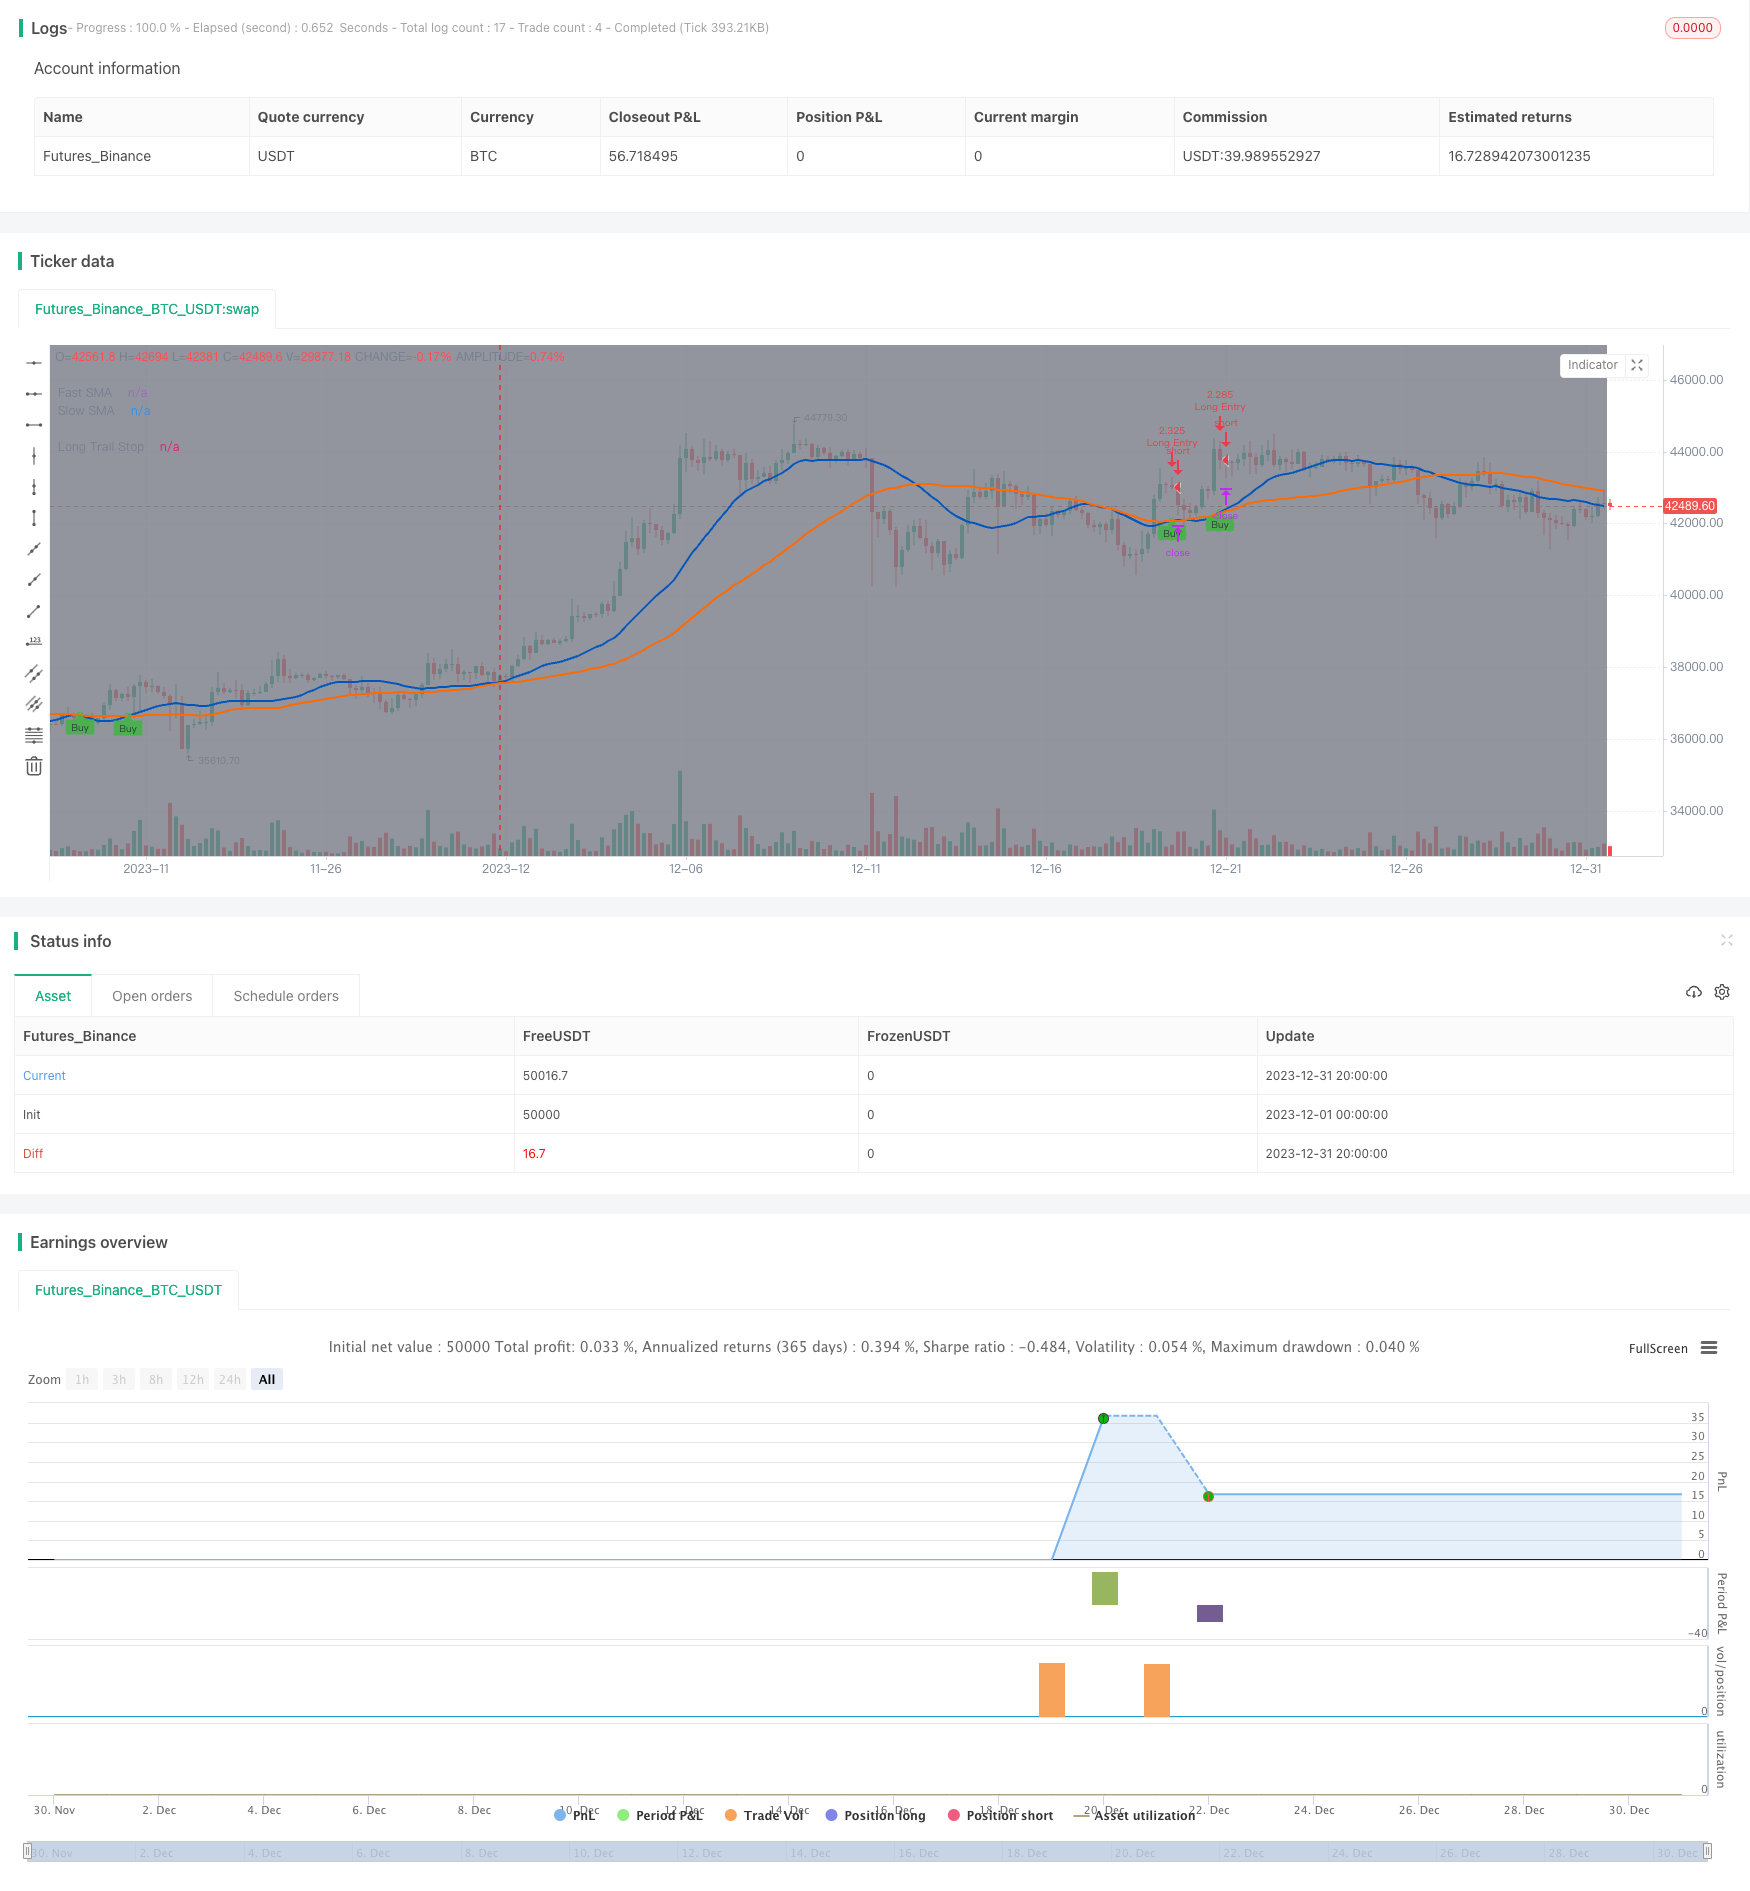
Chiến lược này đánh giá xu hướng bằng cách tính toán chéo giữa đường trung bình di chuyển nhanh và đường trung bình di chuyển chậm, làm nhiều hơn khi đi qua đường trung bình di chuyển chậm trên đường trung bình di chuyển nhanh và thiết lập một đường dừng theo dõi động để khóa lợi nhuận, dừng lỗ và rút ra khi giá thay đổi một tỷ lệ nhất định.
Nguyên tắc chiến lược
Chiến lược này sử dụng đường trung bình di chuyển nhanh và đường trung bình di chuyển chậm để đánh giá sự bắt đầu của xu hướng đa đầu. Cụ thể, tính toán đường trung bình di chuyển đơn giản của giá đóng cửa trong một khoảng thời gian nhất định, so sánh giá trị của đường trung bình di chuyển nhanh và đường trung bình di chuyển chậm.
Sau khi mở nhiều vị trí, chiến lược không thiết lập dừng cố định, nhưng sử dụng một đường dừng theo dõi động để khóa lợi nhuận. Phương pháp thiết lập đường dừng này là:*(1-% Stop Loss được thiết lập). Điều này cho phép Stop Loss Line tăng lên khi giá tăng lên và dừng lại khi giảm một tỷ lệ nhất định.
Ưu điểm của phương pháp này là có thể truy xuất vô hạn và có thể khóa lợi nhuận bằng cách dừng lỗ sau khi lợi nhuận đạt đến một mức nhất định.
Phân tích lợi thế
Các lợi thế chính của chiến lược dừng lỗ theo dõi động này là:
Có thể truy cập vô hạn, không bỏ lỡ các trò chơi lớn. Sử dụng dừng cố định rất dễ dàng bị dừng sau khi bắt đầu các trò chơi lớn.
Bạn có thể khóa lợi nhuận bằng cách thiết lập tỷ lệ dừng lỗ. Nếu chỉ theo đuổi không dừng lỗ, toàn bộ thị trường có thể thua lỗ khi kết thúc.
Thị trường này có tính linh hoạt hơn so với lệnh dừng cố định. Thị trường dừng cố định chỉ có thể đặt một mức giá, trong khi lệnh dừng ở đây thay đổi theo mức giá cao nhất.
Rủi ro rút lui thấp hơn. Khi sử dụng dừng cố định, giá dừng từ giá cao nhất lớn hơn, có thể bị dừng trong hồi phục bình thường. Ở đây, dừng gần giá cao nhất, hồi phục bình thường sẽ không bị dừng.
Phân tích rủi ro
Chiến lược này cũng có một số rủi ro:
Các chỉ số của tín hiệu nhập cảnh không ổn định, có thể tạo ra tín hiệu sai.
Cách dừng lỗ đơn lẻ, không xem xét các yếu tố khác. Thị trường có thể đột ngột thay đổi đáng kể dẫn đến chiến lược không hiệu quả.
Không có giới hạn dừng, phụ thuộc vào dừng lỗ. Nếu dừng lỗ không hiệu quả, có thể gây ra tổn thất lớn hơn.
Cài đặt dữ liệu cần được tối ưu hóa. Các tham số như chu kỳ trung bình di chuyển cần được điều chỉnh tối ưu.
Hướng tối ưu hóa
Chiến lược này cũng có thể được tối ưu hóa theo các khía cạnh sau:
Thêm thêm các chỉ số để xác nhận và tránh các tín hiệu sai. Ví dụ: thêm các phán đoán về số lượng giao dịch.
Tăng thiết lập dừng. Khi thu nhập đạt được một tỷ lệ nhất định, dừng.
Tăng độ an toàn khi dừng lỗ. Điều chỉnh khoảng cách dừng lỗ một cách mạnh mẽ khi thị trường xảy ra bất thường.
Điều chỉnh tối ưu hóa cho các loại giao dịch, thời gian giao dịch, v.v. Các tham số khác nhau của các loại và thời gian giao dịch cần điều chỉnh.
Thêm học máy để điều chỉnh các tham số một cách động. Cho phép mô hình tự động tối ưu hóa các chỉ số phán đoán và mức độ dừng lỗ.
Tóm tắt
Các chỉ số và tham số này cần được kiểm tra và tối ưu hóa liên tục để làm cho chiến lược ổn định và có lợi nhuận. Đồng thời, cũng cần phòng ngừa ảnh hưởng của những thay đổi lớn của thị trường đối với chiến lược, điều này cần được thực hiện bằng cách hoàn thiện tư duy và khuôn khổ tổng thể, tăng cơ chế an toàn.
/*backtest
start: 2023-12-01 00:00:00
end: 2023-12-31 23:59:59
period: 4h
basePeriod: 15m
exchanges: [{"eid":"Futures_Binance","currency":"BTC_USDT"}]
*/

//@version=4
//
// ▒▒▒▒▒▒▒▒▒▒▒▒▒▒▒▒▒▒▒▒▒▒▒▒▒▒▒▒▒▒▒▒▒▒▒▒▒▒▒▒▒▒▒▒▒▒▒▒▒▒▒▒▒▒▒▒▒▒▒▒▒▒▒▒▒▒▒▒▒▒▒▒▒▒▒▒▒▒▒▒▒▒▒▒▒▒▒▒▒▒▒▒▒▒▒▒▒▒▒▒▒▒▒▒▒▒▒▒▒▒▒▒▒▒
//  -----------------------------------------------------------------------------
//  Copyright 2021 Iason Nikolas | jason5480
//  Trainiling Take Profit Trailing Stop Loss script may be freely distributed under the MIT license.
//
//  Permission is hereby granted, free of charge,
//  to any person obtaining a copy of this software and associated documentation files (the "Software"),
//  to deal in the Software without restriction, including without limitation the rights to use, copy, modify, merge,
//  publish, distribute, sublicense, and/or sell copies of the Software, and to permit persons to whom the Software is furnished to do so,
//  subject to the following conditions:
//
//  The above copyright notice and this permission notice shall be included in all copies or substantial portions of the Software.
//
//  THE SOFTWARE IS PROVIDED "AS IS", WITHOUT WARRANTY OF ANY KIND,
//  EXPRESS OR IMPLIED, INCLUDING BUT NOT LIMITED TO THE WARRANTIES OF MERCHANTABILITY,
//  FITNESS FOR A PARTICULAR PURPOSE AND NONINFRINGEMENT. IN NO EVENT SHALL THE AUTHORS OR COPYRIGHT HOLDERS BE LIABLE FOR ANY CLAIM,
//  DAMAGES OR OTHER LIABILITY, WHETHER IN AN ACTION OF CONTRACT, TORT OR OTHERWISE, ARISING FROM,
//  OUT OF OR IN CONNECTION WITH THE SOFTWARE OR THE USE OR OTHER DEALINGS IN THE SOFTWARE.
//
//  -----------------------------------------------------------------------------
//
//  Authors:  @jason5480
//  Revision: v1.0.0
//  Date:     05-May-2021
//
//  Description
//  =============================================================================
//  This strategy will go long if fast MA crosses over slow MA.
//  The strategy will exit from long position when the price increases by a fixed percentage.
//  If the trailing take profit is checked then the strategy instead of setting a limit order in a predefined price (based on the percentage)
//  it will follow the price with small steps (percentagewise)
//  If the price drops by this percentage then the exit order will be executed
//
//  The strategy has the following parameters:
//
//  Fast SMA Length - How many candles back to calculte the fast SMA.
//  Slow SMA Length - How many candles back to calculte the slow SMA.
//  Enable Trailing - Enable or disable the trailing.
//  Stop Loss % - The percentage of the price decrease to set the stop loss price target for long positions.
//
//  -----------------------------------------------------------------------------
//  Disclaimer:
//    1. I am not licensed financial advisors or broker dealer. I do not tell you
//       when or what to buy or sell. I developed this software which enables you
//       execute manual or automated trades using TradingView. The
//       software allows you to set the criteria you want for entering and exiting
//       trades.
//    2. Do not trade with money you cannot afford to lose.
//    3. I do not guarantee consistent profits or that anyone can make money with no
//       effort. And I am not selling the holy grail.
//    4. Every system can have winning and losing streaks.
//    5. Money management plays a large role in the results of your trading. For
//       example: lot size, account size, broker leverage, and broker margin call
//       rules all have an effect on results. Also, your Take Profit and Stop Loss
//       settings for individual pair trades and for overall account equity have a
//       major impact on results. If you are new to trading and do not understand
//       these items, then I recommend you seek education materials to further your
//       knowledge.
//
//    YOU NEED TO FIND AND USE THE TRADING SYSTEM THAT WORKS BEST FOR YOU AND YOUR
//    TRADING TOLERANCE.
//
//    I HAVE PROVIDED NOTHING MORE THAN A TOOL WITH OPTIONS FOR YOU TO TRADE WITH THIS PROGRAM ON TRADINGVIEW.
//
//    I accept suggestions to improve the script.
//    If you encounter any problems I will be happy to share with me.
//  -----------------------------------------------------------------------------
//
// ▒▒▒▒▒▒▒▒▒▒▒▒▒▒▒▒▒▒▒▒▒▒▒▒▒▒▒▒▒▒▒▒▒▒▒▒▒▒▒▒▒▒▒▒▒▒▒▒▒▒▒▒▒▒▒▒▒▒▒▒▒▒▒▒▒▒▒▒▒▒▒▒▒▒▒▒▒▒▒▒▒▒▒▒▒▒▒▒▒▒▒▒▒▒▒▒▒▒▒▒▒▒▒▒▒▒▒▒▒▒▒▒▒▒
// SETUP ============================================================================================================
strategy(title = "Trailing Stop Loss",
         shorttitle = "TSL",
         overlay = true,
         pyramiding = 0,
         calc_on_every_tick = true,
         default_qty_type = strategy.cash,
         default_qty_value = 100000,
         initial_capital = 100000)

//
// ▒▒▒▒▒▒▒▒▒▒▒▒▒▒▒▒▒▒▒▒▒▒▒▒▒▒▒▒▒▒▒▒▒▒▒▒▒▒▒▒▒▒▒▒▒▒▒▒▒▒▒▒▒▒▒▒▒▒▒▒▒▒▒▒▒▒▒▒▒▒▒▒▒▒▒▒▒▒▒▒▒▒▒▒▒▒▒▒▒▒▒▒▒▒▒▒▒▒▒▒▒▒▒▒▒▒▒▒▒▒▒▒▒▒
// INPUTS ===========================================================================================================

// STRATEGY INPUT ===================================================================================================
fastMALen = input(defval = 21, title = "Fast SMA Length", type = input.integer, group = "Strategy", tooltip = "How many candles back to calculte the fast SMA.")
slowMALen = input(defval = 49, title = "Slow SMA Length", type = input.integer, group = "Strategy", tooltip = "How many candles back to calculte the slow SMA.")

enableStopLossTrailing = input(defval = true, title = "Enable Trailing", type = input.bool, group = "Strategy", tooltip = "Enable or disable the trailing for stop loss.")
longTrailingStopLossPerc = input(defval = 7.5, title = 'Long Stop Loss %', type = input.float, minval = 0.1, maxval = 100, step = 0.1, inline = "Trailing Stop Loss Perc", group = "Strategy") / 100

// BACKTEST PERIOD INPUT ============================================================================================
fromDate = input(defval = timestamp("01 Jan 2021 00:00 UTC"), title = "From Date", type = input.time, minval = timestamp("01 Jan 1970 00:00 UTC"), group = "Backtest Period") // backtest start date
toDate   = input(defval = timestamp("31 Dec 2121 23:59 UTC"), title = "To Date",   type = input.time, minval = timestamp("01 Jan 1970 00:00 UTC"), group = "Backtest Period") // backtest finish date

isWithinBacktestPeriod() => true

// SHOW PLOT INPUT ==================================================================================================
showDate = input(defval = true, title = "Show Backtest Range", type = input.bool, group = "Plot", tooltip = "Gray out the backround of the backtest period.")

//
// ▒▒▒▒▒▒▒▒▒▒▒▒▒▒▒▒▒▒▒▒▒▒▒▒▒▒▒▒▒▒▒▒▒▒▒▒▒▒▒▒▒▒▒▒▒▒▒▒▒▒▒▒▒▒▒▒▒▒▒▒▒▒▒▒▒▒▒▒▒▒▒▒▒▒▒▒▒▒▒▒▒▒▒▒▒▒▒▒▒▒▒▒▒▒▒▒▒▒▒▒▒▒▒▒▒▒▒▒▒▒▒▒▒▒
// STRATEGY LOGIC ===================================================================================================

fastMA = sma(close, fastMALen)
slowMA = sma(close, slowMALen)

bool startLongDeal = crossover(fastMA, slowMA)

bool longIsActive = startLongDeal or strategy.position_size > 0

// determine trailing stop loss price
float longTrailingStopLossPrice = na
longTrailingStopLossPrice := if (longIsActive)
    stopValue = high * (1 - longTrailingStopLossPerc)
    max(stopValue, nz(longTrailingStopLossPrice[1]))
else
    na

//
// ▒▒▒▒▒▒▒▒▒▒▒▒▒▒▒▒▒▒▒▒▒▒▒▒▒▒▒▒▒▒▒▒▒▒▒▒▒▒▒▒▒▒▒▒▒▒▒▒▒▒▒▒▒▒▒▒▒▒▒▒▒▒▒▒▒▒▒▒▒▒▒▒▒▒▒▒▒▒▒▒▒▒▒▒▒▒▒▒▒▒▒▒▒▒▒▒▒▒▒▒▒▒▒▒▒▒▒▒▒▒▒▒▒▒
// STRATEGY EXECUTION ===============================================================================================

if (isWithinBacktestPeriod())
    // getting into LONG position
    strategy.entry(id = "Long Entry", long = strategy.long, when = startLongDeal, alert_message = "Long(" + syminfo.ticker + "): Started")
    // submit exit orders for trailing stop loss price
    strategy.exit(id = "Long Stop Loss", from_entry = "Long Entry", stop = longTrailingStopLossPrice, when = longIsActive, alert_message = "Long(" + syminfo.ticker + "): Stop Loss activated")


//
// ▒▒▒▒▒▒▒▒▒▒▒▒▒▒▒▒▒▒▒▒▒▒▒▒▒▒▒▒▒▒▒▒▒▒▒▒▒▒▒▒▒▒▒▒▒▒▒▒▒▒▒▒▒▒▒▒▒▒▒▒▒▒▒▒▒▒▒▒▒▒▒▒▒▒▒▒▒▒▒▒▒▒▒▒▒▒▒▒▒▒▒▒▒▒▒▒▒▒▒▒▒▒▒▒▒▒▒▒▒▒▒▒▒▒
// PLOT DATE POSITION MA AND TRAILING TAKE PROFIT STOP LOSS =========================================================

bgcolor(color = showDate and isWithinBacktestPeriod() ? color.gray : na, transp = 90)

plot(series = fastMA, title = "Fast SMA", color = #0056BD, linewidth = 2, style = plot.style_line)
plot(series = slowMA, title = "Slow SMA", color = #FF6A00, linewidth = 2, style = plot.style_line)
plotshape(series = isWithinBacktestPeriod() and startLongDeal and strategy.position_size <= 0 ? fastMA : na, title = "UpTrend Begins", style = shape.circle, location = location.absolute, color = color.green, transp = 0, size = size.tiny)
plotshape(series = isWithinBacktestPeriod() and startLongDeal and strategy.position_size <= 0 ? fastMA : na, title = "Buy", text = "Buy", style = shape.labelup, location = location.absolute, color = color.green, textcolor = color.black, transp = 0, size = size.tiny)

plot(series = strategy.position_avg_price, title = "Position", color = color.blue, linewidth = 2, style = plot.style_linebr, offset = 1)
plot(series = longTrailingStopLossPrice, title = "Long Trail Stop", color = color.fuchsia, linewidth = 2, style = plot.style_linebr, offset = 1)

// ==================================================================================================================