Chiến lược xu hướng động lượng ADX

Tổng quan
Chiến lược này dựa trên chỉ báo ADX để đánh giá xu hướng thị trường, kết hợp với chỉ báo DMI để xác định hướng tăng/giảm, sử dụng độ dốc ADX để đánh giá sức mạnh xu hướng, thiết lập giá trị khóa ADX để lọc các thị trường không có xu hướng, và hỗ trợ thêm đường trung bình động để lọc tín hiệu giao dịch.
Nguyên lý chiến lược
- Tính toán các chỉ báo ADX, DI+, DI-.
- Độ dốc ADX > 0 cho thấy xu hướng đang tăng cường; giá trị khóa được đặt là 23, dùng để lọc các thị trường không có xu hướng.
- DI+ cao hơn DI- cho thấy lực lượng mua mạnh hơn lực lượng bán, là tín hiệu mua.
- Khi bật bộ lọc đường trung bình động, chỉ khi giá đóng cửa cao hơn đường trung bình động mới phát sinh tín hiệu tăng.
- Đóng vị thế khi độ dốc ADX < 0, cho thấy xu hướng đang suy yếu.
Phân tích ưu điểm
- Hỗ trợ bộ lọc MA giúp giảm các giao dịch nhiễu ở thị trường không có xu hướng.
- Độ dốc ADX đánh giá sức mạnh, có thể xác định chính xác sự phát triển của xu hướng.
- DI xác định hướng kết hợp với ADX đánh giá sức mạnh tạo thành hệ thống ra quyết định giao dịch theo xu hướng tương đối hoàn chỉnh.
- Tỷ lệ sụt giảm và tỷ lệ lợi nhuận/rủi ro có thể tốt hơn so với chiến lược đường trung bình động đơn giản.
Phân tích rủi ro
- Các tham số khác nhau của chỉ báo ADX sẽ dẫn đến kết quả khác biệt lớn.
- Trước khi DMI xác định hoàn toàn hướng tăng/giảm, có thể phát ra tín hiệu sai.
- Tồn tại độ trễ nhất định, làm giảm hiệu quả của chiến lược.
Hướng tối ưu hóa
- Tối ưu hóa tổ hợp tham số ADX để tìm ra tham số tốt nhất.
- Thêm chiến lược cắt lỗ để tránh mở rộng tổn thất đơn lẻ.
- Thử kết hợp với các chỉ báo khác để lọc tín hiệu, ví dụ RSI, Bollinger Bands.
Tổng kết
Chiến lược này tận dụng tối đa ưu điểm của ADX trong việc đánh giá xu hướng và sức mạnh xu hướng, kết hợp với chỉ báo DMI để xác định hướng, tạo thành hệ thống theo dõi xu hướng hoàn chỉnh. Đồng thời, đường trung bình động hỗ trợ có thể lọc hiệu quả nhiễu từ các thị trường không có xu hướng. Tối ưu hóa tham số và kết hợp chỉ báo còn có thể cải thiện thêm tính ổn định và hiệu quả của chiến lược. Nhìn chung, chiến lược này kết hợp đặc điểm đánh giá xu hướng và xác định hướng, có khả năng mang lại lợi nhuận tốt.
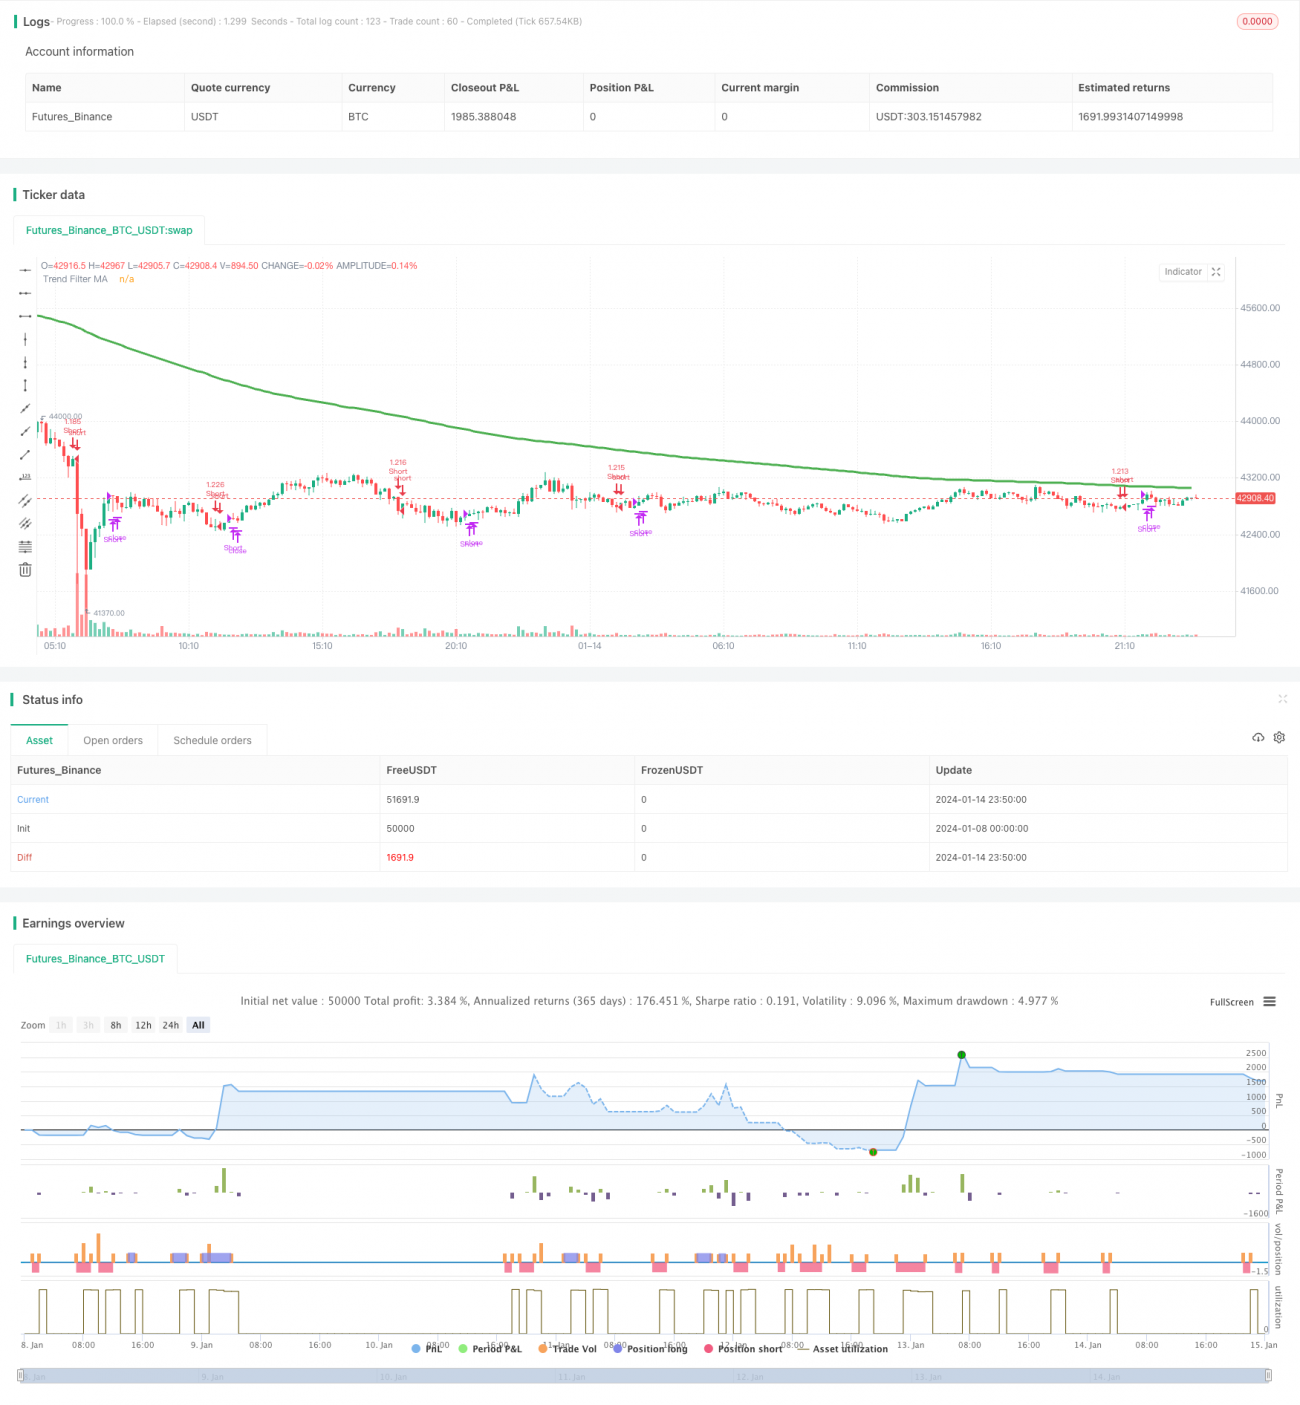
/*backtest
start: 2024-01-08 00:00:00
end: 2024-01-15 00:00:00
period: 10m
basePeriod: 1m
exchanges: [{"eid":"Futures_Binance","currency":"BTC_USDT"}]
*/

//@version=4
// This source code is subject to the terms of the Mozilla Public License 2.0 at https://mozilla.org/MPL/2.0/
// © millerrh with inspiration from @9e52f12edd034d28bdd5544e7ff92e
//The intent behind this study is to look at ADX when it has an increasing slope and is above a user-defined key level (23 default). - 1