Chiến lược theo xu hướng kết hợp EMA kép và RSI
Tổng quan
Chiến lược này sử dụng các chỉ số EMA và RSI để xác định xu hướng giá bằng cách kết hợp sử dụng các chỉ số EMA và RSI để xác định xu hướng giá và tham gia vào thời điểm chuyển hướng xu hướng. Cụ thể, chiến lược sử dụng các EMA có chu kỳ dài hơn để xác định xu hướng xu hướng lớn, đồng thời sử dụng các chỉ số RSI để xác định hiện tượng bán tháo quá mức trong thời gian ngắn.
Nguyên tắc chiến lược
Sử dụng EMA 200 chu kỳ để xác định hướng của xu hướng lớn. Đường EMA trên là tín hiệu đi lên, đường EMA dưới là tín hiệu đi xuống.
Các tham số của chỉ số RSI được thiết lập là 10 chu kỳ. Trong đó, RSI vượt qua 40 là tín hiệu bán tháo và vượt qua 60 là tín hiệu mua quá mức.
Khi xu hướng lớn là tăng (giá cao hơn đường EMA), nếu có tín hiệu bán tháo 40 dưới chỉ số RSI, hãy tham gia thêm.
Khi xu hướng lớn là đi xuống (giá thấp hơn đường EMA), nếu xảy ra tín hiệu mua quá mức 60 trên chỉ số RSI, hãy tham gia vào.
Cài đặt Stop Loss là 4 lần so với chỉ số ATR. Cài đặt Stop Loss là 2 lần so với Stop Loss, đạt tỷ lệ rủi ro / lợi nhuận 2: 1.
Phân tích lợi thế
Ưu điểm lớn nhất của chiến lược này là kết hợp cả xu hướng và chỉ số đảo ngược, có thể tham gia vào thời điểm khi xu hướng bị rút lại, do đó có thể đạt được hiệu suất tốt hơn. Các lợi thế cụ thể như sau:
Sử dụng hệ thống EMA kép để đánh giá xu hướng chính, có thể theo dõi xu hướng giá một cách hiệu quả.
Chỉ số RSI có thể xác định tình trạng quá mua và quá bán trong thời gian ngắn, hỗ trợ xác định thời điểm tham gia.
Giảm lỗ được thiết lập thông qua chỉ số ATR, có thể điều chỉnh mức độ dừng lỗ theo biến động của thị trường, có lợi cho kiểm soát rủi ro.
Theo dõi chặt chẽ các nguyên tắc giao dịch theo xu hướng có thể làm giảm giao dịch không cần thiết và giảm rủi ro hệ thống.
Phân tích rủi ro
Chiến lược này có những rủi ro:
Trong quá trình suy yếu của xu hướng, có thể có tín hiệu giao dịch sai.
Trong trường hợp cực đoan, mức dừng được thiết lập cho chỉ số ATR có thể quá lớn hoặc quá nhỏ, cần điều chỉnh động. Ngoài ra, bạn cũng có thể xem xét thay thế bằng các phương pháp dừng khác.
Các tín hiệu giao dịch có thể được tạo ra với tần số cao hơn, cần chú ý đến việc phù hợp với sở thích tần số giao dịch của riêng bạn.
Cần chú ý xem RSI có được thiết lập đúng hay không và tối ưu hóa các tham số khi thích hợp.
Hướng tối ưu hóa
Chiến lược này có thể được tối ưu hóa như sau:
Các chỉ số xu hướng khác có thể được thử nghiệm, chẳng hạn như MACD, để hỗ trợ xác định hướng xu hướng.
Có thể thử nghiệm các chỉ số đảo ngược khác như KDJ, Blink và RSI để tìm tín hiệu giao dịch tốt hơn.
Có thể giới thiệu các thuật toán học máy để thực hiện dừng và dừng động bằng cách điều chỉnh các tham số tự thích ứng.
Có thể kết hợp các yếu tố khác như chỉ số cảm xúc, mặt tin tức để đánh giá và cải thiện sức khỏe tổng thể của hệ thống.
Tóm tắt
Chiến lược này nói chung là một chiến lược ngắn gọn rất điển hình kết hợp theo dõi xu hướng và chỉ số đảo ngược. Bằng cách sử dụng hai EMA để đánh giá xu hướng lớn, đồng thời sử dụng tính năng đảo ngược của chỉ số RSI để nắm bắt cơ hội Pullback trong xu hướng. Về nguyên tắc, chiến lược này kết hợp các ưu điểm của các chỉ số khác nhau với nhau, FORM có hiệu quả bổ sung tốt.
/*backtest
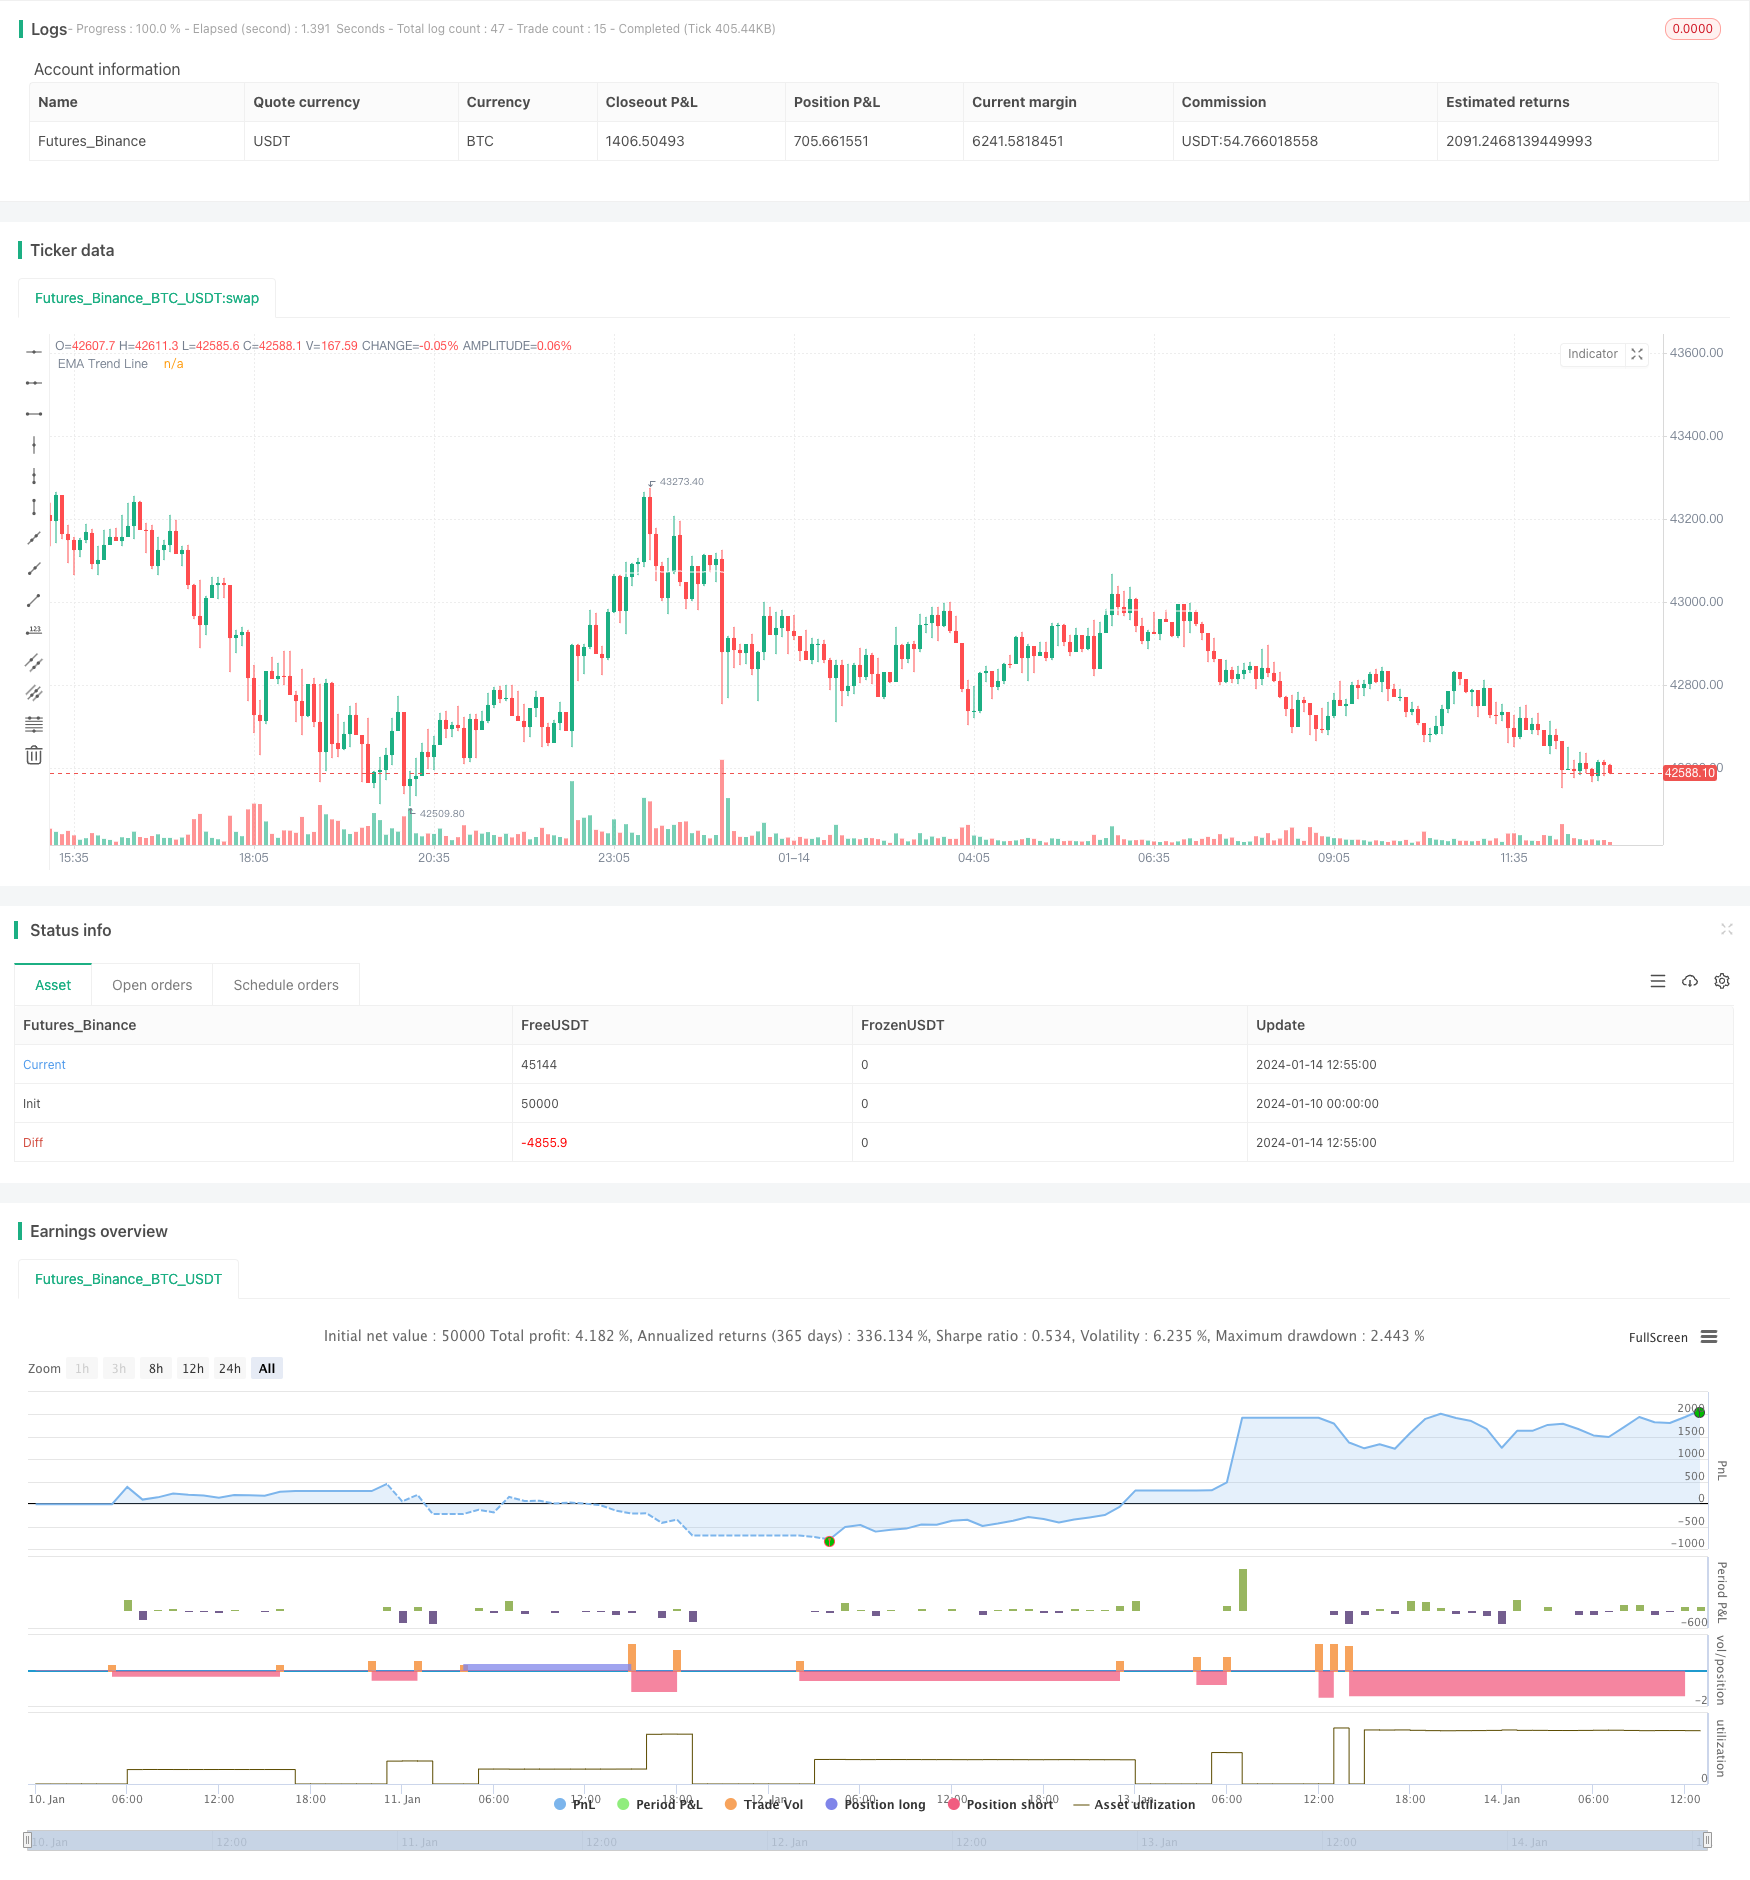
start: 2024-01-10 00:00:00
end: 2024-01-14 13:00:00
period: 5m
basePeriod: 1m
exchanges: [{"eid":"Futures_Binance","currency":"BTC_USDT"}]
*/
// This source code is subject to the terms of the Mozilla Public License 2.0 at https://mozilla.org/MPL/2.0/
// © kevinmck100
// @description
// This strategy is intended to be used as a base template for building new strategies.
//
// It incorporates the following features:
//
// - Risk management: Configurable X% loss per stop loss
// Configurable R:R ratio
//
// - Trade entry: Calculated position size based on risk tolerance
//
// - Trade exit: Stop Loss currently configurable ATR multiplier but can be replaced based on strategy
// Take Profit calculated from Stop Loss using R:R ratio
//
// - Backtesting: Configurable backtesting range by date
//
// - Trade drawings: TP/SL boxes drawn for all trades. Can be turned on and off
// Trade exit information labels. Can be turned on and off
// NOTE: Trade drawings will only be applicable when using overlay strategies
//
// - Debugging: Includes section with useful debugging techniques
//
// Strategy conditions:
//
// - Trade entry: LONG: C1: Price is above EMA line
// C2: RSI is crossing out of oversold area
// SHORT: C1: Price is below EMA line
// C2: RSI is crossing out of overbought area
//
// - Trade exit: Stop Loss: Stop Loss ATR multiplier is hit
// Take Profit: R:R multiplier * Stop Loss is hit
//
// The idea is to use RSI to catch pullbacks within the main trend. Note that
// this strategy is intended to be a simple base strategy for building upon.
// It was not designed to be traded in its current form.
//@version=5
INITIAL_CAPITAL = 1000
DEFAULT_COMMISSION = 0.02
MAX_DRAWINGS = 500
IS_OVERLAY = true
strategy("Risk Management Strategy Template", "Strategy Template", overlay = IS_OVERLAY, initial_capital = INITIAL_CAPITAL, currency = currency.NONE, max_labels_count = MAX_DRAWINGS, max_boxes_count = MAX_DRAWINGS, max_lines_count = MAX_DRAWINGS, default_qty_type = strategy.cash, commission_type = strategy.commission.percent, commission_value = DEFAULT_COMMISSION)
// =============================================================================
// INPUTS
// =============================================================================
// ------------------------ Replacable section - Start -------------------------
// ------------------
// Indicator Settings
// ------------------
emaLength = input.int (200, "EMA Length ", group = "Indicators: Settings", inline = "IS1", minval = 1, tooltip = "EMA line to identify trend direction. Above EMA trend line is bullish. Below EMA trend line is bearish")
rsiLength = input.int (10, "RSI Length ", group = "Indicators: Settings", inline = "IS2", minval = 1)
// ----------------------
// Trade Entry Conditions
// ----------------------
rsiOverbought = input.int (60, "RSI Overbought ", group = "Strategy: Conditions", inline = "SC1", minval = 50, maxval = 100, tooltip = "RSI overbought level used to identify pullbacks within the main trend. RSI crossing BELOW this level triggers a SHORT when in a DOWN trend")
rsiOversold = input.int (40, "RSI Oversold ", group = "Strategy: Conditions", inline = "SC2", minval = 0, maxval = 50, tooltip = "RSI overbought level used to identify pullbacks within the main trend. RSI crossing ABOVE this level triggers a LONG when in an UP trend")
// ---------------------
// Trade Exit Conditions
// ---------------------
atrLength = input.int (14, "Stop Loss ATR Length ", group = "Strategy: Exit Conditions", inline = "EC1", minval = 0, tooltip = "Length of ATR used to calculate Stop Loss.")
slAtrMultiplier = input.float(4, "Stop Loss ATR Multiplier ", group = "Strategy: Exit Conditions", inline = "EC2", minval = 0, step = 0.1, tooltip = "Size of StopLoss is determined by multiplication of ATR value. Take Profit is derived from this also by multiplying the StopLoss value by the Risk:Reward multiplier.")
// ------------------------- Replacable section - End --------------------------
// ---------------
// Risk Management
// ---------------
riskReward = input.float(2, "Risk : Reward 1 :", group = "Strategy: Risk Management", inline = "RM1", minval = 0, step = 0.1, tooltip = "Previous high or low (long/short dependant) is used to determine TP level. 'Risk : Reward' ratio is then used to calculate SL based of previous high/low level.\n\nIn short, the higher the R:R ratio, the smaller the SL since TP target is fixed by previous high/low price data.")
accountRiskPercent = input.float(1, "Portfolio Risk % ", group = "Strategy: Risk Management", inline = "RM1", minval = 0, step = 0.1, tooltip = "Percentage of portfolio you lose if trade hits SL.\n\nYou then stand to gain\n Portfolio Risk % * Risk : Reward\nif trade hits TP.")
// ----------
// Date Range
// ----------
startYear = input.int (2022, "Start Date ", group = 'Strategy: Date Range', inline = 'DR1', minval = 1900, maxval = 2100)
startMonth = input.int (1, "", group = 'Strategy: Date Range', inline = 'DR1', options = [1, 2, 3, 4, 5, 6, 7, 8, 9, 10, 11, 12])
startDate = input.int (1, "", group = 'Strategy: Date Range', inline = 'DR1', options = [1, 2, 3, 4, 5, 6, 7, 8, 9, 10, 11, 12, 13, 14, 15, 16, 17, 18, 19, 20, 21, 22, 23, 24, 25, 26, 27, 28, 29, 30, 31])
endYear = input.int (2100, "End Date ", group = 'Strategy: Date Range', inline = 'DR2', minval = 1900, maxval = 2100)
endMonth = input.int (1, "", group = 'Strategy: Date Range', inline = 'DR2', options = [1, 2, 3, 4, 5, 6, 7, 8, 9, 10, 11, 12])
endDate = input.int (1, "", group = 'Strategy: Date Range', inline = 'DR2', options = [1, 2, 3, 4, 5, 6, 7, 8, 9, 10, 11, 12, 13, 14, 15, 16, 17, 18, 19, 20, 21, 22, 23, 24, 25, 26, 27, 28, 29, 30, 31])
// ----------------
// Drawing Settings
// ----------------
showTpSlBoxes = input.bool(false, "Show TP / SL Boxes", group = "Strategy: Drawings", inline = "D1", tooltip = "Show or hide TP and SL position boxes.\n\nNote: TradingView limits the maximum number of boxes that can be displayed to 500 so they may not appear for all price data under test.")
showLabels = input.bool(false, "Show Trade Exit Labels", group = "Strategy: Drawings", inline = "D2", tooltip = "Useful labels to identify Profit/Loss and cumulative portfolio capital after each trade closes.\n\nAlso note that TradingView limits the max number of 'boxes' that can be displayed on a chart (max 500). This means when you lookback far enough on the chart you will not see the TP/SL boxes. However you can check this option to identify where trades exited.")
// =============================================================================
// INDICATORS
// =============================================================================
// ------------------------ Replacable section - Start -------------------------
// ---
// EMA
// ---
ema = ta.ema(close, emaLength)
plot(ema, "EMA Trend Line", color.white)
// ---
// RSI
// ---
rsi = ta.rsi(close, rsiLength)
// ------------------------- Replacable section - End --------------------------
// =============================================================================
// STRATEGY LOGIC
// =============================================================================
// ---------
// FUNCTIONS
// ---------
percentAsPoints(pcnt) =>
math.round(pcnt / 100 * close / syminfo.mintick)
calcStopLossPrice(pointsOffset, isLong) =>
priceOffset = pointsOffset * syminfo.mintick
if isLong
close - priceOffset
else
close + priceOffset
calcProfitTrgtPrice(pointsOffset, isLong) =>
calcStopLossPrice(-pointsOffset, isLong)
printLabel(barIndex, msg) => label.new(barIndex, close, msg)
printTpSlHitBox(left, right, slHit, tpHit, entryPrice, slPrice, tpPrice) =>
if showTpSlBoxes
box.new (left = left, top = entryPrice, right = right, bottom = slPrice, bgcolor = slHit ? color.new(color.red, 60) : color.new(color.gray, 90), border_width = 0)
box.new (left = left, top = entryPrice, right = right, bottom = tpPrice, bgcolor = tpHit ? color.new(color.green, 60) : color.new(color.gray, 90), border_width = 0)
line.new(x1 = left, y1 = entryPrice, x2 = right, y2 = entryPrice, color = color.new(color.yellow, 20))
line.new(x1 = left, y1 = slPrice, x2 = right, y2 = slPrice, color = color.new(color.red, 20))
line.new(x1 = left, y1 = tpPrice, x2 = right, y2 = tpPrice, color = color.new(color.green, 20))
printTpSlNotHitBox(left, right, entryPrice, slPrice, tpPrice) =>
if showTpSlBoxes
box.new (left = left, top = entryPrice, right = right, bottom = slPrice, bgcolor = color.new(color.gray, 90), border_width = 0)
box.new (left = left, top = entryPrice, right = right, bottom = tpPrice, bgcolor = color.new(color.gray, 90), border_width = 0)
line.new(x1 = left, y1 = entryPrice, x2 = right, y2 = entryPrice, color = color.new(color.yellow, 20))
line.new(x1 = left, y1 = slPrice, x2 = right, y2 = slPrice, color = color.new(color.red, 20))
line.new(x1 = left, y1 = tpPrice, x2 = right, y2 = tpPrice, color = color.new(color.green, 20))
printTradeExitLabel(x, y, posSize, entryPrice, pnl) =>
if showLabels
labelStr = "Position Size: " + str.tostring(math.abs(posSize), "#.##") + "\nPNL: " + str.tostring(pnl, "#.##") + "\nCapital: " + str.tostring(strategy.equity, "#.##") + "\nEntry Price: " + str.tostring(entryPrice, "#.##")
label.new(x = x, y = y, text = labelStr, color = pnl > 0 ? color.new(color.green, 60) : color.new(color.red, 60), textcolor = color.white, style = label.style_label_down)
// ----------
// CONDITIONS
// ----------
inDateRange = time >= timestamp(syminfo.timezone, startYear, startMonth, startDate, 0, 0) and time < timestamp(syminfo.timezone, endYear, endMonth, endDate, 0, 0)
// ------------------------ Replacable section - Start -------------------------
// Condition 1: Price above EMA indicates bullish trend, price below EMA indicates bearish trend
bullEma = close > ema
bearEma = close < ema
// Condition 2: RSI crossing back from overbought/oversold indicates pullback within trend
bullRsi = ta.crossover (rsi, rsiOversold)
bearRsi = ta.crossunder (rsi, rsiOverbought)
// Combine all entry conditions
goLong = inDateRange and bullEma and bullRsi
goShort = inDateRange and bearEma and bearRsi
// ------------------------- Replacable section - End --------------------------
// Trade entry and exit variables
var tradeEntryBar = bar_index
var profitPoints = 0.
var lossPoints = 0.
var slPrice = 0.
var tpPrice = 0.
var inLong = false
var inShort = false
// Entry decisions
openLong = (goLong and not inLong)
openShort = (goShort and not inShort)
flippingSides = (goLong and inShort) or (goShort and inLong)
enteringTrade = openLong or openShort
inTrade = inLong or inShort
// ------------------------ Replacable section - Start -------------------------
// Exit calculations
atr = ta.atr(atrLength)
slAmount = atr * slAtrMultiplier
slPercent = math.abs((1 - (close - slAmount) / close) * 100)
tpPercent = slPercent * riskReward
// ------------------------- Replacable section - End --------------------------
// Risk calculations
riskAmt = strategy.equity * accountRiskPercent / 100
entryQty = math.abs(riskAmt / slPercent * 100) / close
if openLong
if strategy.position_size < 0
printTpSlNotHitBox(tradeEntryBar + 1, bar_index + 1, strategy.position_avg_price, slPrice, tpPrice)
printTradeExitLabel(bar_index + 1, math.max(tpPrice, slPrice), strategy.position_size, strategy.position_avg_price, strategy.openprofit)
strategy.entry("Long", strategy.long, qty = entryQty, alert_message = "Long Entry")
enteringTrade := true
inLong := true
inShort := false
if openShort
if strategy.position_size > 0
printTpSlNotHitBox(tradeEntryBar + 1, bar_index + 1, strategy.position_avg_price, slPrice, tpPrice)
printTradeExitLabel(bar_index + 1, math.max(tpPrice, slPrice), strategy.position_size, strategy.position_avg_price, strategy.openprofit)
strategy.entry("Short", strategy.short, qty = entryQty, alert_message = "Short Entry")
enteringTrade := true
inShort := true
inLong := false
if enteringTrade
profitPoints := percentAsPoints(tpPercent)
lossPoints := percentAsPoints(slPercent)
slPrice := calcStopLossPrice(lossPoints, openLong)
tpPrice := calcProfitTrgtPrice(profitPoints, openLong)
tradeEntryBar := bar_index
strategy.exit("TP/SL", profit = profitPoints, loss = lossPoints, comment_profit = "TP Hit", comment_loss = "SL Hit", alert_profit = "TP Hit Alert", alert_loss = "SL Hit Alert")
// =============================================================================
// DRAWINGS
// =============================================================================
// -----------
// TP/SL Boxes
// -----------
slHit = (inShort and high >= slPrice) or (inLong and low <= slPrice)
tpHit = (inLong and high >= tpPrice) or (inShort and low <= tpPrice)
exitTriggered = slHit or tpHit
entryPrice = strategy.closedtrades.entry_price (strategy.closedtrades - 1)
pnl = strategy.closedtrades.profit (strategy.closedtrades - 1)
posSize = strategy.closedtrades.size (strategy.closedtrades - 1)
// Print boxes for trades closed at profit or loss
if (inTrade and exitTriggered)
inShort := false
inLong := false
printTpSlHitBox(tradeEntryBar + 1, bar_index, slHit, tpHit, entryPrice, slPrice, tpPrice)
printTradeExitLabel(bar_index, math.max(tpPrice, slPrice), posSize, entryPrice, pnl)
// Print TP/SL box for current open trade
if barstate.islastconfirmedhistory and strategy.position_size != 0
printTpSlNotHitBox(tradeEntryBar + 1, bar_index + 1, strategy.position_avg_price, slPrice, tpPrice)
// =============================================================================
// DEBUGGING
// =============================================================================
// Data window plots
plotchar(slPrice, "Stop Loss Price", "")
plotchar(tpPrice, "Take Profit Price", "")
// Label plots
plotDebugLabels = false
if plotDebugLabels
if bar_index == tradeEntryBar
printLabel(bar_index, "Position size: " + str.tostring(entryQty * close, "#.##"))