Chiến lược hồi quy đột phá dựa trên kênh Bollinger Bands
Tổng quan
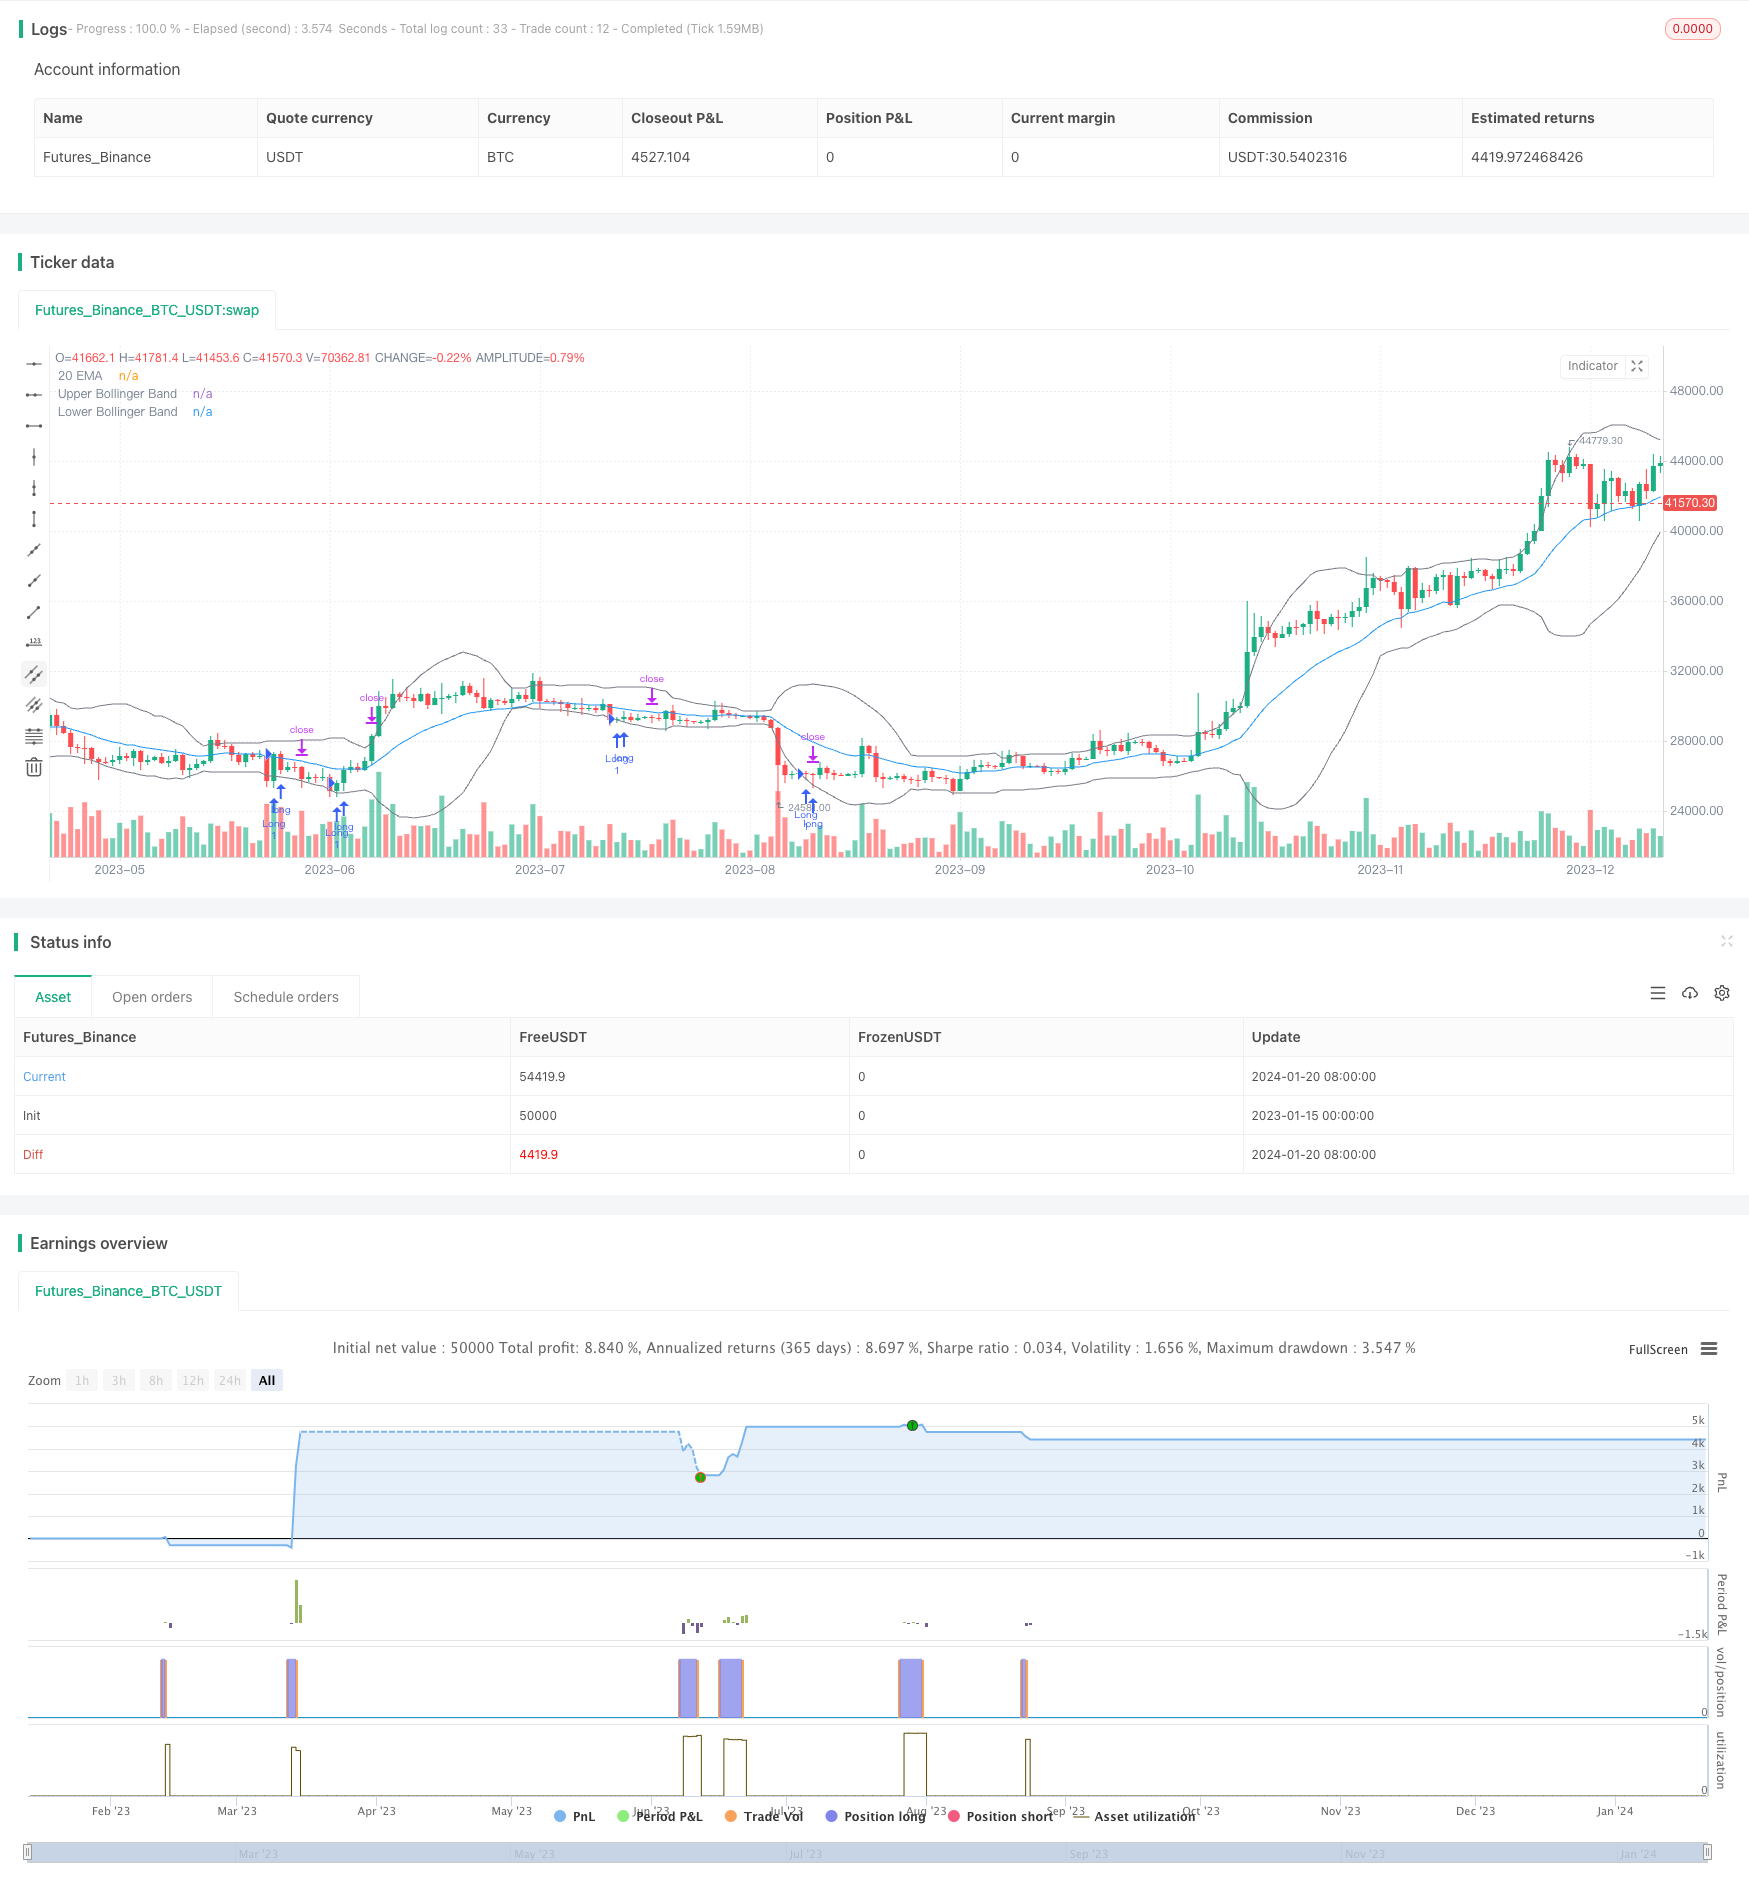
Chiến lược này dựa trên chiến lược phá vỡ quay trở lại của Bollinger Bands. Đặt một vị trí dài vào khi giá giảm xuống Bollinger Bands. Đặt giá dừng là mức giá thấp nhất cho điểm phá vỡ vào.
Nguyên tắc chiến lược
Chiến lược này sử dụng đường băng Brin với 20 chu kỳ. Đường băng Brin bao gồm đường trung tâm, đường trên và đường dưới. Đường trung tâm là trung bình di chuyển đơn giản với 20 chu kỳ, đường trên được tạo thành từ đường trung tâm cộng với chênh lệch tiêu chuẩn gấp đôi, đường dưới được tạo thành từ đường trung tâm trừ đi chênh lệch tiêu chuẩn gấp đôi.
Khi giá giảm xuống đường ray, cho thấy giá đã đi vào trạng thái bán tháo, khi đó thực hiện vị trí dài vào. Sau khi vào, giá dừng là giá thấp nhất của đường K khi vào, mục tiêu dừng là đường dây Brin trên đường ray. Như vậy, chiến lược là theo đuổi giá từ trạng thái bán tháo trở lại đường cân bằng, để đạt được lợi nhuận.
Phân tích lợi thế chiến lược
Chiến lược này có những ưu điểm sau:
- Sử dụng các kênh Brin để đánh giá tình trạng quá mua quá bán của thị trường, có hiệu quả nhất định về thời gian
- Quay trở lại chiến lược giao dịch, tránh Docname theo đuổi
- Cài đặt điểm dừng lỗ hợp lý để kiểm soát rủi ro
Phân tích rủi ro
Chiến lược này cũng có một số rủi ro:
- Blinklink không thể đánh giá được xu hướng của giá cả một cách chính xác, và giá cả không nhất thiết phải tăng trở lại sau khi phá vỡ đường mòn.
- Floating P/L có thể là điểm dừng đầu tiên khi thị trường lớn tiếp tục giảm
- Điểm dừng gần đường ray, có nguy cơ chi phí dừng quá cao
Hướng tối ưu hóa chiến lược
Chiến lược này có thể được tối ưu hóa theo các khía cạnh sau:
- Tối ưu hóa các tham số của vòng Boolean để tìm các tham số kết hợp tốt nhất
- Thêm các chỉ số khác để lọc tín hiệu và cải thiện độ chính xác vào sân
- Tối ưu hóa chiến lược dừng lỗ và tăng tỷ lệ lợi nhuận
Tóm tắt
Chiến lược này có ý tưởng tổng thể rõ ràng và có một số tính hoạt động. Tuy nhiên, hiệu quả thời gian sử dụng Brin để đánh giá quá mua quá bán không cao, không thể đánh giá hoàn hảo xu hướng giá. Ngoài ra, cơ chế dừng lỗ cũng cần được tối ưu hóa.
/*backtest
start: 2023-01-15 00:00:00
end: 2024-01-21 00:00:00
period: 1d
basePeriod: 1h
exchanges: [{"eid":"Futures_Binance","currency":"BTC_USDT"}]
*/

// This source code is subject to the terms of the Mozilla Public License 2.0 at https://mozilla.org/MPL/2.0/
// © Ronsword
//@version=5

strategy("bb 2ND target", overlay=true)

// STEP 1. Create inputs that configure the backtest's date range
useDateFilter = input.bool(true, title="Filter Date Range of Backtest",
     group="Backtest Time Period")
backtestStartDate = input(timestamp("1 Jan 1997"),
     title="Start Date", group="Backtest Time Period",
     tooltip="This start date is in the time zone of the exchange " +
     "where the chart's instrument trades. It doesn't use the time " +
     "zone of the chart or of your computer.")
backtestEndDate = input(timestamp("1 Sept 2023"),
     title="End Date", group="Backtest Time Period",
     tooltip="This end date is in the time zone of the exchange " +
     "where the chart's instrument trades. It doesn't use the time " +
     "zone of the chart or of your computer.")

// STEP 2. See if the current bar falls inside the date range
inTradeWindow = true

// Bollinger Bands inputs
length = input.int(20, title="Bollinger Bands Length")
mult = input.float(2.0, title="Multiplier")
src = input(close, title="Source")
basis = ta.sma(src, length)
dev = mult * ta.stdev(src, length)
upper = basis + dev
lower = basis - dev

// EMA Settings
ema20 = ta.ema(close, 20)
plot(ema20, color=color.blue, title="20 EMA")

// Entry condition
longEntryCondition = ta.crossover(close, lower)

// Define stop loss level as the low of the entry bar
var float stopLossPrice = na
if longEntryCondition
    stopLossPrice := low

// Top Bollinger Band itself is set as the target
topBandTarget = upper

// Enter long position when conditions are met
if inTradeWindow and longEntryCondition
    strategy.entry("Long", strategy.long, qty=1)

// Set profit targets
strategy.exit("ProfitTarget2", from_entry="Long", limit=topBandTarget)

// Set stop loss
strategy.exit("StopLoss", stop=stopLossPrice)

// Plot Bollinger Bands with the same gray color
plot(upper, color=color.gray, title="Upper Bollinger Band")
plot(lower, color=color.gray, title="Lower Bollinger Band")