Chiến lược cây quyết định đa chỉ số: IMACD, EMA và Ichimoku Kinko Hyo
Tổng quan
Chiến lược này sử dụng nhiều chỉ số kỹ thuật như IMACD, EMA và bảng cân bằng đầu tiên để xây dựng một mô hình cây quyết định toàn diện để phát ra tín hiệu mua và bán.
Nguyên tắc chiến lược
- IMACD: MACD tăng cường để nắm bắt xu hướng thị trường tốt hơn thông qua ImpulseMACD và ImpulseHisto
- Bảng cân bằng trực quan: vẽ đường giao dịch, đường chuẩn, đường dẫn A, đường dẫn B, v.v., để phát hiện vị trí hỗ trợ và kháng cự
- EMA 40: Giúp định hướng xu hướng
- Các tín hiệu làm nhiều và làm trống được phát ra dựa trên mối quan hệ cụ thể của IMACD, các thành phần đồ họa đám mây và EMA 40
Tạo nhiều tín hiệu: Tạo nhiều khi IMACD là màu điều kiện cụ thể và EMA 40 cao hơn đường ray trên bản đồ đám mây
Tín hiệu thoát ra: Khi IMACD là màu đỏ và EMA 40 thấp hơn đường ray bên dưới của biểu đồ đám mây, hãy thoát ra
Phân tích lợi thế
- Giao diện đa chỉ số, đánh giá tổng hợp xu hướng thị trường, nâng cao tính chính xác của quyết định
- Mô hình cây quyết định được phân loại rõ ràng, tín hiệu giao dịch được tạo rõ ràng
- EMA có thể điều chỉnh độ dài và tính linh hoạt hơn trong việc đưa ra phán quyết phụ trợ
- Kết hợp các biểu đồ đám mây và các chỉ số xu hướng để xác định tốt hơn hỗ trợ và kháng cự
Phân tích rủi ro
- Kết hợp nhiều chỉ số, thiết lập tham số phức tạp hơn
- EMA dài không đúng, có thể dẫn đến tín hiệu giao dịch sai
- Cần chú ý đến nhiều chỉ số cùng một lúc, điều hành khó khăn hơn
Giải quyết rủi ro: Tối ưu hóa cài đặt tham số, điều chỉnh độ dài EMA, đơn giản hóa quy trình hoạt động.
Hướng tối ưu hóa
- Tối ưu hóa cài đặt tham số để tăng sự ổn định của chiến lược
- Tăng chiến lược dừng lỗ, kiểm soát tổn thất đơn lẻ
- Dựa trên một khối lượng lớn dữ liệu, chúng ta có thể đánh giá lại và cải thiện chất lượng tín hiệu.
- Xây dựng cây quyết định thích ứng kết hợp với thuật toán học máy
Tóm tắt
Chiến lược này sử dụng nhiều chỉ số để xác định xu hướng, xây dựng mô hình cây quyết định để tạo ra tín hiệu giao dịch. Ưu điểm là tín hiệu có chất lượng cao, độ chính xác cao, phù hợp để tối ưu hóa dần dần. Cần chú ý đến chiến lược tối ưu hóa tham số và dừng lỗ để kiểm soát rủi ro giao dịch, để có được lợi nhuận ổn định lâu dài.
/*backtest
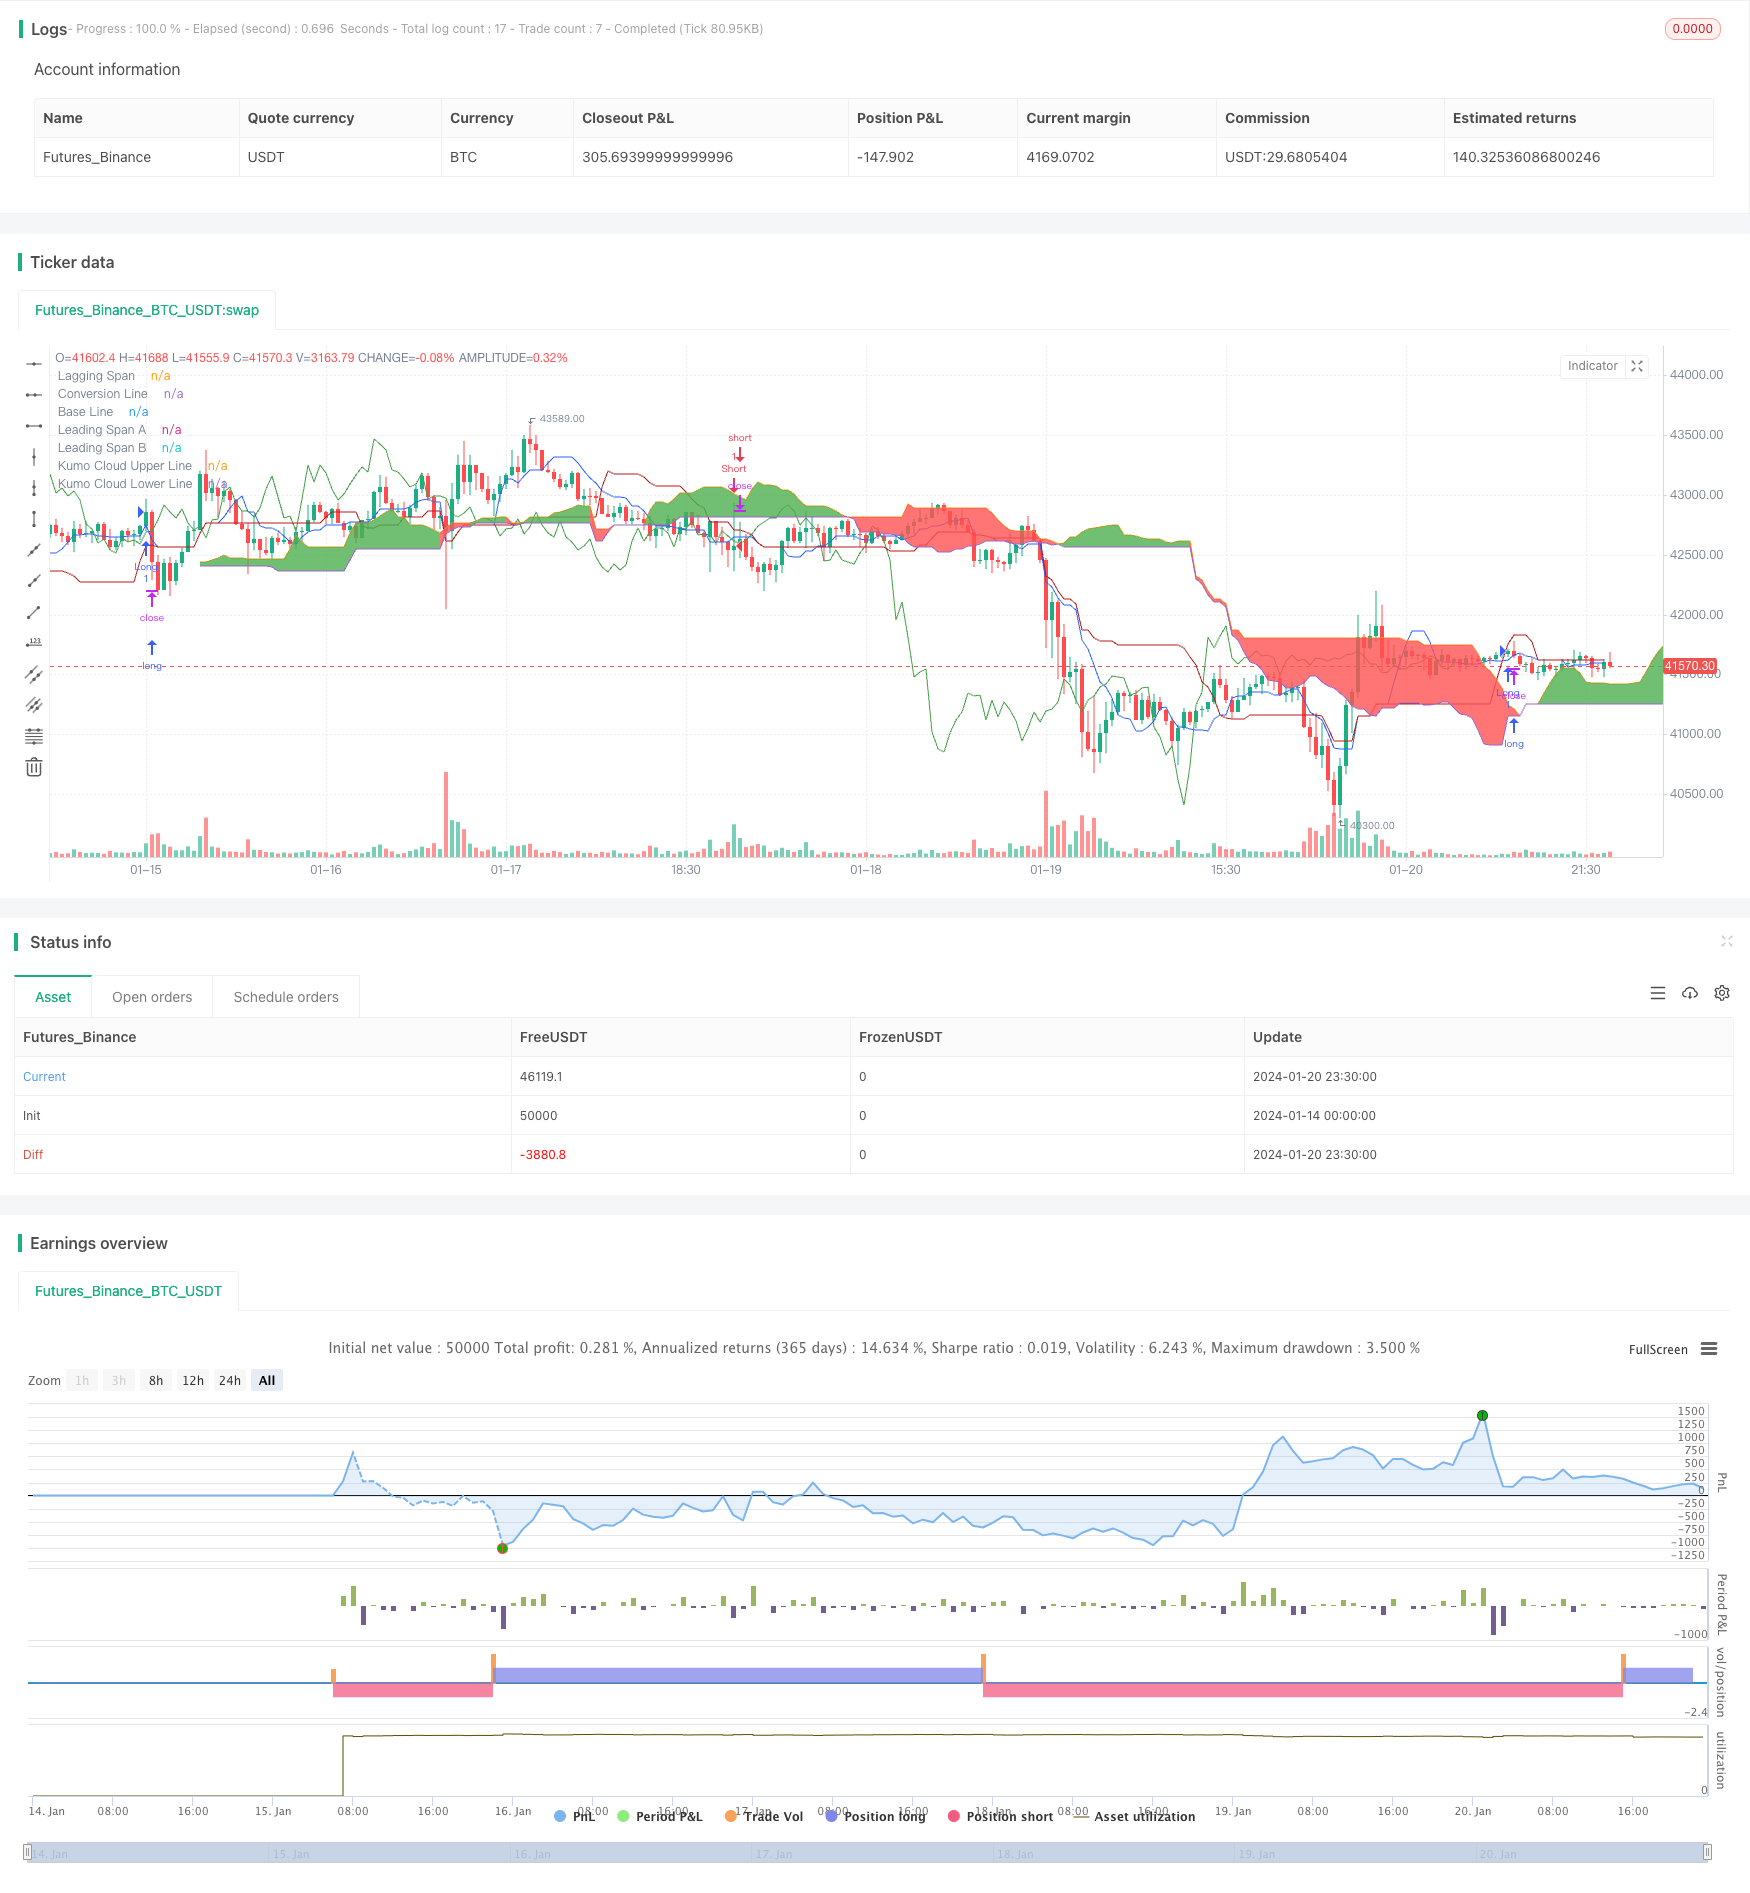
start: 2024-01-14 00:00:00
end: 2024-01-21 00:00:00
period: 30m
basePeriod: 15m
exchanges: [{"eid":"Futures_Binance","currency":"BTC_USDT"}]
*/
//@version=5
strategy("Decision Tree Strategy: IMACD, EMA and Ichimoku [cryptoonchain]", overlay=true)
lengthMA = input(34, title="Length MA")
lengthSignal = input(9, title="Length Signal")
conversionPeriods = input.int(9, minval=1, title="Conversion Line Length")
basePeriods = input.int(26, minval=1, title="Base Line Length")
laggingSpan2Periods = input.int(52, minval=1, title="Leading Span B Length")
displacement = input.int(26, minval=1, title="Lagging Span")
emaLength = input(40, title="EMA Length") // Added user-configurable EMA length
calc_smma(src, len) =>
smma = float(na)
smma := na(smma[1]) ? ta.sma(src, len) : (smma[1] * (len - 1) + src) / len
smma
calc_zlema(src, length) =>
ema1 = ta.ema(src, length)
ema2 = ta.ema(ema1, length)
d = ema1 - ema2
ema1 + d
src = ohlc4
hi = calc_smma(high, lengthMA)
lo = calc_smma(low, lengthMA)
mi = calc_zlema(src, lengthMA)
md = (mi > hi) ? (mi - hi) : (mi < lo) ? (mi - lo) : 0
sb = ta.sma(md, lengthSignal)
sh = md - sb
mdc = src > mi ? (src > hi ? color.rgb(128, 255, 0, 26) : color.green) : (src < lo ? color.red : color.orange)
colorCondition = color.rgb(128, 255, 0, 26)
conversionLine = math.avg(ta.lowest(conversionPeriods), ta.highest(conversionPeriods))
baseLine = math.avg(ta.lowest(basePeriods), ta.highest(basePeriods))
leadLine1 = math.avg(conversionLine, baseLine)
leadLine2 = math.avg(ta.lowest(laggingSpan2Periods), ta.highest(laggingSpan2Periods))
// Use user-configurable length for EMA
ema40 = ta.ema(close, emaLength)
ebc = input(false, title="Enable bar colors")
barcolor(ebc ? mdc : na)
conversionLinePlot = plot(conversionLine, color=#2962FF, title="Conversion Line", display=display.none)
baseLinePlot = plot(baseLine, color=#B71C1C, title="Base Line", display=display.none)
laggingSpanPlot = plot(close, offset=-displacement + 1, color=#43A047, title="Lagging Span", display=display.none)
leadLine1Plot = plot(leadLine1, offset=displacement - 1, color=#A5D6A7, title="Leading Span A", display=display.none)
leadLine2Plot = plot(leadLine2, offset=displacement - 1, color=#EF9A9A, title="Leading Span B", display=display.none)
kumoCloudUpperLinePlot = plot(leadLine1 > leadLine2 ? leadLine1 : leadLine2, offset=displacement - 1, title="Kumo Cloud Upper Line", display=display.none)
kumoCloudLowerLinePlot = plot(leadLine1 < leadLine2 ? leadLine1 : leadLine2, offset=displacement - 1, title="Kumo Cloud Lower Line", display=display.none)
fill(kumoCloudUpperLinePlot, kumoCloudLowerLinePlot, color=leadLine1 > leadLine2 ? color.green : color.red)
a = (leadLine1 > leadLine2 ? leadLine1 : leadLine2)
b = (leadLine1 < leadLine2 ? leadLine1 : leadLine2)
if mdc == colorCondition and ema40 > a[displacement - 1]
strategy.entry("Long", strategy.long)
if mdc == color.red and ema40 < b[displacement - 1]
strategy.entry("Short", strategy.short)