Chiến lược giao dịch đảo ngược đường trung bình động được hỗ trợ bởi chỉ báo động lượng
Tổng quan
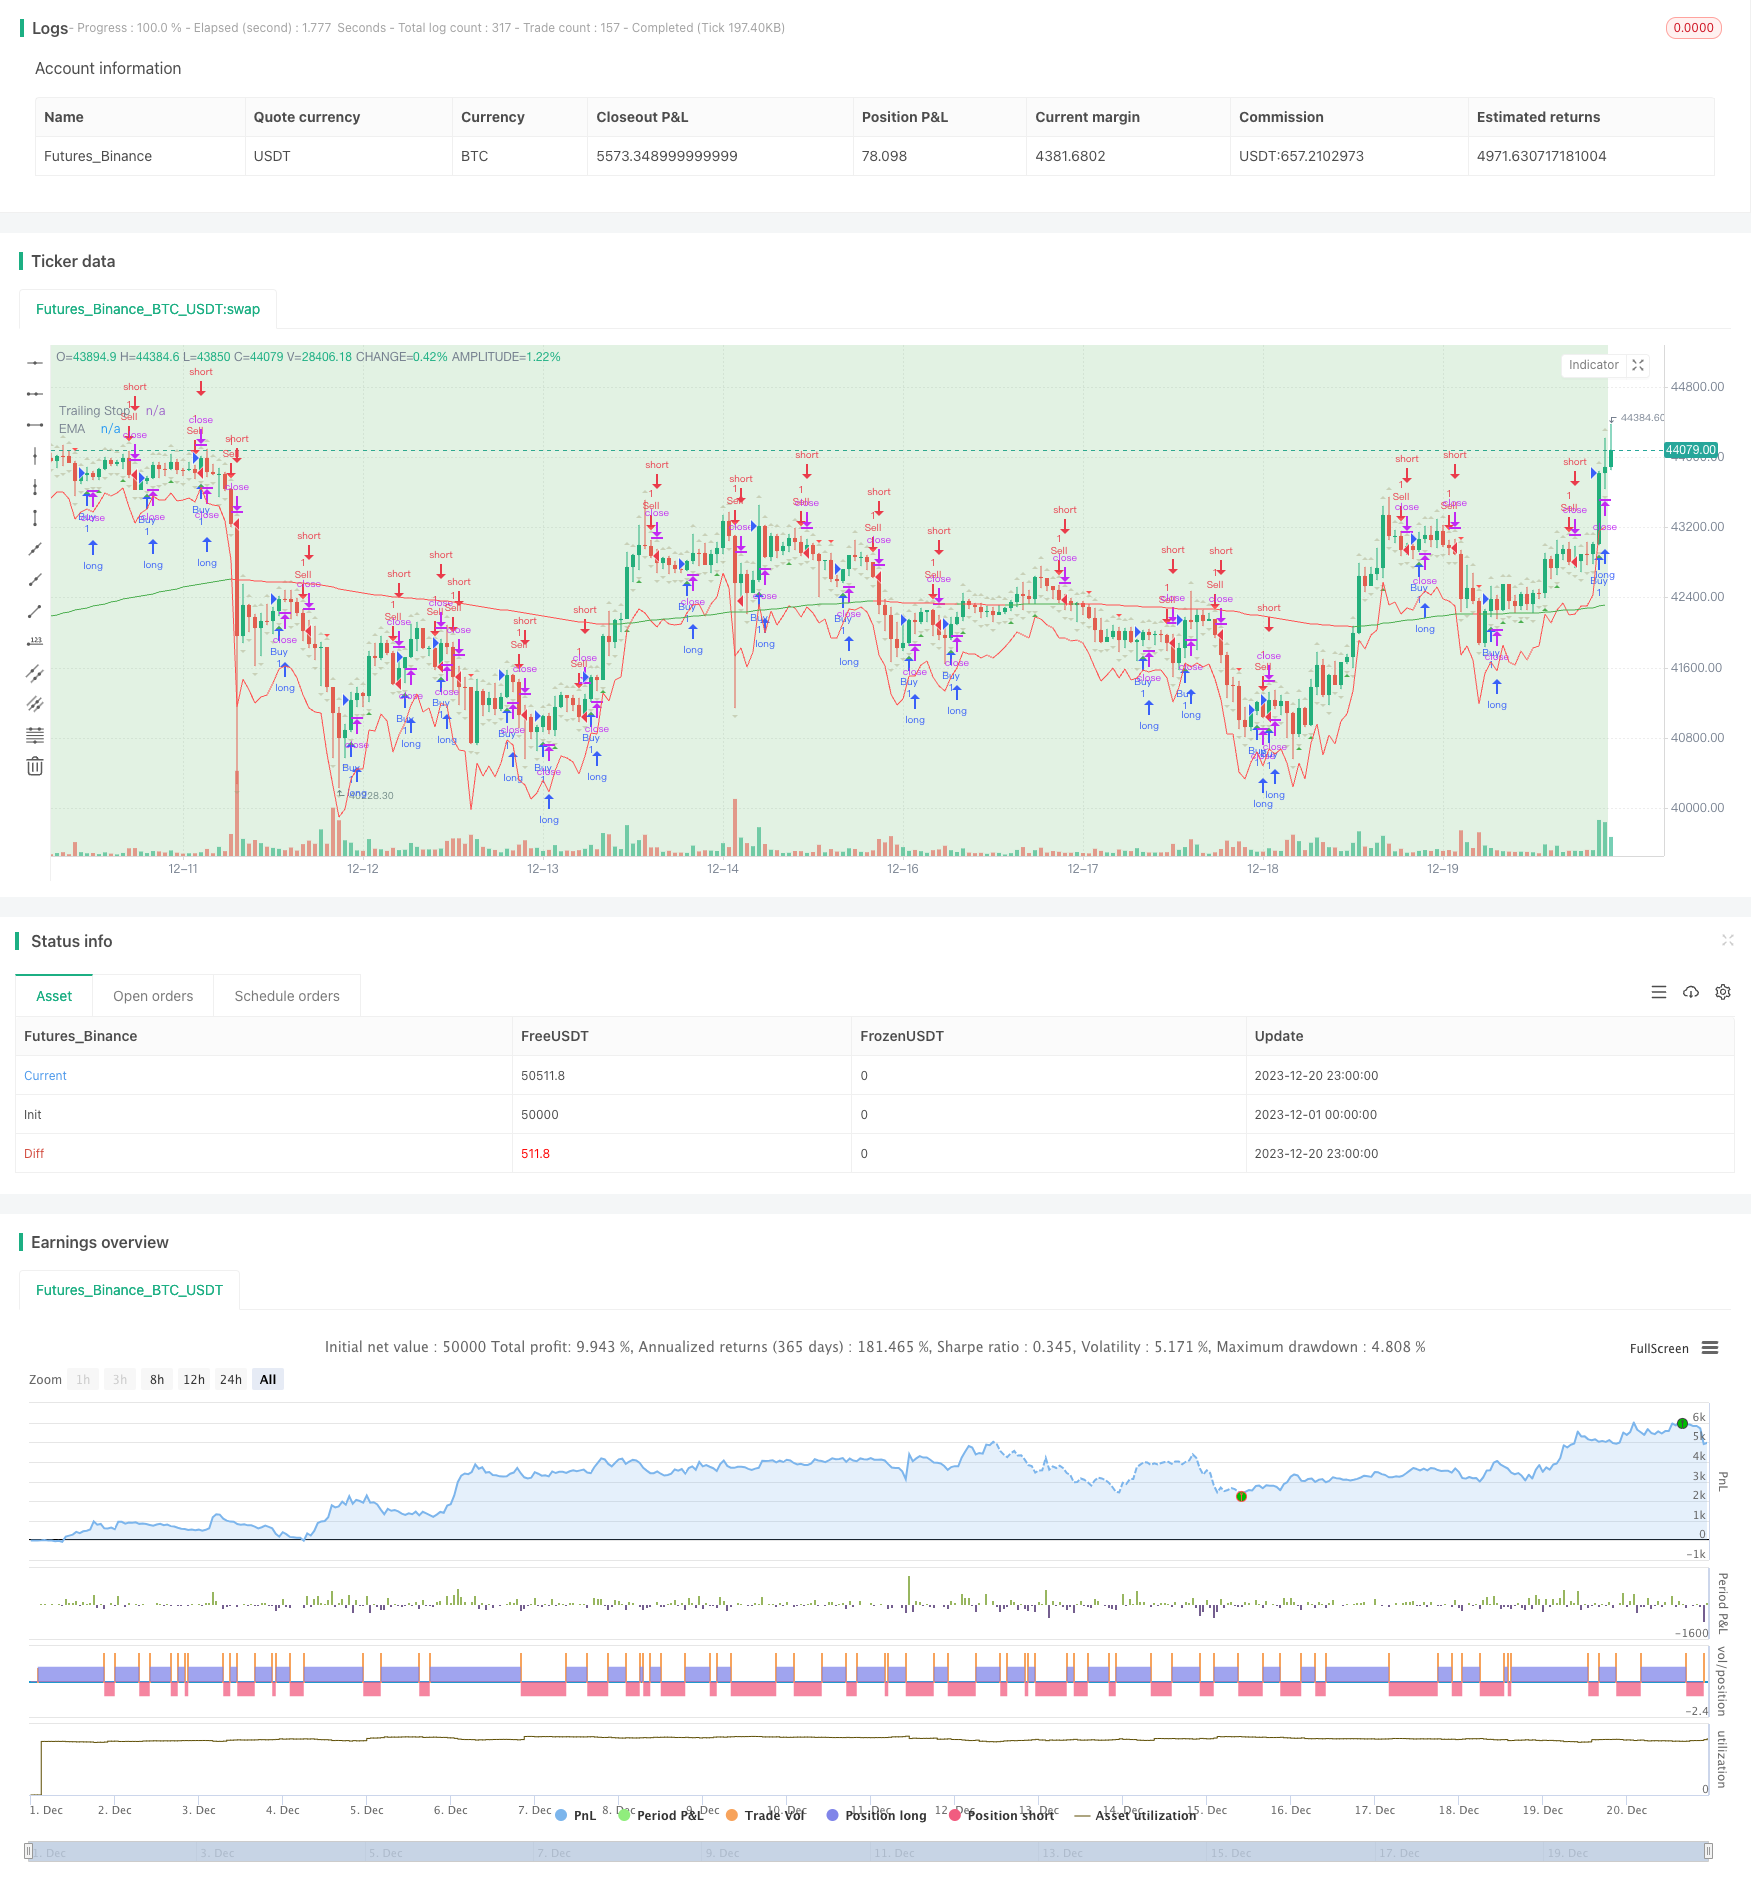
Chiến lược này sử dụng sự kết hợp của chỉ số động lực và đường trung bình, để xác định xu hướng thị trường và điểm đảo ngược, để giao dịch khi xu hướng biến đổi, thuộc chiến lược theo dõi xu hướng và giao dịch ngược. Nó bao gồm các mô-đun như vùng cung và nhu cầu, đường trung bình EMA, các dấu hiệu khu vực trống HH, LL, LH, HL, ATR.
Nguyên tắc chiến lược
1. Xác định vùng cung và cầu
Theo K-đường phân biệt các mối quan hệ cung cấp và nhu cầu, vùng màu đỏ là vùng cung cấp quá cung, vùng màu xanh lá cây là vùng nhu cầu lớn hơn cung.
2. EMA đánh giá xu hướng
Đường trung bình EMA 200 được tính và vẽ, để đánh giá xu hướng đa chiều bằng mối quan hệ giữa giá và kích thước của EMA, giá cao hơn EMA được coi là xu hướng tăng và giá thấp hơn EMA được coi là xu hướng giảm.
3. Đánh dấu khu vực đa không gian
Khu vực đảo ngược được đánh giá dựa trên hai điểm cao và thấp gần đây của đường K:
- Khu vực HH (Higher High) 2 đường K liên tiếp
- Vùng LL ((Lower Low) 2 đường K liên tiếp
- Khu vực LH (Lower High) 1 đỉnh K gần đây nhất là đỉnh sáng tạo, đỉnh K thứ hai là đỉnh đảo ngược, thuộc về đỉnh thả xuống
- Vùng HL ((Vùng Higher Low) 1 đường K thấp gần đây nhất là sáng tạo thấp, đường K thấp thứ hai là đảo ngược, là điểm thấp hồi phục
4. ATR Stop Loss Tracking
Tính ATR cho 14 chu kỳ, nhân nhân số 2 trở thành điểm dừng của chiến lược này.
5. Tham gia và rút lui
Quan hệ giá với mức cao và thấp của Kline ngày trước. Khi giá cao hơn mức cao của ngày trước, sẽ tạo ra tín hiệu đa đầu; Khi giá thấp hơn mức thấp của ngày trước, sẽ tạo ra tín hiệu trống.
Phân tích lợi thế
- Sử dụng nhiều chỉ số để xác định xu hướng và các khu vực đảo ngược quan trọng để tăng khả năng lợi nhuận.
- ATR có thể kiểm soát rủi ro tổn thất đơn lẻ một cách hiệu quả.
- Giảm thời gian nhập cảnh để xác định tín hiệu hiệu quả và giảm khả năng giao dịch sai.
Phân tích rủi ro
- Chỉ dựa vào chỉ số kỹ thuật mà không kết hợp với thông tin cơ bản, có thể bỏ qua thông tin quan trọng dẫn đến thất bại trong giao dịch.
- ATR có thể bị phá vỡ trong trường hợp lớn và gây thiệt hại.
- Trong một xu hướng chấn động, các tín hiệu chuyển đổi EMA thường xuyên có thể dẫn đến giao dịch quá mức.
Phương pháp giải quyết rủi ro:
- Các nhà nghiên cứu cho rằng, việc sử dụng các dữ liệu kinh tế quan trọng và các phán đoán chính sách để đưa ra quyết định là điều kiện cần thiết.
- Có thể mở rộng hệ số ATR để đảm bảo có đủ không gian.
- Điều chỉnh các tham số chu kỳ của ATR dừng để tránh quá nhạy cảm trong xung động.
Hướng tối ưu hóa
- Kết hợp với các chỉ số kỹ thuật khác như MACD, RSI và các chỉ số khác để xác định thời gian nhập học.
- Kiểm tra sự kết hợp của các tham số khác nhau với các tham số hệ số để tìm tham số tối ưu.
- Có thể xem xét thêm bộ lọc phá vỡ để tránh tín hiệu bị chặn.
- Các tham số tối ưu hóa động theo phương pháp học máy.
Tóm tắt
Chiến lược này sử dụng tổng hợp phân tích cung và cầu, phán đoán xu hướng, nhận dạng đảo ngược và mô-đun quản lý lỗ hổng, có thể xác định hiệu quả cơ hội thị trường ở các khu vực quan trọng, là một bộ chiến lược theo dõi xu hướng và kinh doanh ngược hiệu quả. Ngoài ra, cần phải liên tục thử nghiệm và tối ưu hóa, hỗ trợ bằng phán đoán kinh nghiệm nhân tạo, để có được lợi nhuận ổn định lâu dài.
/*backtest
start: 2023-12-01 00:00:00
end: 2023-12-20 23:59:59
period: 1h
basePeriod: 15m
exchanges: [{"eid":"Futures_Binance","currency":"BTC_USDT"}]
*/

//@version=5
strategy("Supply and Demand Zones with EMA and Trailing Stop", shorttitle="SD Zones", overlay=true)

showBuySignals = input(true, title="Show Buy Signals", group="Signals")
showSellSignals = input(true, title="Show Sell Signals", group="Signals")
showHLZone = input(true, title="Show HL Zone", group="Zones")
showLHZone = input(true, title="Show LH Zone", group="Zones")
showHHZone = input(true, title="Show HH Zone", group="Zones")
showLLZone = input(true, title="Show LL Zone", group="Zones")

emaLength = input(200, title="EMA Length", group="EMA Settings")
atrLength = input(14, title="ATR Length", group="Trailing Stop")
atrMultiplier = input(2, title="ATR Multiplier", group="Trailing Stop")

// Function to identify supply and demand zones
getZones(src, len, mult) =>
    base = request.security(syminfo.tickerid, "D", close)
    upper = request.security(syminfo.tickerid, "D", high)
    lower = request.security(syminfo.tickerid, "D", low)
    multiplier = request.security(syminfo.tickerid, "D", mult)
    zonetype = base + multiplier * len
    zone = src >= zonetype
    [zone, upper, lower]

// Identify supply and demand zones
[supplyZone, _, _] = getZones(close, high[1] - low[1], 1)
[demandZone, _, _] = getZones(close, high[1] - low[1], -1)

// Plot supply and demand zones
bgcolor(supplyZone ? color.new(color.red, 80) : na)
bgcolor(demandZone ? color.new(color.green, 80) : na)

// EMA with Linear Weighted method
ema = ta.ema(close, emaLength)

// Color code EMA based on its relation to candles
emaColor = close > ema ? color.new(color.green, 0) : close < ema ? color.new(color.red, 0) : color.new(color.yellow, 0)

// Plot EMA
plot(ema, color=emaColor, title="EMA")

// Entry Signal Conditions after the third candle
longCondition = ta.crossover(close, high[1]) and (bar_index >= 2)
shortCondition = ta.crossunder(close, low[1]) and (bar_index >= 2)

// Trailing Stop using ATR
atrValue = ta.atr(atrLength)
trailStop = close - atrMultiplier * atrValue

// Strategy Entry and Exit
if (longCondition)
    strategy.entry("Buy", strategy.long)
    strategy.exit("TrailStop", from_entry="Buy", loss=trailStop)

if (shortCondition)
    strategy.entry("Sell", strategy.short)
    strategy.exit("TrailStop", from_entry="Sell", loss=trailStop)

// Plot Entry Signals
plotshape(series=showBuySignals ? longCondition : na, title="Buy Signal", color=color.new(color.green, 0), style=shape.triangleup, location=location.belowbar)
plotshape(series=showSellSignals ? shortCondition : na, title="Sell Signal", color=color.new(color.red, 0), style=shape.triangledown, location=location.abovebar)

// Plot Trailing Stop
plot(trailStop, color=color.new(color.red, 0), title="Trailing Stop")

// Plot HH, LL, LH, and HL zones
plotshape(series=showHHZone and ta.highest(high, 2)[1] and ta.highest(high, 2)[2] ? 1 : na, title="HH Zone", color=color.new(color.blue, 80), style=shape.triangleup, location=location.abovebar)
plotshape(series=showLLZone and ta.lowest(low, 2)[1] and ta.lowest(low, 2)[2] ? 1 : na, title="LL Zone", color=color.new(color.blue, 80), style=shape.triangledown, location=location.belowbar)
plotshape(series=showLHZone and ta.highest(high, 2)[1] and ta.lowest(low, 2)[2] ? 1 : na, title="LH Zone", color=color.new(color.orange, 80), style=shape.triangleup, location=location.abovebar)
plotshape(series=showHLZone and ta.lowest(low, 2)[1] and ta.highest(high, 2)[2] ? 1 : na, title="HL Zone", color=color.new(color.orange, 80), style=shape.triangledown, location=location.belowbar)