Chiến lược giao dịch định lượng dựa trên Ichimoku Kinko Hyo và Chỉ số định hướng trung bình
Tổng quan
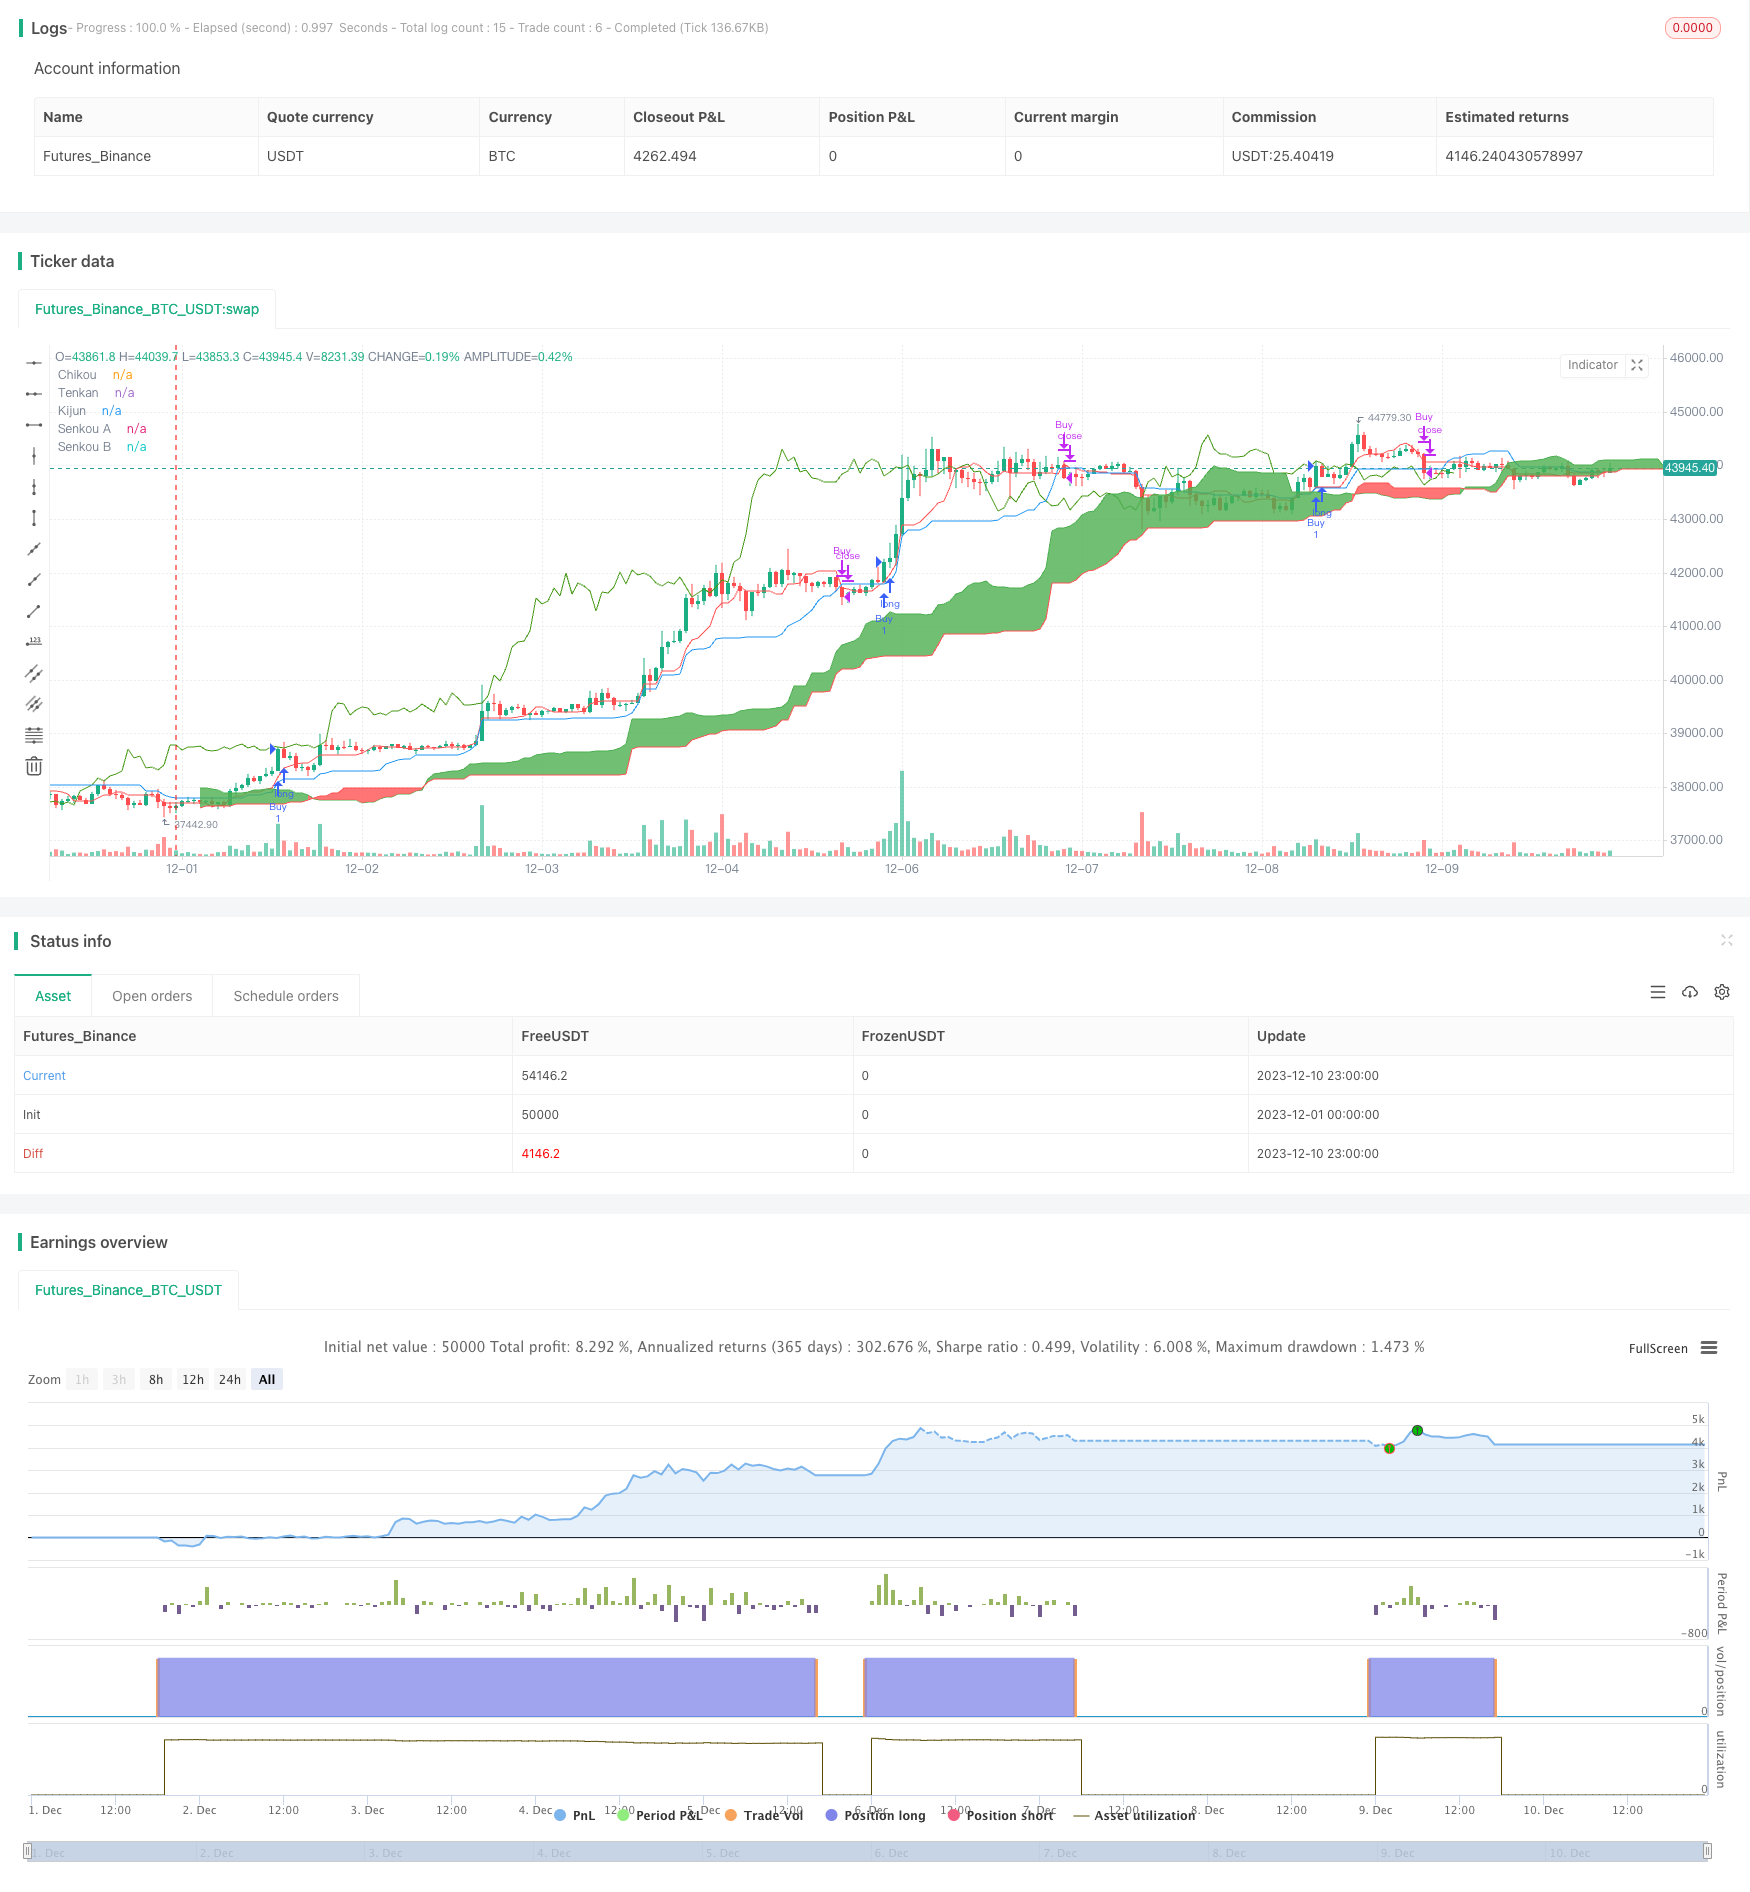
Chiến lược này sử dụng hai chỉ số kỹ thuật, bảng cân bằng và chỉ số định hướng trung bình ((ADX) để xác định xu hướng giá cổ phiếu và các mức kháng cự hỗ trợ quan trọng để phát tín hiệu mua và bán. Chiến lược này nhằm mục đích nắm bắt biến động giá lớn trong tình huống xu hướng.
Nguyên tắc chiến lược
Bảng cân bằng trực tiếp bao gồm ba đường trung bình di chuyển của đường chuyển tiếp, đường chuẩn và đường trì hoãn. Khi giá vượt qua đường chuyển tiếp và đường chuẩn, nó phát ra tín hiệu mua; khi giá vượt qua hai đường này, nó phát ra tín hiệu bán. Ngoài ra, bảng cân bằng trực tiếp cũng xác định các vùng kháng cự hỗ trợ quan trọng thông qua biểu đồ đám mây.
ADX được sử dụng để đánh giá cường độ của xu hướng giá. Khi + DI và - DI rõ ràng tách ra, nó cho thấy xu hướng; Khi + DI và - DI gần nhau, nó cho thấy xu hướng cân bằng. Chiến lược này chỉ phát đi tín hiệu giao dịch khi ADX lớn hơn 20 để tránh bắt phá vỡ giả trong thời gian cân bằng.
Sử dụng kết hợp các phán đoán xu hướng từ bảng cân bằng đầu tiên và bộ lọc ADX về cường độ xu hướng, có thể xác định hiệu quả các khu vực xu hướng có biến động giá lớn.
Lợi thế chiến lược
- Sử dụng sự kết hợp của hai chỉ số làm cho tín hiệu giao dịch đáng tin cậy hơn
- Việc sử dụng ADX giúp tránh các giao dịch sai lệch trong việc cân bằng tình hình
- Quá trình phản hồi tốt hơn, lợi nhuận có rủi ro cao hơn
Phân tích rủi ro
- Chiến lược này phù hợp hơn với các cổ phiếu đang có xu hướng, có thể không có nhiều tín hiệu cho các cổ phiếu đang cân bằng
- Tham khảo các bài viết của các nhà nghiên cứu, các chuyên gia và các nhà nghiên cứu khác về các vấn đề liên quan đến cân bằng.
- ADX không hoàn hảo trong việc đánh giá và có thể có những sai lầm.
Hướng tối ưu hóa
- Có thể kiểm tra các kết hợp các tham số khác nhau, chẳng hạn như chuyển đổi đường, điều chỉnh chu kỳ đường chuẩn
- Có thể kết hợp với các chỉ số khác như MACD, KD và tối ưu hóa hơn nữa
- Có thể nghiên cứu các quy tắc hoặc điều kiện lọc ADX khác nhau
Tóm tắt
Chiến lược này có thể thu được phản hồi tốt hơn và hiệu suất thực tế trên cơ sở tối ưu hóa các tham số và quy tắc hơn nữa. Chiến lược này phù hợp với các nhà đầu tư chiến lược giao dịch cổ phiếu xu hướng.
/*backtest
start: 2023-12-01 00:00:00
end: 2023-12-10 23:59:59
period: 1h
basePeriod: 15m
exchanges: [{"eid":"Futures_Binance","currency":"BTC_USDT"}]
*/

//@version=4
strategy(title="Ichimoku + ADX", shorttitle="Ichimoku & ADX Backtest", overlay=true)

//------------------------------
//------------------------------
// ICHIMOKU
//------------------------------
//------------------------------

conversionPeriods = input(9, minval=1, title="Conversion Line Periods"),
basePeriods = input(26, minval=1, title="Base Line Periods")
laggingSpan2Periods = input(52, minval=1, title="Lagging Span 2 Periods"),
displacement = input(26, minval=1, title="Displacement")

donchian(len) => avg(lowest(len), highest(len))

Tenkan = donchian(conversionPeriods)
Kijun = donchian(basePeriods)
SSA = avg(Tenkan, Kijun)
SSB = donchian(laggingSpan2Periods)

SSAdisp = SSA[displacement]
SSBdisp = SSB[displacement]

// Plot Ichimoku
// --------------------

plot(Tenkan, color=color.red, title="Tenkan")
plot(Kijun, color=color.blue, title="Kijun")
plot(close, offset = -displacement + 1, color=#459915, title="Chikou")


p1 = plot(SSA, offset = displacement - 1, color=color.green,
 title="Senkou A")
p2 = plot(SSB, offset = displacement - 1, color=color.red,
 title="Senkou B")
fill(p1, p2, color = SSA > SSB ? color.green : color.red)

//------------------------------
//------------------------------
// ADX
//------------------------------
//------------------------------

adxlen = input(14, title="ADX Smoothing")
dilen = input(14, title="DI Length")
keyLevel = input(23, title="key level for ADX")
dirmov(len) =>
	up = change(high)
	down = -change(low)
	truerange = rma(tr, len)
	plus = fixnan(100 * rma(up > down and up > 0 ? up : 0, len) / truerange)
	minus = fixnan(100 * rma(down > up and down > 0 ? down : 0, len) / truerange)
	[plus, minus]

adx(dilen, adxlen) =>
	[plus, minus] = dirmov(dilen)
	sum = plus + minus
	adx = 100 * rma(abs(plus - minus) / (sum == 0 ? 1 : sum), adxlen)
	[adx, plus, minus]

[sig, up, down] = adx(dilen, adxlen)

// Plot ADX
// --------------------

//plot(sig, color=color.black, title="ADX")
//plot(up, color=color.green, title="+DI",linewidth=2, style=plot.style_columns, transp=40)
//plot(down, color=color.red, title="-DI",linewidth=2, style=plot.style_columns, transp=40)
//plot(keyLevel, color=color.white, title="Key Level")


//------------------------------
//------------------------------
// STRATEGY
//------------------------------
//------------------------------

// Buy & Sell Signals
// --------------------

// ADX
ABuy1 = up > keyLevel and up - down >5 and sig > down and sig < keyLevel * 2
ASell1 = down > keyLevel and down - up >5 and sig > up and sig < keyLevel * 2


// ICHIMOKU

Bull = close >= max(SSAdisp, SSBdisp)
Bear = close <= min(SSAdisp, SSBdisp)

//  1. Bull
Buy1 = (close >= max(SSAdisp, SSBdisp)) ? 1 : 0
Buy2 = (Tenkan - Kijun >= 0.001) ? 1 : 0
Buy3 = SSA > SSB ? 1 : 0
Buy4 = sig > 20 ? 1 : 0
Buy4a = close - close[displacement] >=0.001 ? 1:0
Buy5 = Buy1 and Buy2 and Buy3 and Buy4 and Buy4a and not(Buy1[1] and Buy2[1] and Buy3[1])

//  1. Bear
Sell1 = (close <= min(SSAdisp, SSBdisp)) ? 1 : 0
Sell2 = (Kijun - Tenkan >= 0.001) ? 1 : 0
Sell3 = SSA < SSB ? 1 : 0
Sell4 = sig > 20 ? 1 : 0
Sell4a = close <= close[displacement]
Sell5 = Sell1 and Sell2 and Sell3 and Sell4 and Sell4a and not(Sell1[1] and Sell2[1] and Sell3[1])


// CONSOLIDATED

buysignal = Buy5
buyexitsignal = crossunder(close,Kijun)

sellsignal = Sell5
sellexitsignal = crossover(close,Kijun)

longCondition = buysignal
shortCondition = sellsignal

// Plot Indicators
// --------------------

// ----- Buy & Sell

//plotshape(longCondition, title = "Buy Signal", text ="BUY", textcolor =#FFFFFF , style=shape.labelup, size = size.tiny, location=location.belowbar, color = #1B8112, transp = 0)
//plotshape(shortCondition, title = "Short Signal", text ="SHORT", textcolor =#FFFFFF , style=shape.labeldown, size = size.tiny, location=location.abovebar, color = #000000, transp = 0)

// ----- Ichimoku Signals

//plotshape(Sell2, title = "Sell Signal", text ="Kumo Twist", textcolor =#FFFFFF , style=shape.labelup, size = size.tiny, location=location.top, color = color.black, transp = 0)
//plotshape(Sell3, title = "Sell Signal", text ="TK/KJ", textcolor =#FFFFFF , style=shape.labelup, size = size.tiny, location=location.bottom, color = color.black, transp = 0)

//plotshape(Buy4, title = "Buy Signal", text ="Kumo Twist", textcolor =#FFFFFF , style=shape.diamond, size = size.tiny, location=location.belowbar, color = color.blue, transp = 0)
//plotshape(Buy3, title = "Buy Signal", text ="TK/KJ", textcolor =#FFFFFF , style=shape.circle, size = size.tiny, location=location.abovebar, color = color.green, transp = 0)
//plotshape(Buy4, title = "Buy Signal", text ="TK/KJ", textcolor =#FFFFFF , style=shape.circle, size = size.tiny, location=location.belowbar, color = color.red, transp = 0)


//plotshape(buyexitsignal, title = "Buy Exit", style=shape.triangledown, size = size.tiny, location=location.abovebar, color = color.green, transp = 0)
//plotshape(sellexitsignal, title = "Buy Exit", style=shape.triangleup, size = size.tiny, location=location.belowbar, color = color.black, transp = 0)

//------------------------------
//------------------------------
// EXECUTION
//------------------------------
//------------------------------


// Test Range
// --------------------

// === INPUT BACKTEST RANGE ===
FromMonth = input(defval = 2, title = "From Month", minval = 1, maxval = 12)
FromDay   = input(defval = 1, title = "From Day", minval = 1, maxval = 31)
FromYear  = input(defval = 2015, title = "From Year", minval = 2017)
ToMonth   = input(defval = 1, title = "To Month", minval = 1, maxval = 12)
ToDay     = input(defval = 1, title = "To Day", minval = 1, maxval = 31)
ToYear    = input(defval = 9999, title = "To Year", minval = 2017)

// === FUNCTION EXAMPLE ===
start     = timestamp(FromYear, FromMonth, FromDay, 00, 00)  // backtest start window
finish    = timestamp(ToYear, ToMonth, ToDay, 23, 59)        // backtest finish window
window()  => true // create function "within window of time"

// Orders
// --------------------


if longCondition
    strategy.entry("Buy", strategy.long, when=window())

if buyexitsignal
    strategy.close("Buy")

if shortCondition
    strategy.entry("Sell", strategy.short, when=window())

if sellexitsignal
    strategy.close("Sell")