Chiến lược giao cắt đường trung bình động Momentum
Tổng quan
Chiến lược này dựa trên sự giao thoa của đường trung bình EMA trong các chu kỳ khác nhau để xác định hướng xu hướng và dựa trên đó để thiết lập một tín hiệu bán tháo nhiều. Chủ yếu sử dụng 2 đường trung bình, là đường 10 ngày và đường 20 ngày. Khi đường 10 ngày đi từ trên xuống qua đường 20 ngày, tháo lỗ; Khi đường 10 ngày đi từ dưới lên qua đường 20 ngày, tháo nhiều.
Nguyên tắc chiến lược
Chiến lược này sử dụng hai đường trung bình EMA, bao gồm đường 10 và đường 20. đường trung bình EMA có thể phản ánh tốt xu hướng của giá. Khi đường EMA ngắn hạn từ dưới lên qua đường EMA dài, cho thấy xu hướng của giá từ giảm lên, thuộc về nhiều tín hiệu; khi đường EMA ngắn hạn từ trên xuống qua đường EMA dài, cho thấy xu hướng của giá từ tăng lên xuống, thuộc về tín hiệu trống.
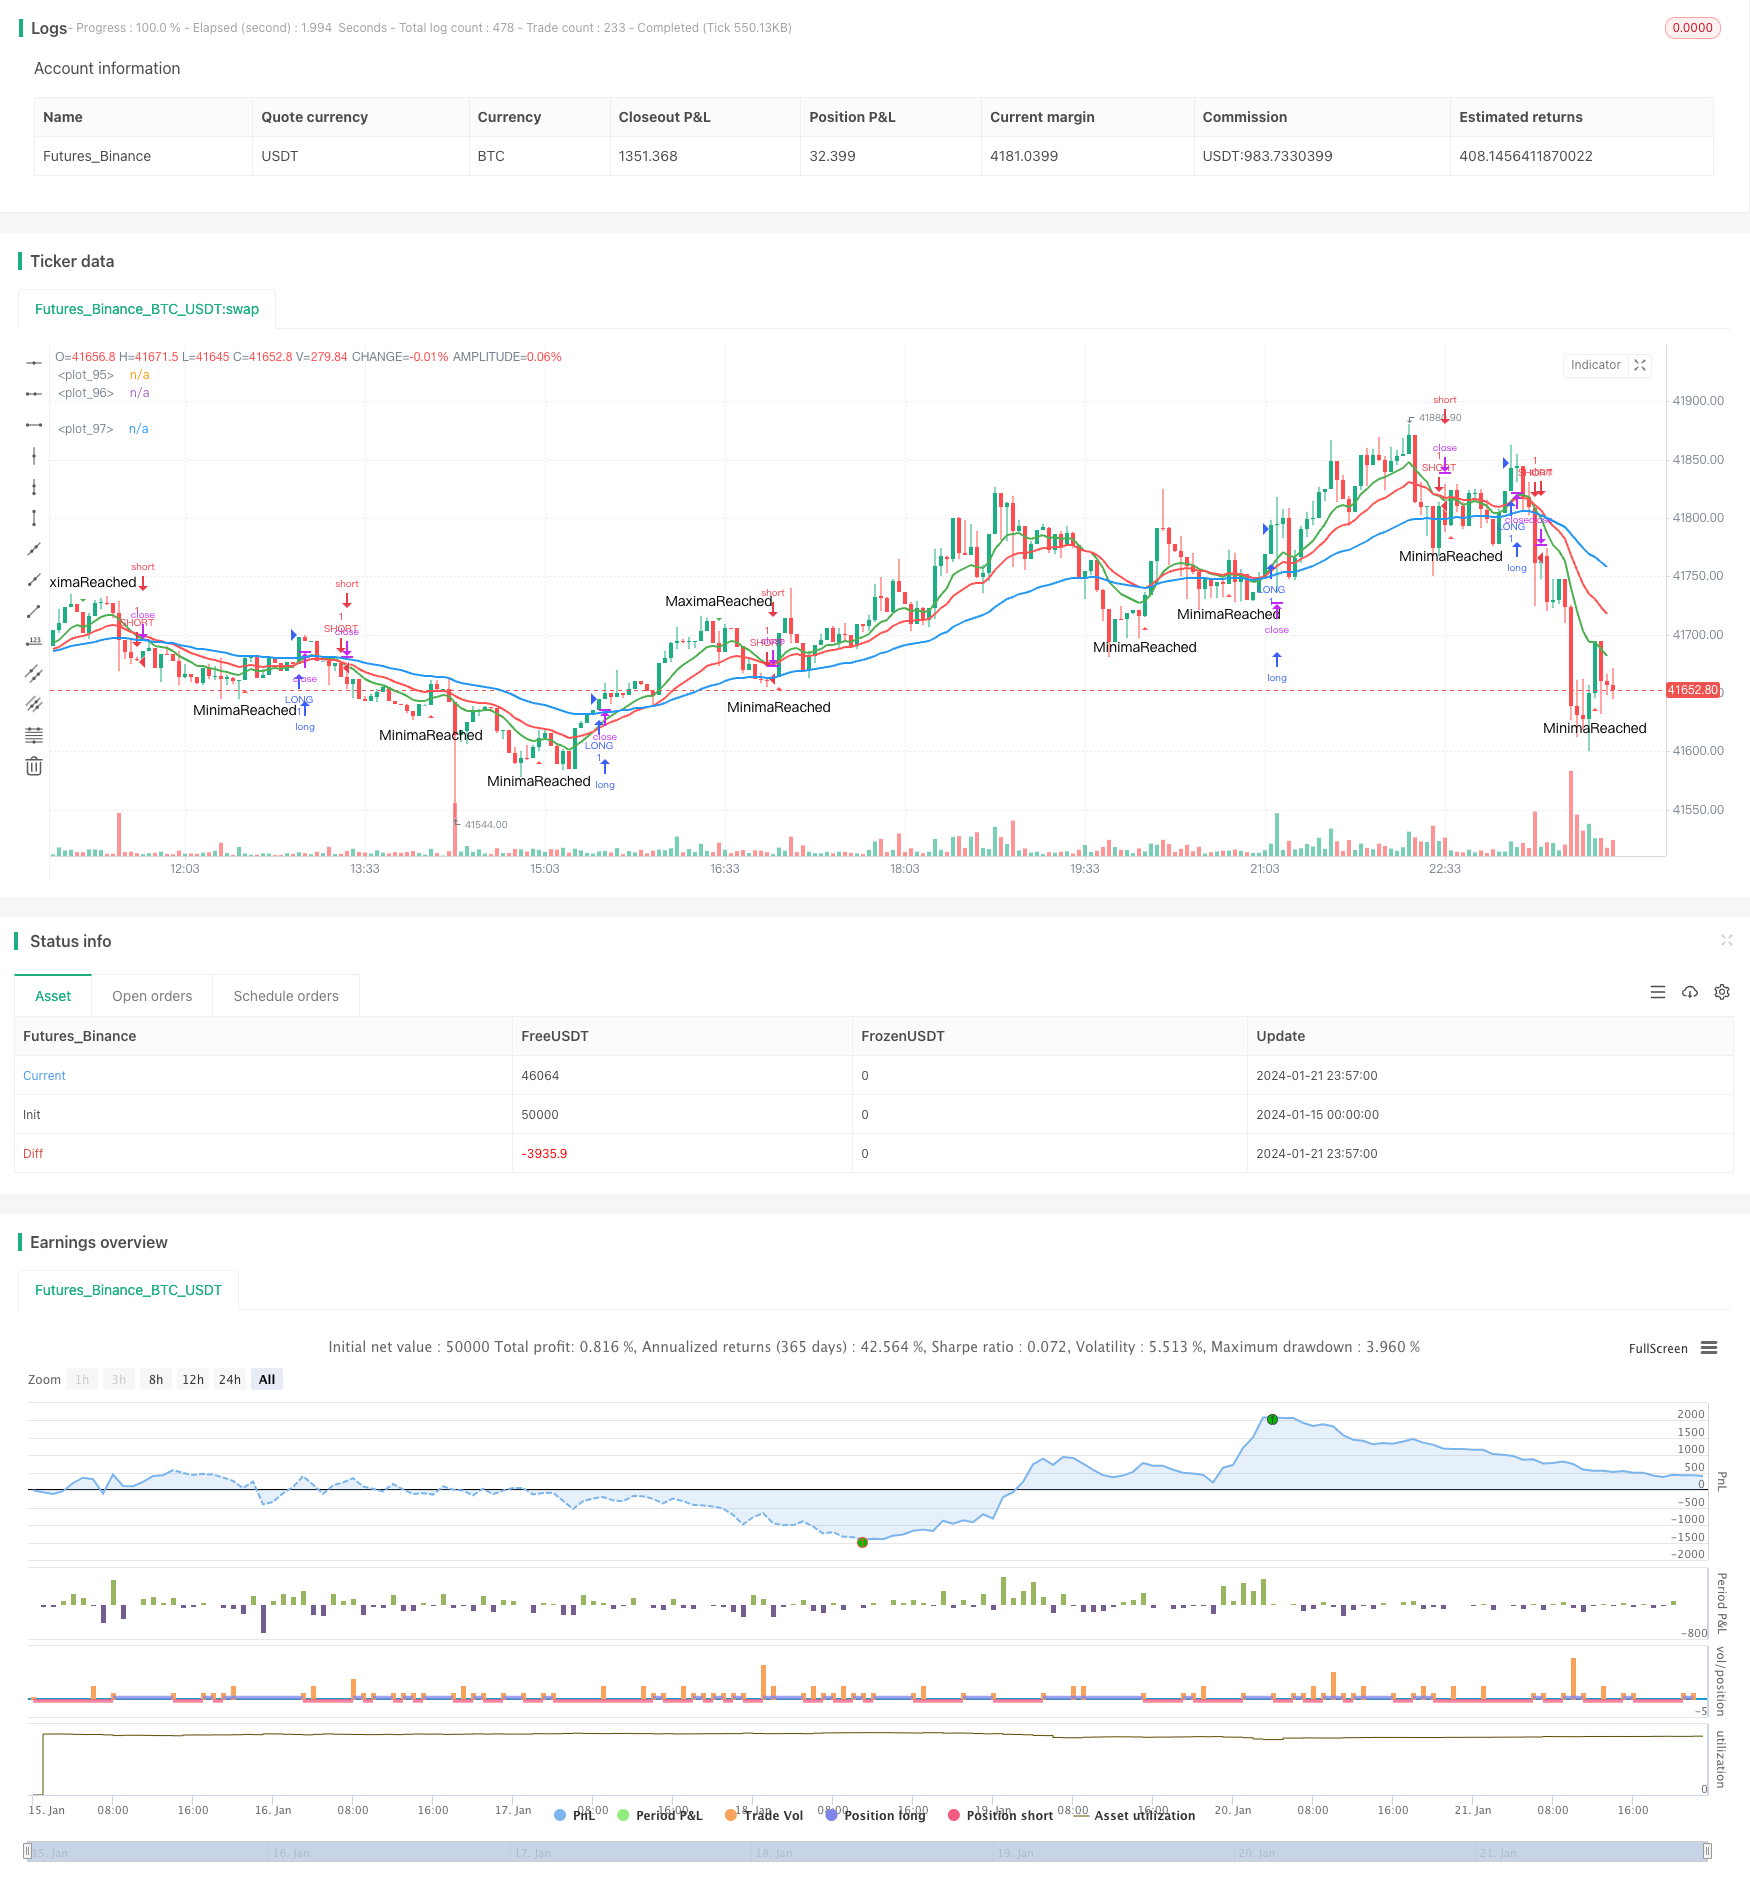
Chiến lược này kết hợp các giá trị cực lớn và cực nhỏ của biến động để lọc một phần tín hiệu giao dịch. Chỉ sau khi biến động giá đạt đến một mức độ nhất định, tín hiệu giao dịch sẽ được phát ra. Điều này có thể lọc một số tín hiệu giả.
Cụ thể, chiến lược này xác định xu hướng của giá bằng cách theo dõi thời gian giá đạt đến mức tối đa và tối thiểu. Chỉ sau khi đạt đến mức tối đa hoặc tối thiểu nhất định, tín hiệu giao dịch thực sự sẽ được phát ra.
Phân tích lợi thế chiến lược
Chiến lược này có một số lợi thế:
- Sử dụng đường trung bình của EMA để xác định xu hướng, có thể theo dõi hiệu quả xu hướng thị trường
- Kết hợp các đường trung bình EMA của các chu kỳ khác nhau để nắm bắt cơ hội giao dịch trên đường ngắn giữa
- Bằng cách lọc tín hiệu cực đại, bạn có thể lọc ra một số tiếng ồn và tránh bỏ lỡ cơ hội giao dịch
- Logic của chiến lược đơn giản, rõ ràng, dễ hiểu và sửa đổi
- Có thể điều chỉnh các tham số theo các giống và sở thích giao dịch khác nhau, thích ứng mạnh
Phân tích rủi ro chiến lược
Chiến lược này cũng có một số rủi ro:
- Đường trung bình của EMA sẽ bị tụt hậu và có thể bỏ lỡ sự đảo ngược giá trong ngắn hạn.
- Chức năng lọc tín hiệu tiếng ồn không hoàn chỉnh, có thể có một số giao dịch sai
- Cần điều chỉnh các tham số phù hợp để phù hợp với môi trường thị trường khác nhau
Bạn có thể làm giảm nguy cơ bằng cách:
- Kết hợp với các chỉ số khác để xác nhận tín hiệu, tránh sự chậm trễ của EMA
- Tối ưu hóa các điều kiện lọc cực, tăng độ tin cậy tín hiệu
- Điều chỉnh tham số dựa trên kết quả phản hồi, chiến lược tối ưu hóa
Hướng tối ưu hóa chiến lược
Chiến lược này có thể được tối ưu hóa hơn nữa theo một số hướng sau:
- Thêm một loạt các chỉ số kỹ thuật khác để cải thiện độ chính xác của tín hiệu giao dịch. Ví dụ: MACD, KD, v.v.
- Tối ưu hóa các tham số của đường trung bình EMA để phù hợp hơn với các giống cụ thể.
- Tối ưu hóa các tham số giá trị tối đa tối thiểu, cải thiện phán đoán về biến động giá.
- Thêm chiến lược dừng lỗ để kiểm soát tổn thất tối đa cho một giao dịch.
- Kiểm tra các giống khác nhau với chiến lược này để đánh giá tính phù hợp.
Tóm tắt
Chiến lược giao chéo EMA nói chung là một chiến lược theo dõi xu hướng đơn giản và thực tế. Nó sử dụng đường trung bình EMA để xác định hướng của xu hướng lớn, sau đó kết hợp với tín hiệu lọc biến động giá để tạo ra quyết định giao dịch. Chiến lược này dễ hiểu và điều chỉnh tham số, có thể thích ứng với giao dịch đường ngắn giữa và giữa.
/*backtest
start: 2024-01-15 00:00:00
end: 2024-01-22 00:00:00
period: 3m
basePeriod: 1m
exchanges: [{"eid":"Futures_Binance","currency":"BTC_USDT"}]
*/

//@version=2
strategy("PierceMAStrat", overlay=true)

lenMA0 = input(title="Length 0",defval=2)
lenMA1=input(title="Length 1",defval=10)
lenMA2=input(title="Length 2", defval=20)
lenMA3 = input(title = "Length3", defval =50)


emaLen0 = ema(close, lenMA0)
emaLen1 = ema(close, lenMA1)
emaLen2 = ema(close, lenMA2)
emaLen3 = ema(close, lenMA3)


ascent = if emaLen1[1] < emaLen1[0]
    true
else
    false

descent = if emaLen1[1] > emaLen1[0]
    true
else
    false

TimeSinceAscensionStart = if ascent == true
    barssince(descent == true)
else
    0


StartUp = if TimeSinceAscensionStart < 1
    true
else
    false

StartDown = if TimeSinceAscensionStart < 1
    false
else
    true


AscentBarCounter = barssince(StartUp == true)

DescentBarCounter = barssince(StartDown == true)

MaxAscent = if AscentBarCounter[1] > AscentBarCounter[0] and AscentBarCounter[1] > 10
    true
else
    false

MaxDescent = if DescentBarCounter[1] > DescentBarCounter[0] and DescentBarCounter[1] > 5
    true
else
    false

longCond = if crossover(emaLen1, emaLen2) and barssince(MaxDescent == true) > 3
    true
else
    false
shortCond = if crossunder(emaLen1, emaLen2) and barssince(MaxAscent == true) > 3
    true
else
    false


//longCond = (crossover(emaLen1, emaLen2) and (emaLen2 > emaLen3))
//shortCond = crossunder(emaLen1, emaLen2) and (emaLen2 < emaLen3)


if longCond == true
    strategy.entry("LONG", strategy.long)

if shortCond == true
    strategy.entry("SHORT", strategy.short)


plotshape(series=MaxAscent, title="MaximaReached", style=shape.triangledown, location=location.abovebar, color=green, text="MaximaReached", size=size.small)
plotshape(series=MaxDescent, title="MinimaReached", style=shape.triangleup, location=location.belowbar, color=red, text="MinimaReached", size=size.small)
//plotshape(series=StartUp, title="StartUp", style=shape.triangleup, location=location.belowbar, color=red, text="StartUp", size=size.tiny)
//plotshape(series=StartDown, title="StartDown", style=shape.triangleup, location=location.belowbar, color=green, text="StartDown", size=size.tiny)

//plotshape(series=(crossover(emaLen1, emaLen3)), title="GBXOVER", style=shape.triangleup, location=location.belowbar, color=green, text="GBXO", size=size.small)
//plotshape(series=(crossover(emaLen2, emaLen3)), title="RBXOVER", style=shape.triangledown, location=location.abovebar, color=orange, text="RBXO", size=size.small)
//plotshape(series=(crossover(emaLen1, emaLen2)), title="GRXOVER", style=shape.triangledown, location=location.abovebar, color=teal, text="GRXO", size=size.small)
//plotshape(series=(crossunder(emaLen1, emaLen2)), title="GRXUNDER", style=shape.triangledown, location=location.abovebar, color=purple, text="GRXU", size=size.small)
//plotshape(series=(crossunder(emaLen1, emaLen3)), title="GBXOVER", style=shape.triangleup, location=location.belowbar, color=yellow, text="GBXU", size=size.small)
//plotshape(series=(crossunder(emaLen2, emaLen3)), title="RBXOVER", style=shape.triangledown, location=location.abovebar, color=yellow, text="RBXU", size=size.small)

//plotshape(convergence, color=lime, style=shape.arrowup, text="CROSS")
plot(emaLen1, color=green, transp=0, linewidth=2)
plot(emaLen2, color=red, transp=30, linewidth=2)
plot(emaLen3, color=blue, transp=30, linewidth=2)