Chiến lược Double Gap của Bitcoin và Vàng
Tổng quan
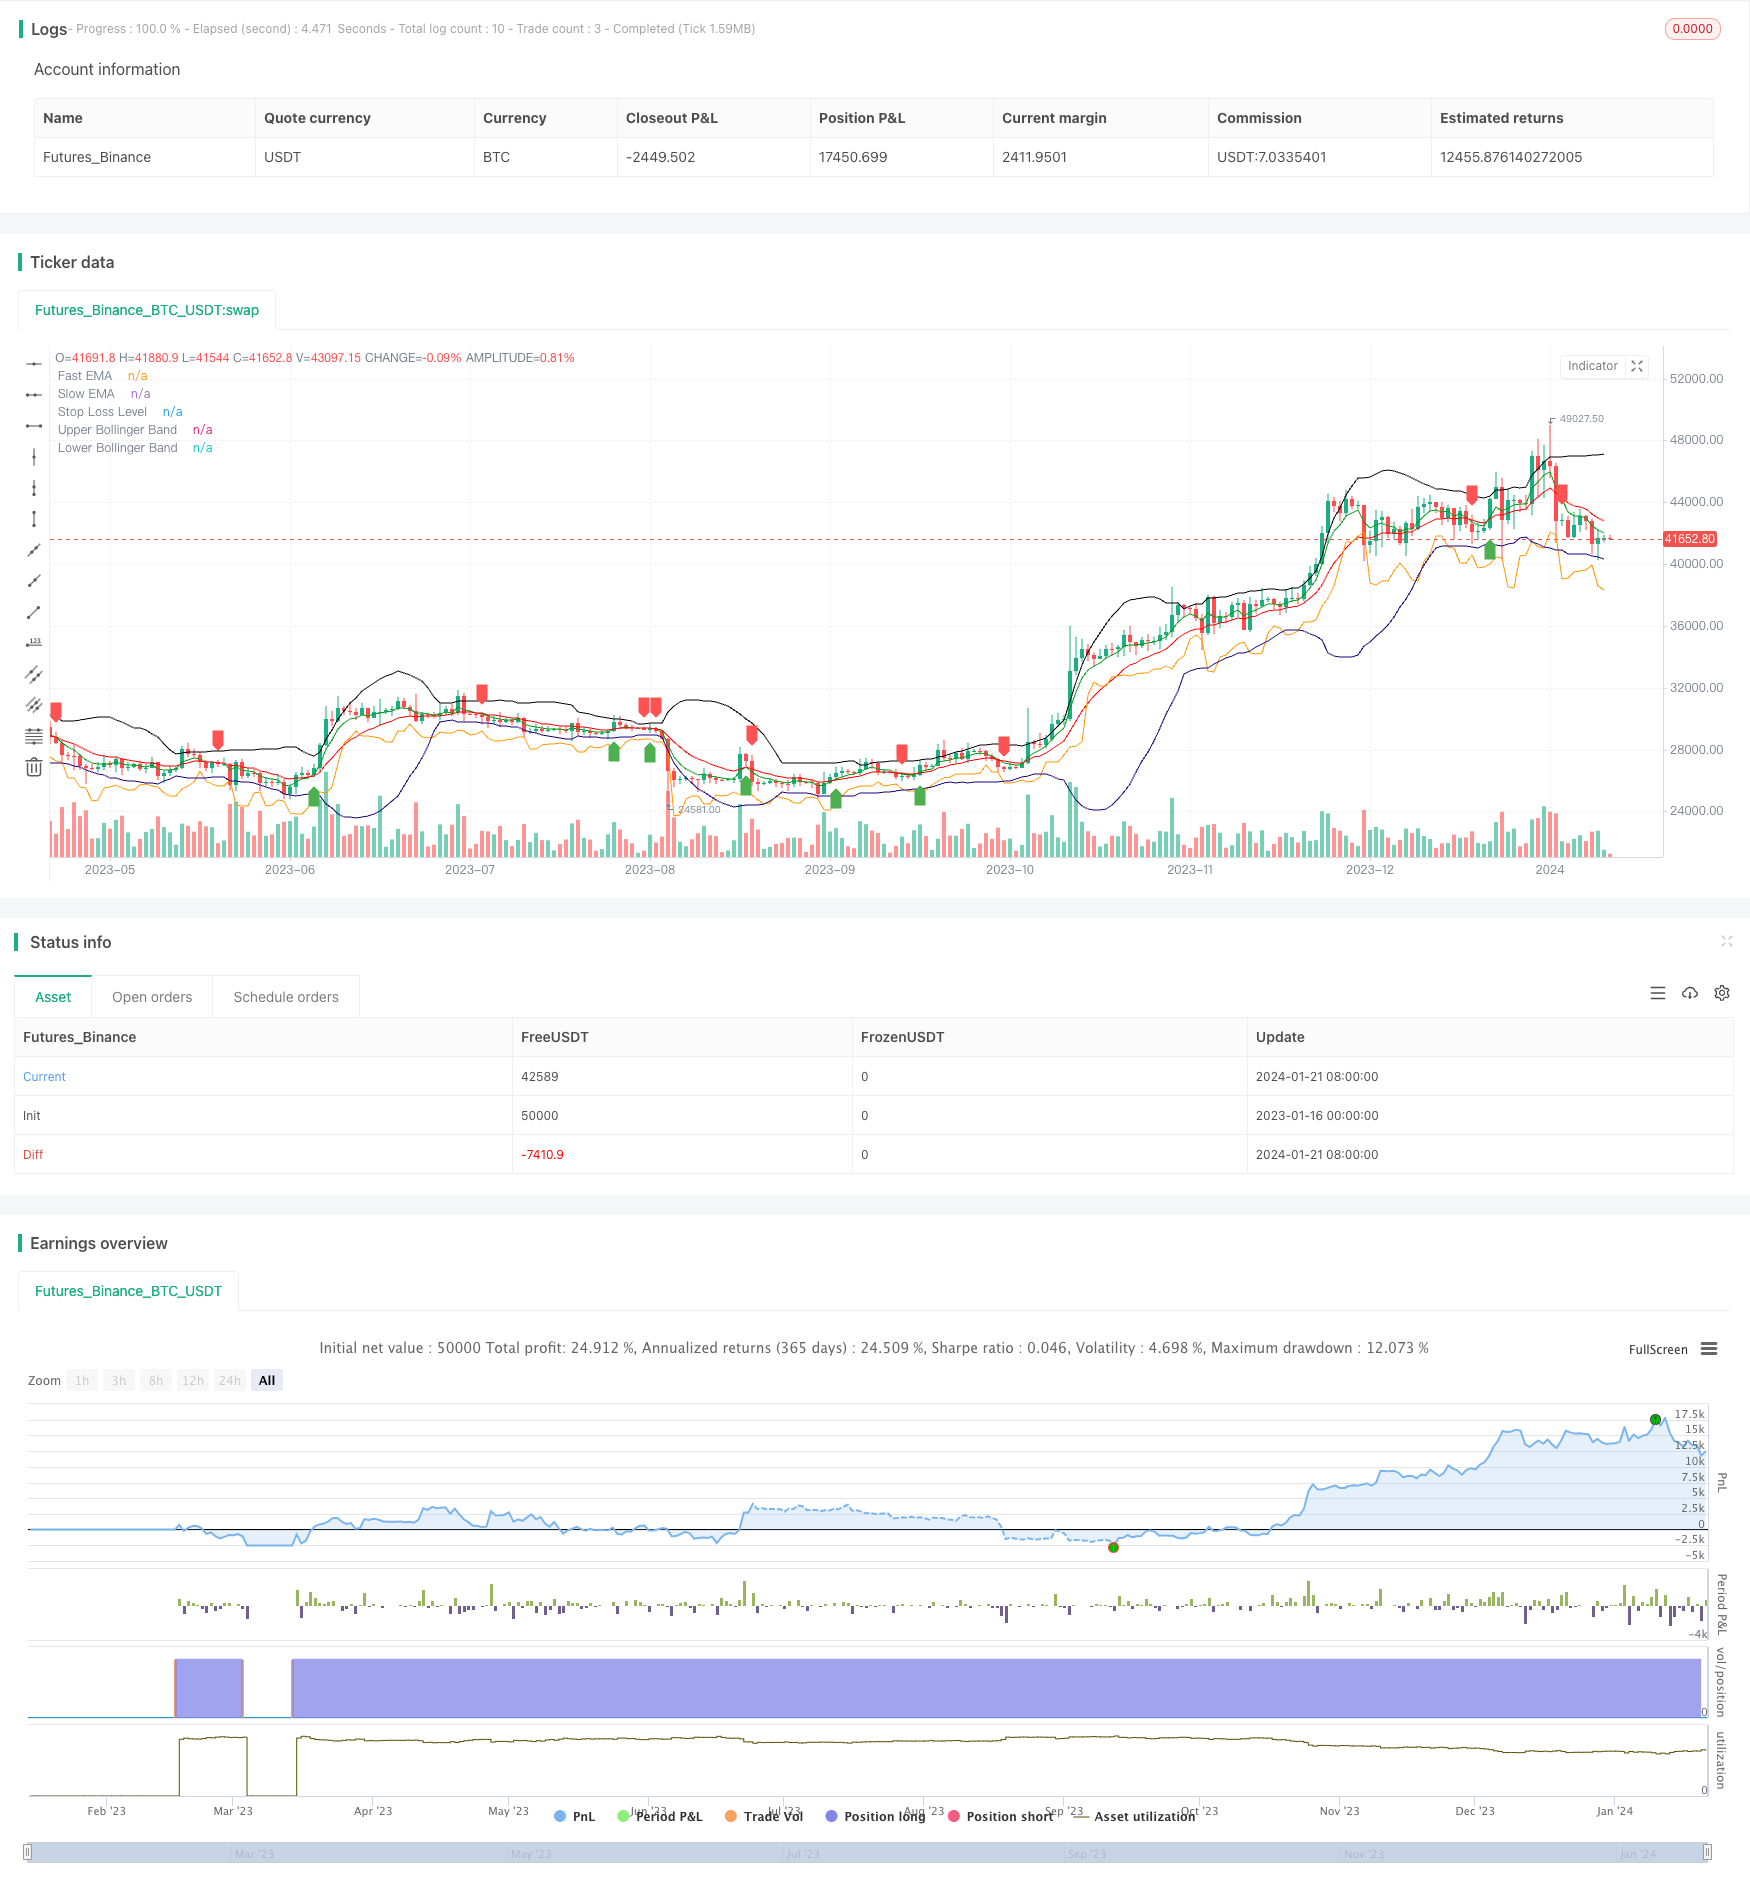
Chiến lược nhảy đôi là một chiến lược định lượng được sử dụng cho giao dịch ngắn hạn Bitcoin và vàng. Nó kết hợp với sử dụng moving average, Brinband và ATR Stop Loss để xác định các tín hiệu đột phá và quản lý rủi ro.
Nguyên tắc chiến lược
Chiến lược nhảy đôi sử dụng sự giao thoa của EMA nhanh và EMA chậm để đánh giá xu hướng. Khi EMA nhanh vượt lên EMA chậm, nó tạo ra tín hiệu mua; Khi EMA nhanh vượt xuống EMA chậm, nó tạo ra tín hiệu bán. Để tránh phá vỡ giả, chiến lược yêu cầu tín hiệu phá vỡ phải xảy ra trên đường ray hoặc gần đường ray trung tâm của băng Brin, đó là lý do tại sao các cặp nhảy trống xuất phát.
Cụ thể, khi đánh giá tín hiệu mua, cần phải đáp ứng hai điều kiện sau: 1) EMA nhanh trên EMA chậm; 2) Giá đóng cửa gần hoặc thấp hơn Brin trên đường ray hoặc đường ray trung bình.
Ngoài ra, chiến lược nhảy đôi cũng sử dụng chỉ số ATR để tính toán dừng động để kiểm soát rủi ro của một giao dịch. Vị trí dừng cụ thể là điểm thấp nhất của hai đường K gần nhất và trừ ATR N lần.
Lợi thế chiến lược
- Sử dụng điều kiện lọc kép để nhận diện tín hiệu đột phá có khả năng cao
- Quick EMA crossover đánh giá xu hướng chính, Brin có đột phá giả mạo
- Động thái ATR Stop Loss có hiệu quả kiểm soát rủi ro giao dịch đơn lẻ
- Giao dịch đường ngắn phù hợp với các chỉ số biến động cao như Bitcoin
Rủi ro chiến lược
- Các tham số EMA nhanh và EMA chậm được thiết lập không đúng có thể tạo ra một số lượng lớn tín hiệu giả
- Các tham số Brin không đúng cũng làm giảm hiệu quả lọc.
- Cài đặt vị trí dừng quá chặt có thể làm tăng khả năng dừng được kích hoạt
- Giao dịch đường ngắn đòi hỏi tần suất giao dịch cao, không phù hợp với các nhà đầu tư có số tiền nhỏ
Tối ưu hóa chiến lược
Chiến lược nhảy dù có thể được tối ưu hóa theo các khía cạnh sau:
- Tối ưu hóa các tham số của đường trung bình di chuyển để tìm ra sự kết hợp tốt nhất của độ dài EMA chậm và nhanh
- Tối ưu hóa tham số Brinh và giảm tỷ lệ đột phá giả
- Tỷ số của ATR dừng lỗ điều chỉnh cho các loại giao dịch khác nhau và môi trường thị trường
- Tăng tín hiệu re-entry, tức là re-entry sau khi thoát khỏi stop loss
- Kết hợp với các chỉ số khác để hỗ trợ, chẳng hạn như RSI, KD, v.v.
Tóm tắt
Chiến lược nhảy hai cùng một lúc sử dụng theo dõi xu hướng và lọc phá vỡ, có thể xác định hiệu quả các cơ hội đường ngắn. Kết hợp với rủi ro quản lý lỗ hổng động, rất phù hợp để giao dịch đường ngắn với các loại tiền kỹ thuật số và kim loại quý có tỷ lệ biến động cao.
/*backtest
start: 2023-01-16 00:00:00
end: 2024-01-22 00:00:00
period: 1d
basePeriod: 1h
exchanges: [{"eid":"Futures_Binance","currency":"BTC_USDT"}]
*/

// This source code is subject to the terms of the Mozilla Public License 2.0 at https://mozilla.org/MPL/2.0/
// © singhak8757

//@version=5
strategy("Bitcoin and Gold 5min Scalping Strategy2.0", overlay=true)


// Input parameters
fastLength = input(5, title="Fast EMA Length")
slowLength = input(13, title="Slow EMA Length")
bollingerLength = input(20, title="Bollinger Band Length")
bollingerMultiplier = input(2, title="Bollinger Band Multiplier")
stopLossMultiplier = input(1, title="Stop Loss Multiplier")

// Calculate EMAs
fastEMA = ta.ema(close, fastLength)
slowEMA = ta.ema(close, slowLength)

// Calculate Bollinger Bands
basis = ta.sma(close, bollingerLength)
upperBand = basis + bollingerMultiplier * ta.stdev(close, bollingerLength)
lowerBand = basis - bollingerMultiplier * ta.stdev(close, bollingerLength)

// Buy condition
buyCondition = ta.crossover(fastEMA, slowEMA) and (close <= upperBand or close <= basis)

// Sell condition
sellCondition = ta.crossunder(fastEMA, slowEMA) and (close >= lowerBand or close >= basis)

// Calculate stop loss level
stopLossLevel = ta.lowest(low, 2)[1] - stopLossMultiplier * ta.atr(14)

// Plot EMAs
plot(fastEMA, color=color.rgb(0, 156, 21), title="Fast EMA")
plot(slowEMA, color=color.rgb(255, 0, 0), title="Slow EMA")

// Plot Bollinger Bands
plot(upperBand, color=color.new(#000000, 0), title="Upper Bollinger Band")
plot(lowerBand, color=color.new(#1b007e, 0), title="Lower Bollinger Band")

// Plot Buy and Sell signals
plotshape(series=buyCondition, title="Buy Signal", color=color.green, style=shape.labelup, location=location.belowbar)
plotshape(series=sellCondition, title="Sell Signal", color=color.red, style=shape.labeldown, location=location.abovebar)

// Plot Stop Loss level
plot(stopLossLevel, color=color.orange, title="Stop Loss Level")

// Strategy logic
strategy.entry("Buy", strategy.long, when = buyCondition)
strategy.exit("Stop Loss/Close", from_entry="Buy", loss=stopLossLevel)
strategy.close("Sell", when = sellCondition)