Chiến lược phân kỳ dựa trên đường trung bình động

1
Follow
1788
Followers
Tổng quan
Chiến lược này tìm ra sự lệch giữa giá và đường trung bình di chuyển bằng cách tính toán đường trung bình di chuyển và điểm trung tâm của nó, làm tín hiệu mua và bán. Nó có thể được áp dụng cho bất kỳ chỉ số dao động nào để tìm ra sự lệch. Đây là một công cụ có giá trị, có thể được sử dụng để kiểm tra lại và giao dịch trực tiếp.
Nguyên tắc chiến lược
- Tính toán chiều dài là trung bình di chuyển của Len (MA)
- Kiểm tra điểm trục thấp của MA ((PL) và điểm trục cao ((PH)
- Xác định có sự sai lệch thẳng hay không: giá sáng tạo thấp mà MA không sáng tạo thấp hoặc giá sáng tạo thấp mà MA sáng tạo thấp
- Xác định có sự đảo ngược hay không: giá sáng tạo cao nhưng MA không sáng tạo cao hoặc giá không sáng tạo cao nhưng MA sáng tạo cao
- Mua và bán tùy theo hoàn cảnh.
Phân tích lợi thế
- Có thể tự động phát hiện sự lệch giữa giá và MA, tránh sai lầm phán đoán bằng tay
- Có thể áp dụng cho bất kỳ chỉ số dao động, mở rộng mạnh mẽ
- Có thể được sử dụng để kiểm tra lại khả năng lợi nhuận của chiến lược xác minh
- Các tham số có thể cấu hình điều chỉnh độ nhạy để tránh tín hiệu sai
- Cung cấp nhiều loại loại khác nhau để đánh giá chính xác và toàn diện
Phân tích rủi ro
- Nếu chỉ số dao động được thiết lập không chính xác, có thể tạo ra một số lượng lớn các tín hiệu sai
- Tránh xa các điểm trung tâm cần thiết trước khi xảy ra, có thể xảy ra tín hiệu kém
- Cần điều chỉnh các tham số để cân bằng độ nhạy và lọc các tín hiệu sai
- Tác dụng tốt hơn khi kết hợp với các yếu tố khác, sử dụng một mình có độ tin cậy thấp hơn
Hướng tối ưu hóa
- Tối ưu hóa các tham số trung bình di chuyển để tìm các tham số kết hợp tốt nhất
- Kết hợp với các chỉ số khác như chỉ số giá cả để tránh tín hiệu sai
- Thêm mô hình học máy đánh giá không đáng tin cậy
- Tăng cơ chế quản lý rủi ro, kiểm soát tổn thất đơn lẻ
Tóm tắt
Chiến lược này có thể được sử dụng rộng rãi cho bất kỳ chỉ số dao động nào, có khả năng mở rộng mạnh mẽ. Cần kết hợp các tham số tối ưu hóa với các chỉ số khác để tăng đáng kể độ tin cậy và sự ổn định của hệ thống.
Source
Pine
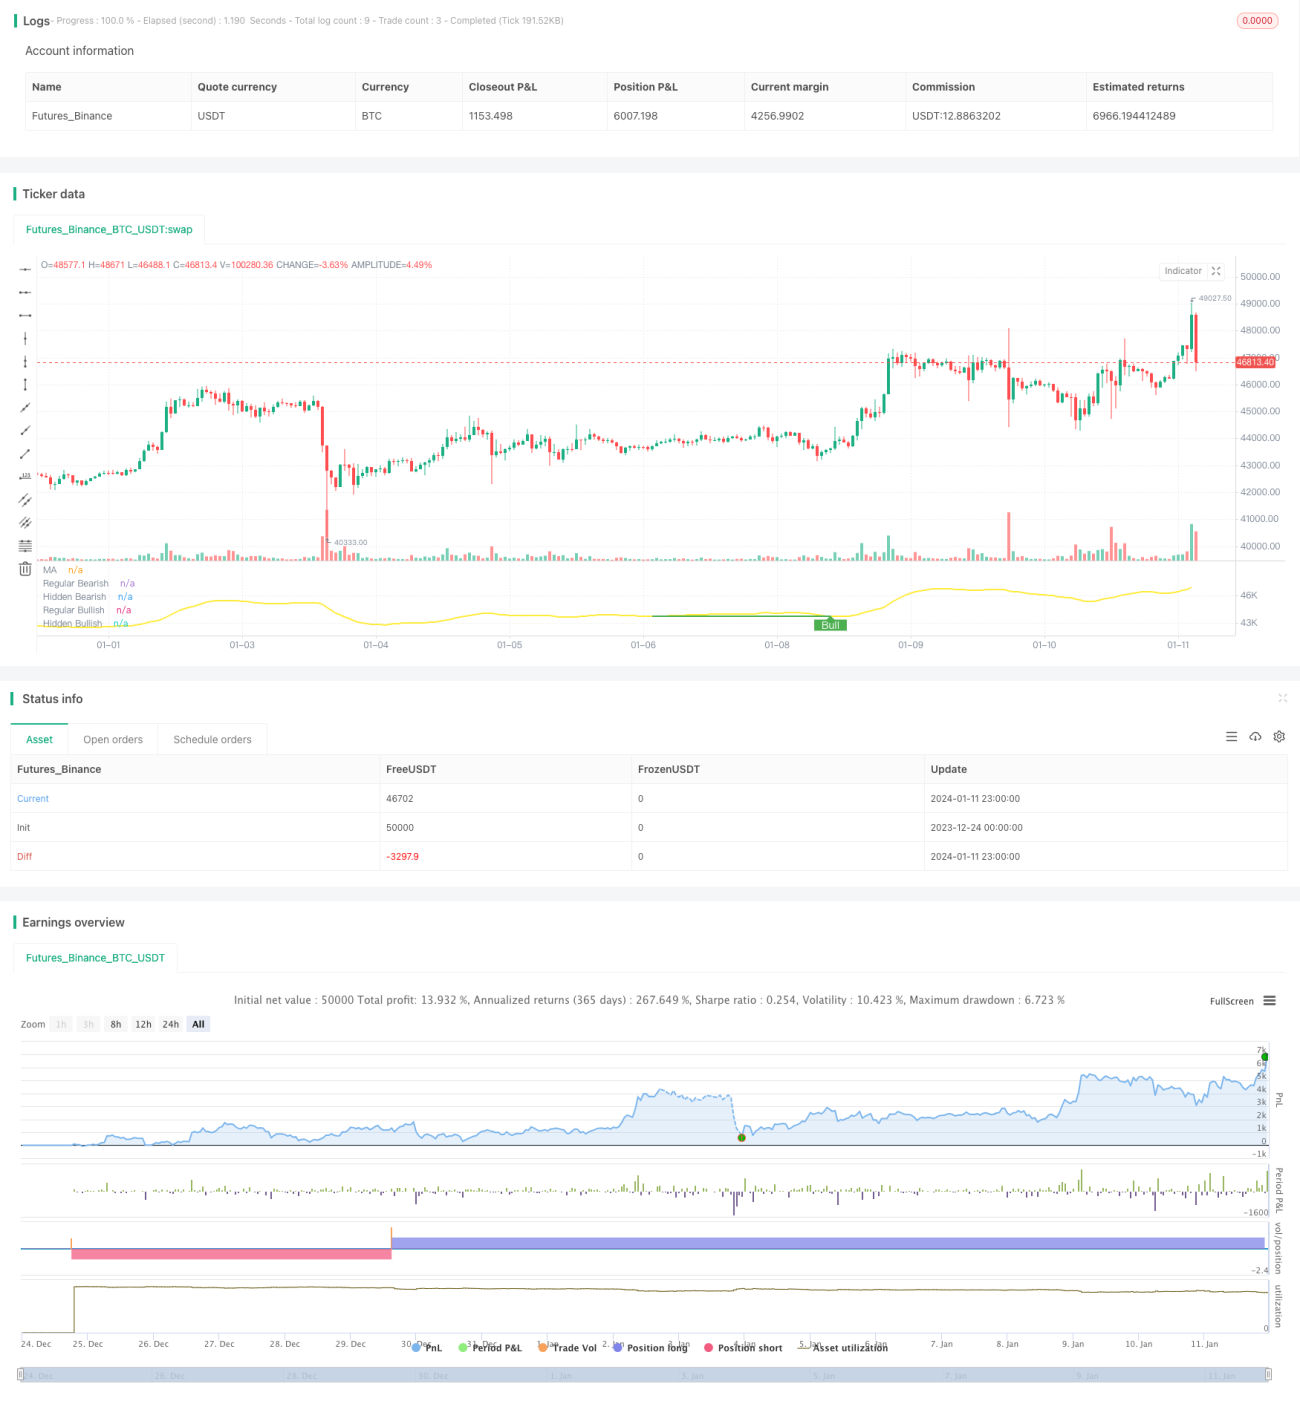
/*backtest
start: 2023-12-24 00:00:00
end: 2024-01-12 00:00:00
period: 1h
basePeriod: 15m
exchanges: [{"eid":"Futures_Binance","currency":"BTC_USDT"}]
*/

// This source code is subject to the terms of the Mozilla Public License 2.0 at https://mozilla.org/MPL/2.0/
// © tista
//https://www.tradingview.com/u/tista/#published-scripts
Strategy parameters
Related strategies
Comment
All comments (0)
No data
- 1