Chiến lược định lượng RSI và Bollinger Bands
Tổng quan
Chiến lược này chủ yếu sử dụng các chỉ số tương đối mạnh mẽ (RSI) để đánh giá tín hiệu giao dịch với Bollinger Bands. Cụ thể, khi RSI thấp và Bollinger Bands giao thoa, bạn sẽ làm nhiều hơn khi RSI cao và Bollinger Bands giao thoa.
Nguyên tắc chiến lược
Chiến lược này bắt đầu bằng cách tính toán các chỉ số RSI và Bollinger Bands. RSI phản ánh sự tương đối mạnh mẽ của giao dịch khi RSI thấp hơn vùng bán tháo (đặc biệt là 30), đại diện cho việc giao dịch nằm trong vùng bán tháo, lúc đó mua. Bollinger Band bao gồm đường lên, đường giữa và đường xuống, phản ánh tốt phạm vi biến động của giá.
Lợi thế chiến lược
- Kết hợp với chỉ số RSI và BRI để tăng độ chính xác của tín hiệu
- Chỉ số RSI đã lọc một số tín hiệu nhiễu
- Các vùng Brin phản ánh phạm vi lớn của biến động thị trường hiện tại, tín hiệu đáng tin cậy hơn
- Chiến lược giao dịch nghiêm ngặt hơn, tránh các giao dịch không hợp lệ
Rủi ro chiến lược
- Thiết lập không chính xác các tham số của Brin có thể làm cho tín hiệu giao dịch không chính xác
- RSI Overbought và OverSold: Các tham số không được thiết lập đúng cũng có thể ảnh hưởng đến việc đánh giá tín hiệu
- Chiến lược nghiêm ngặt hơn, có thể bỏ lỡ một số cơ hội giao dịch
Phương pháp giải quyết rủi ro:
- Tối ưu hóa tham số Brin và tham số RSI để tìm các tham số kết hợp tốt nhất
- Điều kiện giao dịch của chiến lược được nới lỏng thích hợp, tăng một số giao dịch không có hiệu lực để có thêm cơ hội
Hướng tối ưu hóa chiến lược
- Kiểm tra và tối ưu hóa các tham số RSI và tham số Brin để tìm các tham số tối ưu
- Tăng chiến lược dừng lỗ để kiểm soát rủi ro giao dịch
- Xem xét thêm các chỉ số kỹ thuật khác để xác nhận tín hiệu, chẳng hạn như MACD
- Kiểm tra hiệu quả tối ưu hóa tham số cho các giống và chu kỳ thời gian khác nhau
Tóm tắt
Chiến lược này khá mạnh mẽ, kết hợp hiệu quả với chỉ số RSI và dừng Bollinger Bands. Bằng cách kiểm tra và tối ưu hóa các tham số, hiệu quả của chiến lược có thể được nâng cao hơn nữa.
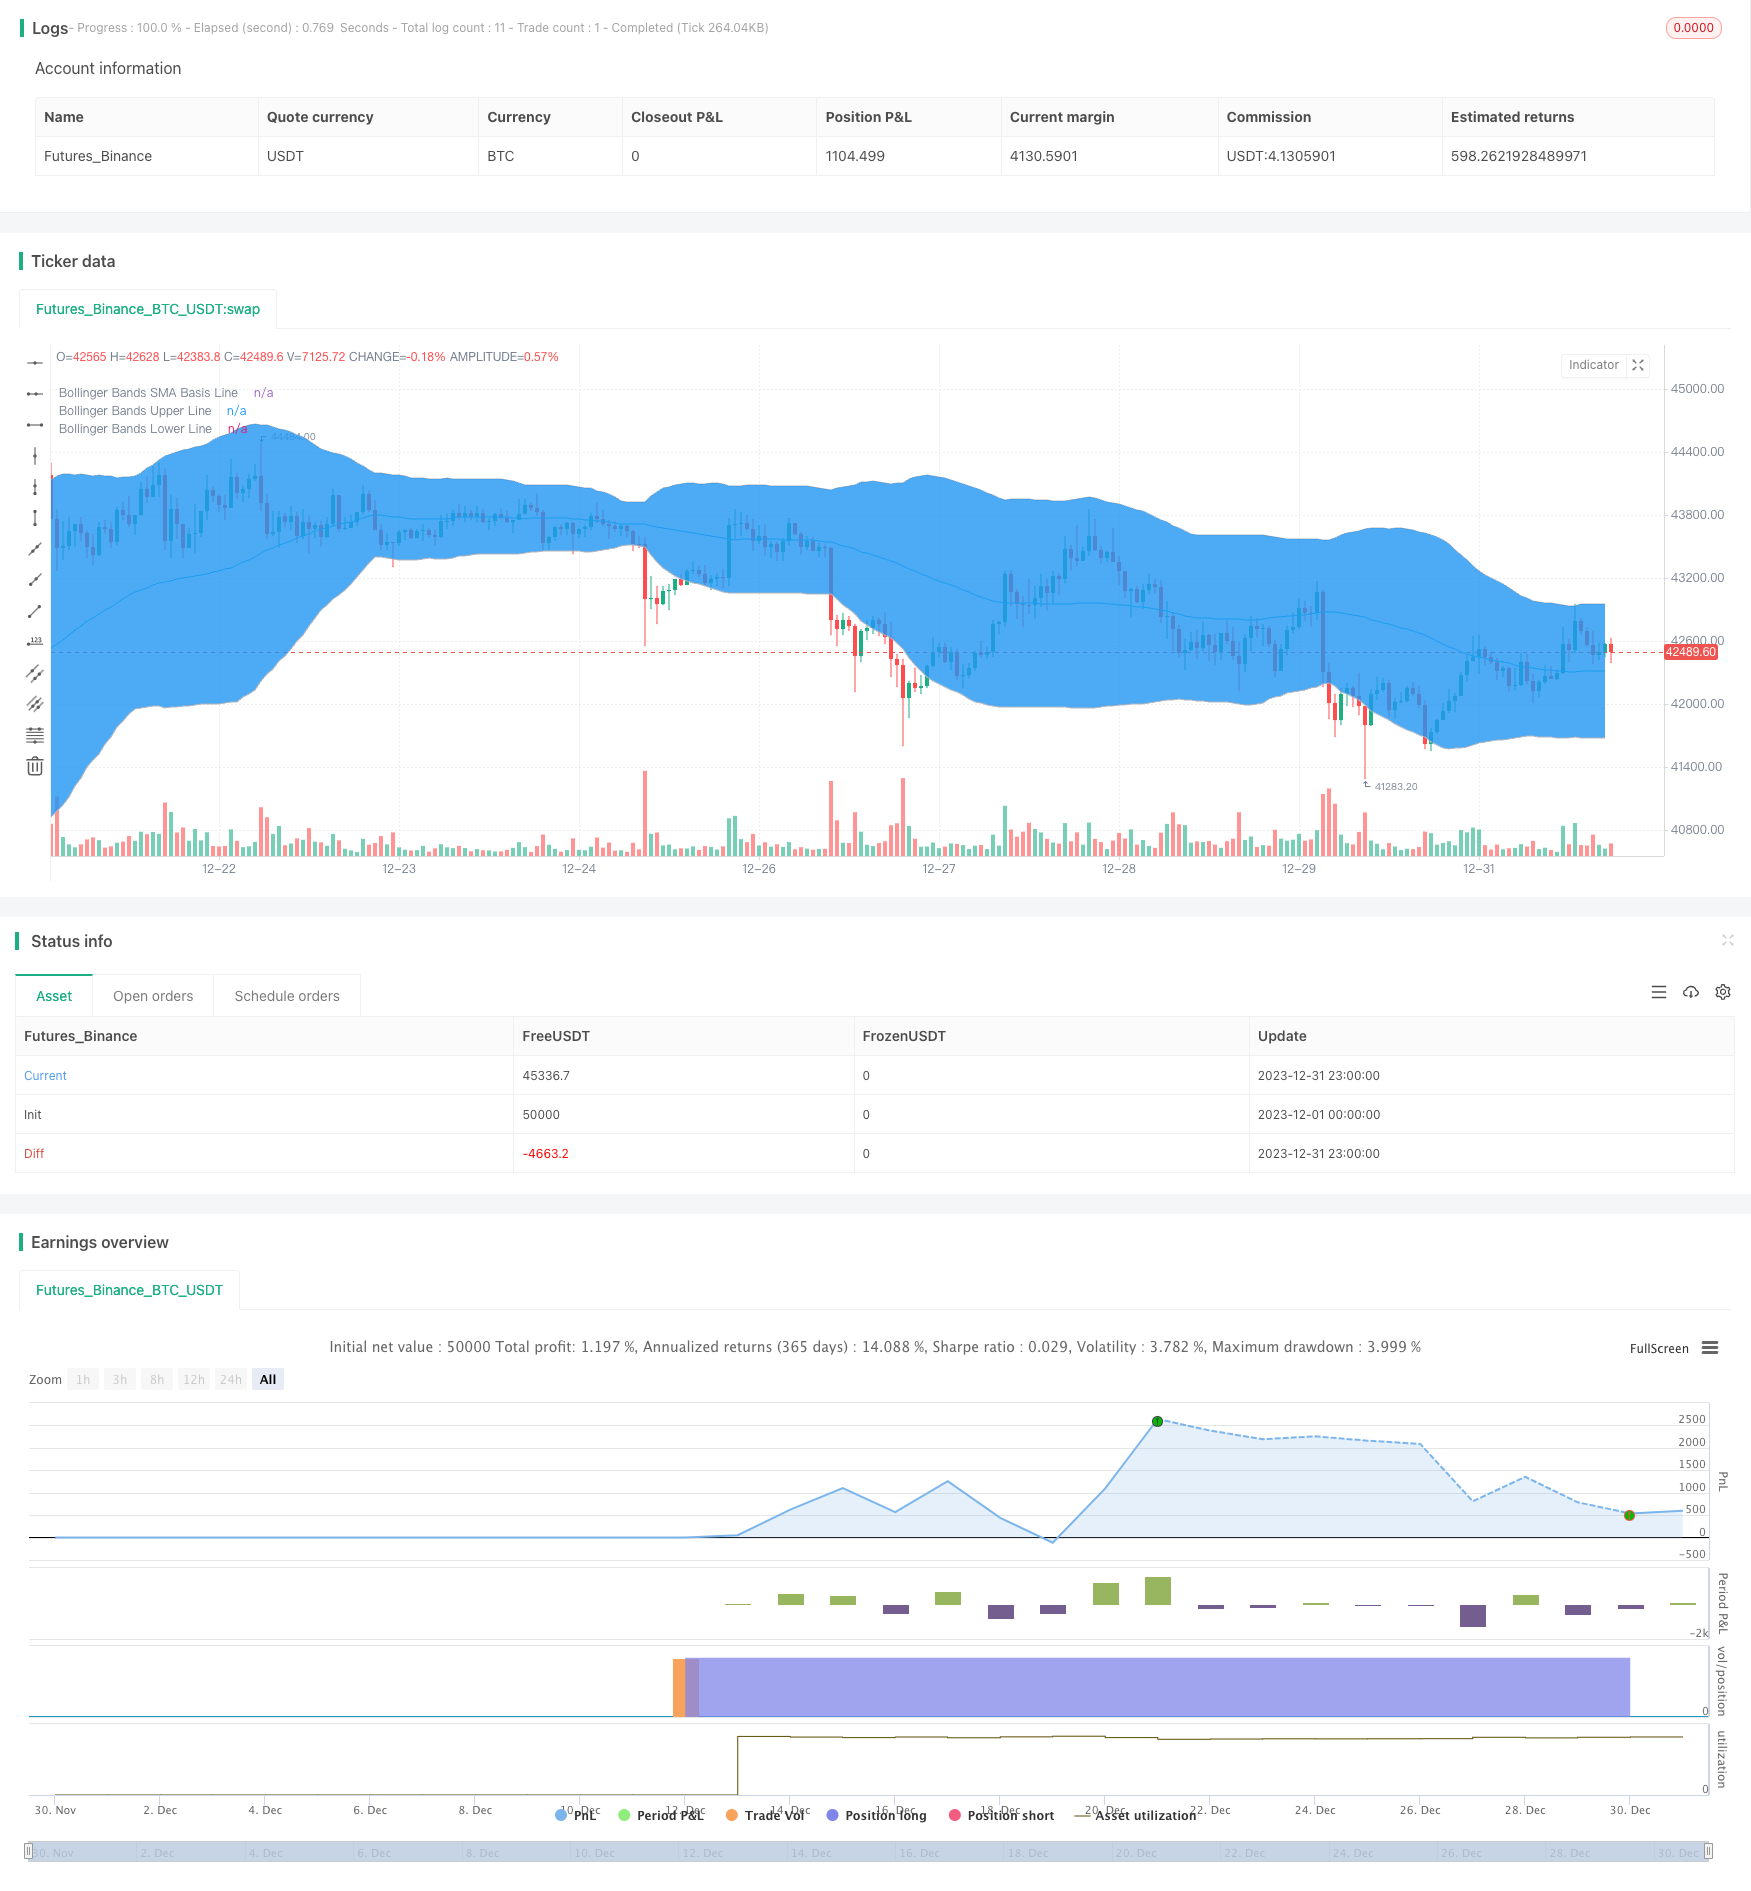
/*backtest
start: 2023-12-01 00:00:00
end: 2023-12-31 23:59:59
period: 1h
basePeriod: 15m
exchanges: [{"eid":"Futures_Binance","currency":"BTC_USDT"}]
*/

//@version=2
strategy("BB + RSI 20MIN,", shorttitle="BBRSI 20MIN", overlay=true )

     // Strategy Tester Start Time
sYear = input(2019, title = "Start Year")
sMonth = input(04, title = "Start Month", minval = 01, maxval = 12)
sDay = input(01, title = "Start Day", minval = 01, maxval = 31)
sHour = input(00, title = "Start Hour", minval = 00, maxval = 23)
sMinute = input(00, title = "Start Minute", minval = 00, maxval = 59)
startTime = true


///////////// RSI
RSIlength = input(9,title="RSI Period Length")
RSIoverSold = input(30, minval=1,title="RSIL")
RSIoverBought = input(69, minval=1,title="RSIh")
price = open
vrsi = rsi(price, RSIlength)


///////////// Bollinger Bands
BBlength = input(60, minval=1,title="Bollinger Period Length")
BBmult = input(2.0, minval=0.001, maxval=50,title="Bb")
BBbasis = sma(price, BBlength)
BBdev = BBmult * stdev(price, BBlength)
BBupper = BBbasis + BBdev
BBlower = BBbasis - BBdev
source = close
buyEntry = crossover(source, BBlower)
sellEntry = crossunder(source, BBupper)
plot(BBbasis, color=aqua,title="Bollinger Bands SMA Basis Line")
p1 = plot(BBupper, color=silver,title="Bollinger Bands Upper Line")
p2 = plot(BBlower, color=silver,title="Bollinger Bands Lower Line")
fill(p1, p2)


///////////// Colors
switch1=input(true, title="Enable Bar Color?")
switch2=input(true, title="Enable Background Color?")
TrendColor = RSIoverBought and (price[1] > BBupper and price < BBupper) and BBbasis < BBbasis[1] ? red : RSIoverSold and (price[1] < BBlower and price > BBlower) and BBbasis > BBbasis[1] ? green : na
barcolor(switch1?TrendColor:na)
bgcolor(switch2?TrendColor:na,transp=50)


///////////// RSI + Bollinger Bands Strategy
if (not na(vrsi))

    if (crossover(vrsi, RSIoverSold) and crossover(source, BBlower))
        strategy.entry("RSI_BB_L", strategy.long and startTime, stop=BBlower,  comment="RSI_BB_L")
    else
        strategy.cancel(id="RSI_BB_L")

    if (crossunder(vrsi, RSIoverBought) and crossunder(source, BBupper))
        strategy.entry("RSI_BB_S", strategy.short and startTime, stop=BBupper,comment="RSI_BB_S")
    else
        strategy.cancel(id="RSI_BB_S")

//plot(strategy.equity, title="equity", color=red, linewidth=2, style=areabr)