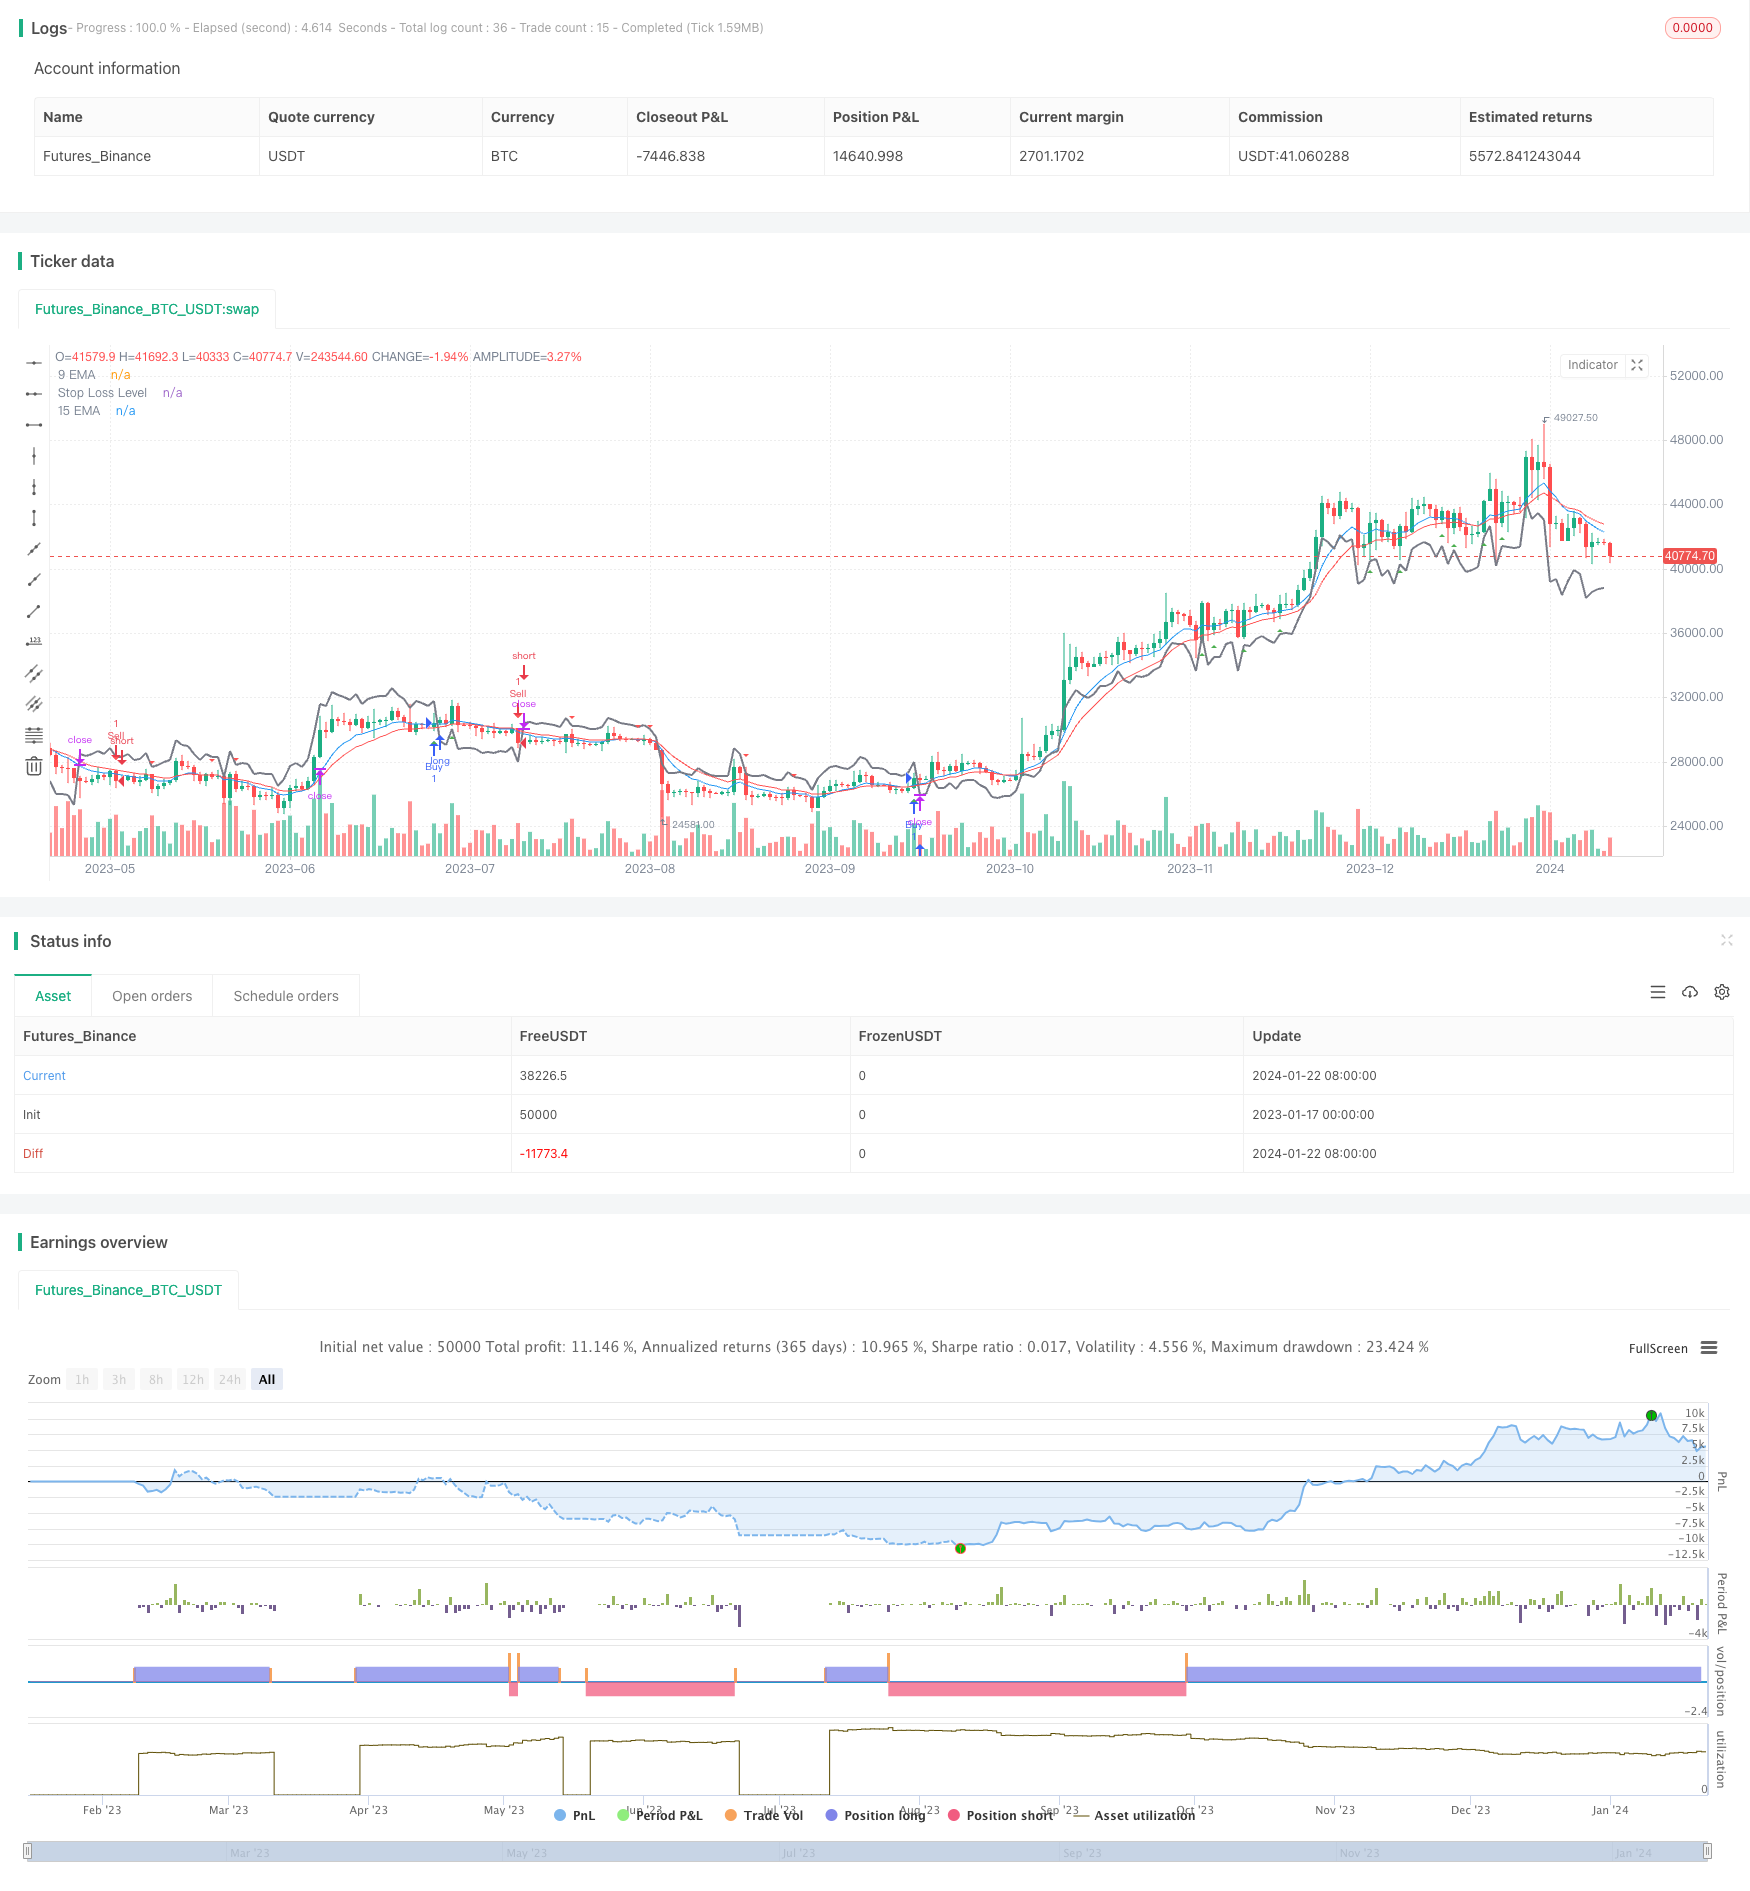
Chiến lược giao dịch chảo trong ngày dựa trên EMA
Tóm tắt
Chiến lược này được sử dụng để giao dịch đường ngắn trong ngày bằng cách tính toán các đường trung bình di chuyển chỉ số vào ngày 9 và ngày 15 để xác định các tín hiệu mua và bán hình thành từ EMA Gold Forks và Dead Forks. Một tín hiệu mua được tạo ra khi 9EMA đi 15EMA và một đường K gần nhất là đường dương; một tín hiệu bán được tạo ra khi 9EMA đi 15EMA dưới 9EMA và một đường K gần nhất là đường âm.
Nguyên tắc chiến lược
- Tính EMA ngày 9 và 15
- Xác định tính thăng trầm của một đường K gần nhất để xác định là đường dương hay đường dương
- Một tín hiệu mua được tạo ra khi 9 EMA bị 15 EMA, và một K gần nhất là dương
- Khi 9EMA đi qua 15EMA, và một K gần nhất là âm
- Tính toán ATR bằng chỉ số ATR, vẽ đường dừng lỗ khi giữ vị trí
Phân tích lợi thế
Chiến lược này có những ưu điểm sau:
- Sử dụng các chỉ số EMA kép để nắm bắt xu hướng trung hạn ngắn hạn
- Kiểm tra tín hiệu giả hướng thực thể kết hợp với đường K
- Sử dụng ATR để kiểm soát rủi ro trong khi đảm bảo lợi nhuận
- Chu kỳ ngắn, thích hợp để sử dụng biến động giá đường ngắn để giao dịch trong ngày
- Hoạt động đơn giản, dễ thực hiện
Phân tích rủi ro
Chiến lược này cũng có một số rủi ro:
- Chỉ số EMA có tính chậm trễ, có thể bỏ lỡ một số biến động giá
- Tỷ lệ trung bình hai EMA có thể tạo ra tín hiệu whipsaws
- Giao dịch đường ngắn trong ngày dễ bị ảnh hưởng bởi biến động giá
- Khoảng cách dừng quá nhỏ có thể dễ dàng bị phá vỡ, quá lớn sẽ ảnh hưởng đến lợi nhuận
Phản ứng:
- Điều chỉnh thích hợp các tham số EMA để rút ngắn chu kỳ trung bình
- Kết hợp với các chỉ số khác như MACD để lọc tín hiệu
- Động thái điều chỉnh khoảng cách dừng, tối ưu hóa chiến lược dừng
Hướng tối ưu hóa
Chiến lược này có thể được tối ưu hóa theo các khía cạnh sau:
- Kiểm tra các kết hợp tham số EMA khác nhau để tìm chu kỳ trung bình tốt nhất
- Thêm các chỉ số khác để xây dựng mô hình đa yếu tố
- Sử dụng lọc thời gian, chỉ phát tín hiệu trong một khoảng thời gian nhất định
- Kết hợp với chỉ số dao động, điều chỉnh khoảng cách dừng
- Các tham số tối ưu hóa động bằng công nghệ học máy
Tóm tắt
Chiến lược này kết hợp hai chỉ số EMA để xác định hướng xu hướng và tín hiệu lọc thực thể K-line, sử dụng ATR dừng động, là một chiến lược giao dịch trong ngày đơn giản và thực tế. Bằng cách tối ưu hóa tham số và kết hợp nhiều yếu tố, bạn có thể nâng cao hơn nữa sự ổn định và lợi nhuận của chiến lược.
/*backtest
start: 2023-01-17 00:00:00
end: 2024-01-23 00:00:00
period: 1d
basePeriod: 1h
exchanges: [{"eid":"Futures_Binance","currency":"BTC_USDT"}]
*/

//@version=5
strategy("EMA Scalping Strategy", shorttitle="EMAScalp", overlay=true)

// Input parameters
ema9_length = input(9, title="9 EMA Length")
ema15_length = input(15, title="15 EMA Length")

// Calculate EMAs
ema9 = ta.ema(close, ema9_length)
ema15 = ta.ema(close, ema15_length)

// Plot EMAs on the chart
plot(ema9, color=color.blue, title="9 EMA")
plot(ema15, color=color.red, title="15 EMA")

// Identify Bullish and Bearish candles
bullish_candle = close > open
bearish_candle = close < open

// Bullish conditions for Buy Signal
buy_condition = ta.crossover(close, ema9) and ema15 < ema9 and bullish_candle

// Bearish conditions for Sell Signal
sell_condition = ta.crossunder(close, ema9) and ema15 > ema9 and bearish_candle

// Plot Buy and Sell signals
plotshape(series=buy_condition, title="Buy Signal", color=color.green, style=shape.triangleup, location=location.belowbar)
plotshape(series=sell_condition, title="Sell Signal", color=color.red, style=shape.triangledown, location=location.abovebar)

// Optional: Add stop-loss levels
atr_length = input(14, title="ATR Length for Stop Loss")
atr_multiplier = input(1.5, title="ATR Multiplier for Stop Loss")

atr_value = ta.atr(atr_length)
stop_loss_level = strategy.position_size > 0 ? close - atr_multiplier * atr_value : close + atr_multiplier * atr_value
plot(stop_loss_level, color=color.gray, title="Stop Loss Level", linewidth=2)

// Strategy rules
if (buy_condition)
    strategy.entry("Buy", strategy.long)
    strategy.exit("Exit Buy", from_entry="Buy", loss=stop_loss_level)

if (sell_condition)
    strategy.entry("Sell", strategy.short)
    strategy.exit("Exit Sell", from_entry="Sell", loss=stop_loss_level)