Chiến lược giao dịch hỗ trợ và kháng cự
Ngày tạo:
2024-01-25 15:53:06
sửa đổi lần cuối:
2024-01-25 15:53:06
sao chép:
2
Số nhấp chuột:
603
1
tập trung vào
1751
Người theo dõi
Tổng quan
Chiến lược này thực hiện điều khiển chính xác logic giao dịch và chính xác dừng lỗ bằng cách kết hợp chiến lược chéo của RSI, chỉ số ngẫu nhiên, kết hợp chiến lược tối ưu hóa điểm trượt bằng phẳng. Đồng thời, bằng cách giới thiệu tối ưu hóa tín hiệu, có thể kiểm soát xu hướng tốt hơn và quản lý tài chính hợp lý hơn.
Nguyên tắc chiến lược
- Chỉ số RSI đánh giá vùng quá mua quá bán, kết hợp với giá trị K và giá trị D của chỉ số ngẫu nhiên để tạo ra tín hiệu giao dịch.
- Tiếp theo, nó được sử dụng để phân loại các đường K, giúp đánh giá các tín hiệu xu hướng và tránh các giao dịch sai.
- Đường trung bình SMA hỗ trợ xác định xu hướng. Đường trung bình ngắn hạn là tín hiệu lạc quan khi đường trung bình dài hạn bị phá vỡ từ dưới lên.
- Chiến lược điểm trượt bằng phẳng, thiết lập giá dừng lỗ dựa trên phạm vi biến động giá cao nhất và thấp nhất.
Phân tích lợi thế
- Các tham số RSI được tối ưu hóa để đánh giá tốt các khu vực quá mua quá bán và tránh giao dịch sai
- Tối ưu hóa tham số chỉ số STO, điều chỉnh tham số độ mịn, có thể loại bỏ tiếng ồn, cải thiện chất lượng tín hiệu
- Nhập phân tích kỹ thuật Heikin-Ashi để xác định sự thay đổi hướng của thực thể K-line và đảm bảo tính chính xác của tín hiệu giao dịch
- Đường SMA trung bình hỗ trợ định hướng xu hướng lớn, tránh giao dịch ngược
- Kết hợp với chiến lược điểm trượt dừng lỗ để tối đa hóa lợi nhuận trên mỗi giao dịch
Phân tích rủi ro
- Tiền bạc có nhiều rủi ro khi thị trường lớn tiếp tục giảm
- Tần suất giao dịch có thể quá cao, làm tăng chi phí giao dịch và chi phí trượt
- Chỉ số RSI dễ tạo ra tín hiệu giả, nên được lọc khi kết hợp với các chỉ số khác
Tối ưu hóa chiến lược
- Điều chỉnh các tham số RSI để tối ưu hóa phán đoán mua quá mức
- Điều chỉnh tham số chỉ số STO, độ mịn và chu kỳ để cải thiện chất lượng tín hiệu
- Điều chỉnh chu kỳ đường trung bình di chuyển, tối ưu hóa phán đoán xu hướng
- Tiến hành thêm các chỉ số kỹ thuật để tăng độ chính xác của tín hiệu.
- Tối ưu hóa tỷ lệ dừng lỗ, giảm rủi ro giao dịch đơn
Tóm tắt
Chiến lược này tích hợp lợi thế của nhiều chỉ số công nghệ chính thống, cân bằng giữa chất lượng tín hiệu giao dịch và dừng lỗ bằng cách tối ưu hóa tham số và hoàn thiện quy tắc. Có một số tính phổ biến và khả năng lợi nhuận ổn định. Bằng cách tối ưu hóa liên tục, có thể tăng thêm tỷ lệ thắng và lợi nhuận.
Mã nguồn chiến lược
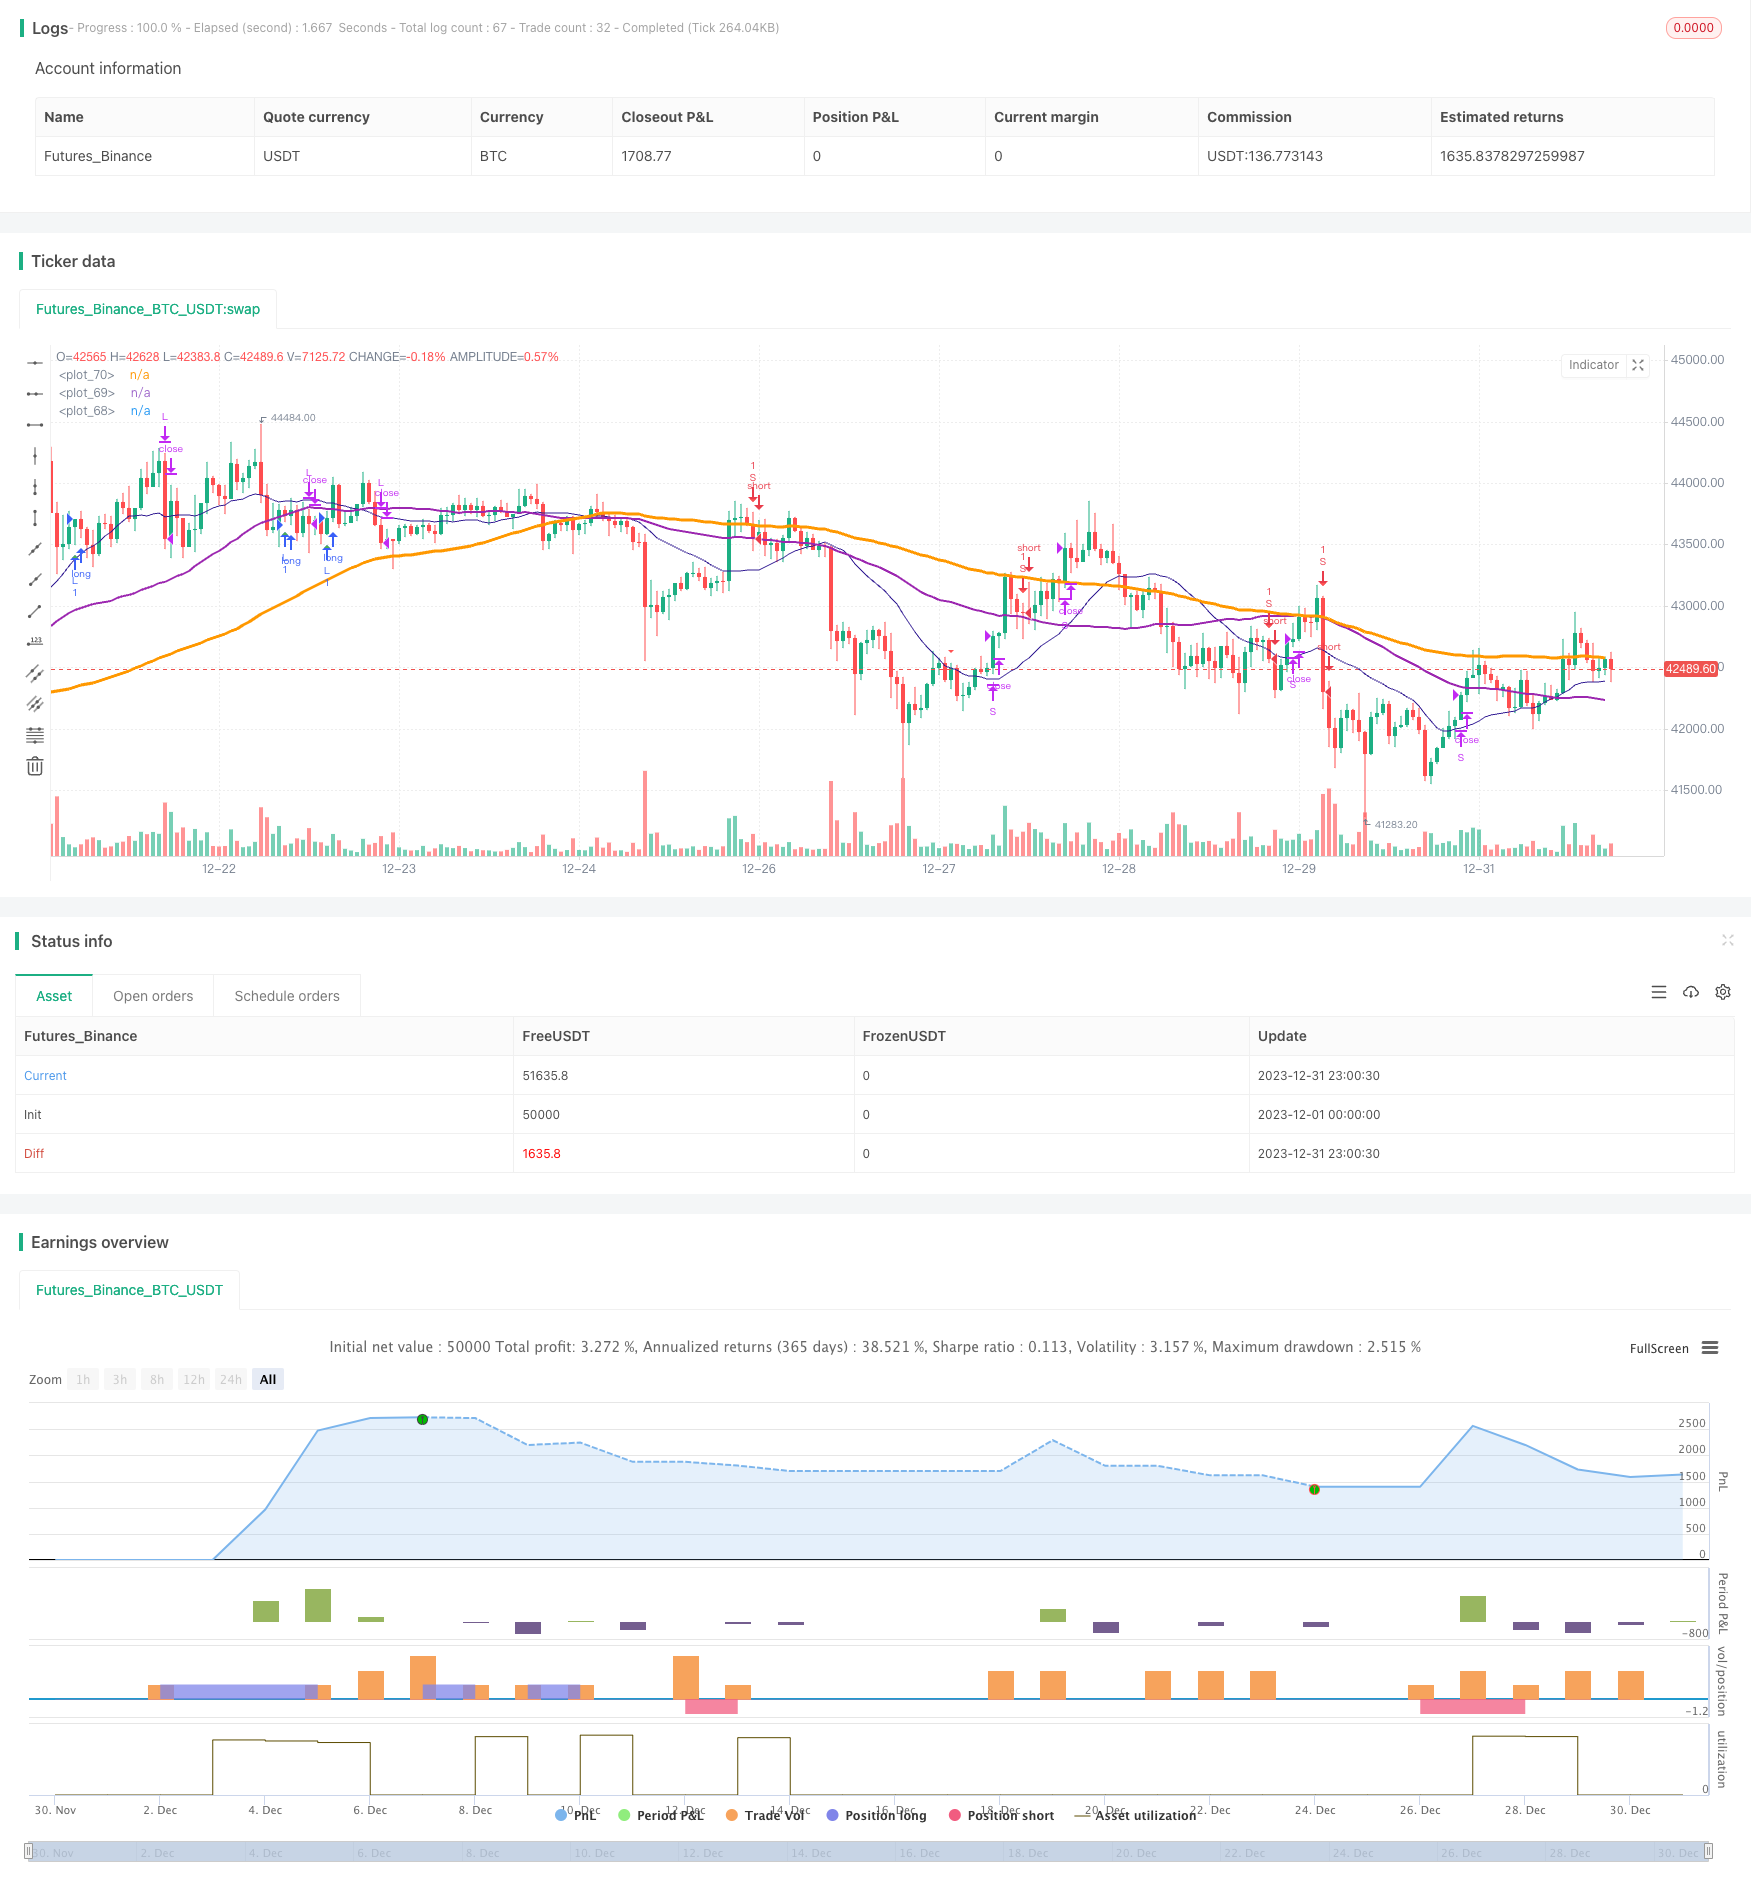
/*backtest
start: 2023-12-01 00:00:00
end: 2023-12-31 23:59:59
period: 1h
basePeriod: 15m
exchanges: [{"eid":"Futures_Binance","currency":"BTC_USDT"}]
*/

//@version=4
//study(title="@sentenzal strategy", shorttitle="@sentenzal strategy", overlay=true)
strategy(title="@sentenzal strategy", shorttitle="@sentenzal strategy", overlay=true  )
smoothK = input(3, minval=1)
smoothD = input(3, minval=1)
lengthRSI = input(14, minval=1)
lengthStoch = input(14, minval=1)
overbought = input(80, minval=1)
oversold = input(20, minval=1)
smaLengh = input(100, minval=1)
smaLengh2 = input(50, minval=1)
smaLengh3 = input(20, minval=1)

src = input(close, title="RSI Source")
testStartYear = input(2017, "Backtest Start Year")
testStartMonth = input(1, "Backtest Start Month")
testStartDay = input(1, "Backtest Start Day")
testPeriodStart = timestamp(testStartYear,testStartMonth,testStartDay,0,0)
testPeriod() =>
    time >= testPeriodStart ? true : false

rsi1 = rsi(src, lengthRSI)
k = sma(stoch(rsi1, rsi1, rsi1, lengthStoch), smoothK)
d = sma(k, smoothD)
crossBuy = crossover(k, d) and k < oversold
crossSell = crossunder(k, d) and k > overbought

dcLower = lowest(low, 10)
dcUpper = highest(high, 10)


heikinashi_close = security(heikinashi(syminfo.tickerid), timeframe.period, close)
heikinashi_open = security(heikinashi(syminfo.tickerid), timeframe.period, open)
heikinashi_low = security(heikinashi(syminfo.tickerid), timeframe.period, low)
heikinashi_high = security(heikinashi(syminfo.tickerid), timeframe.period, high)
heikinashiPositive = heikinashi_close >= heikinashi_open

heikinashiBuy = heikinashiPositive == true and heikinashiPositive[1] == false  and heikinashiPositive[2] == false
heikinashiSell = heikinashiPositive == false and heikinashiPositive[1] == true and heikinashiPositive[2] == true

//plotshape(heikinashiBuy, style=shape.arrowup, color=green, location=location.belowbar, size=size.tiny)
//plotshape(heikinashiSell, style=shape.arrowdown, color=red, location=location.abovebar, size=size.tiny)

buy = (crossBuy == true or crossBuy[1] == true or crossBuy[2] == true) and (heikinashiBuy == true or heikinashiBuy[1] == true or heikinashiBuy[2] == true)
sell = (crossSell == true or crossSell[1] == true or crossSell[2] == true) and (heikinashiSell == true or heikinashiSell[1] == true or heikinashiSell[2] == true)

mult = timeframe.period == '15' ? 4 : 1
mult2 = timeframe.period == '240' ? 0.25 : mult

movingAverage = sma(close, round(smaLengh))
movingAverage2 = sma(close, round(smaLengh2))
movingAverage3 = sma(close, round(smaLengh3))

uptrend = movingAverage < movingAverage2 and movingAverage2 < movingAverage3 and close > movingAverage
downtrend = movingAverage > movingAverage2 and movingAverage2 > movingAverage3 and close < movingAverage

signalBuy = (buy[1] == false and buy[2] == false and buy == true) and uptrend
signalSell = (sell[1] == false and sell[2] == false and sell == true) and downtrend

takeProfitSell = (buy[1] == false and buy[2] == false and buy == true) and uptrend == false
takeProfitBuy = (sell[1] == false and sell[2] == false and sell == true)  and uptrend

plotshape(signalBuy, style=shape.triangleup, color=green, location=location.belowbar, size=size.tiny)
plotshape(signalSell, style=shape.triangledown, color=red, location=location.abovebar, size=size.tiny)


plot(movingAverage, linewidth=3, color=orange, transp=0)
plot(movingAverage2, linewidth=2, color=purple, transp=0)
plot(movingAverage3, linewidth=1, color=navy, transp=0)

alertcondition(signalBuy, title='Signal Buy', message='Signal Buy')
alertcondition(signalSell, title='Signal Sell', message='Signal Sell')


strategy.close("L", when=dcLower[1] > low)
strategy.close("S", when=dcUpper[1] < high)

strategy.entry("L", strategy.long, 1, when = signalBuy and testPeriod() and uptrend)
strategy.entry("S", strategy.short, 1, when = signalSell and testPeriod() and uptrend ==false)

//strategy.exit("Exit Long", from_entry = "L", loss = 25000000, profit=25000000)
//strategy.exit("Exit Short", from_entry = "S", loss = 25000000, profit=25000000)