Chiến lược theo xu hướng dựa trên DMI và RSI
Tổng quan
Chiến lược này kết hợp các chỉ số DMI để xác định xu hướng xu hướng và chỉ số RSI để xác định mua bán quá mức, để thực hiện một chiến lược giao dịch theo xu hướng hoàn chỉnh hơn. Khi chỉ số DMI xác định xu hướng và chỉ số RSI cho thấy mua hoặc bán quá mức, hãy thực hiện quá nhiều hoặc quá nhiều. Đồng thời thiết lập dừng lỗ di động để khóa lợi nhuận.
Nguyên tắc chiến lược
- Sử dụng chỉ số DMI để đánh giá xu hướng
- DMI bao gồm ba đường cong: + DI biểu thị xu hướng tăng, - DI biểu thị xu hướng giảm, ADX đánh giá cường độ của xu hướng
- Khi + DI> -DI là xu hướng tăng, làm nhiều; khi -DI> + DI là xu hướng giảm, làm giảm
- Sử dụng chỉ số RSI để đánh giá quá mua quá bán
- RSI đánh giá quá mua hoặc quá bán bằng cách so sánh mức tăng và giảm trung bình trong thời gian.
- RSI dưới 30 là quá bán, trên 70 là quá mua
- Kết hợp DMI để xác định xu hướng và RSI để xác định mua quá mức và bán quá mức, bạn có thể nắm bắt được nhịp độ thị trường tốt hơn
- DMI đánh giá có xu hướng tăng và RSI đã bán quá mức, tốt hơn là làm thêm thời gian
- DMI đánh giá có xu hướng giảm và RSI mua quá mức, thời gian tháo lỗ tốt hơn
- Thiết lập dừng di chuyển để khóa lợi nhuận
Phân tích ưu thế
Đây là một chiến lược theo xu hướng ổn định, có lợi thế như sau:
- Kết hợp phán đoán xu hướng và phán đoán mua quá mức để tránh giao dịch thường xuyên trong thị trường bất ổn
- Sử dụng chỉ số phổ biến DMI và RSI, lựa chọn tham số dễ dàng, thực hành chứng minh đầy đủ
- Thiết lập dừng di chuyển để khóa lợi nhuận, có thể tránh dừng lỗ một phần
- Quy tắc rõ ràng, dễ hiểu, quy trình đơn giản, dễ thực hành
Phân tích rủi ro Chiến lược này cũng có một số rủi ro cần lưu ý:
- DMI và RSI đều dễ tạo ra các tín hiệu sai, có thể dẫn đến tổn thất không cần thiết
- Thiết lập dừng di động không đúng có thể dừng quá sớm hoặc dừng quá lớn
- Không có bộ lọc hiệu quả cho các cơn động đất, dễ bị mắc kẹt
- Theo dõi xu hướng, không thể dừng lỗ khi xu hướng đảo ngược
Định hướng tối ưu hóa
Chiến lược này cũng có thể được tối ưu hóa theo các khía cạnh sau:
- Hình thức lọc biến động của chỉ số biến động
- Kết hợp hình dạng candle để tránh đột phá giả
- Thiết lập giới hạn lỗ hổng dừng thích hợp gần các vị trí kháng cự hỗ trợ quan trọng
- Thêm mô hình học máy để đánh giá xu hướng ython
- Các tham số tối ưu hóa động của DMI và RSI
Kết luận
Chiến lược này nói chung là một chiến lược theo xu hướng thực tế ổn định hơn, thông qua DMI để xác định hướng xu hướng, RSI để xác định quá mua quá bán, do đó nắm bắt cơ hội giao dịch ở đường dài giữa. Đồng thời thiết lập dừng di chuyển để khóa lợi nhuận.
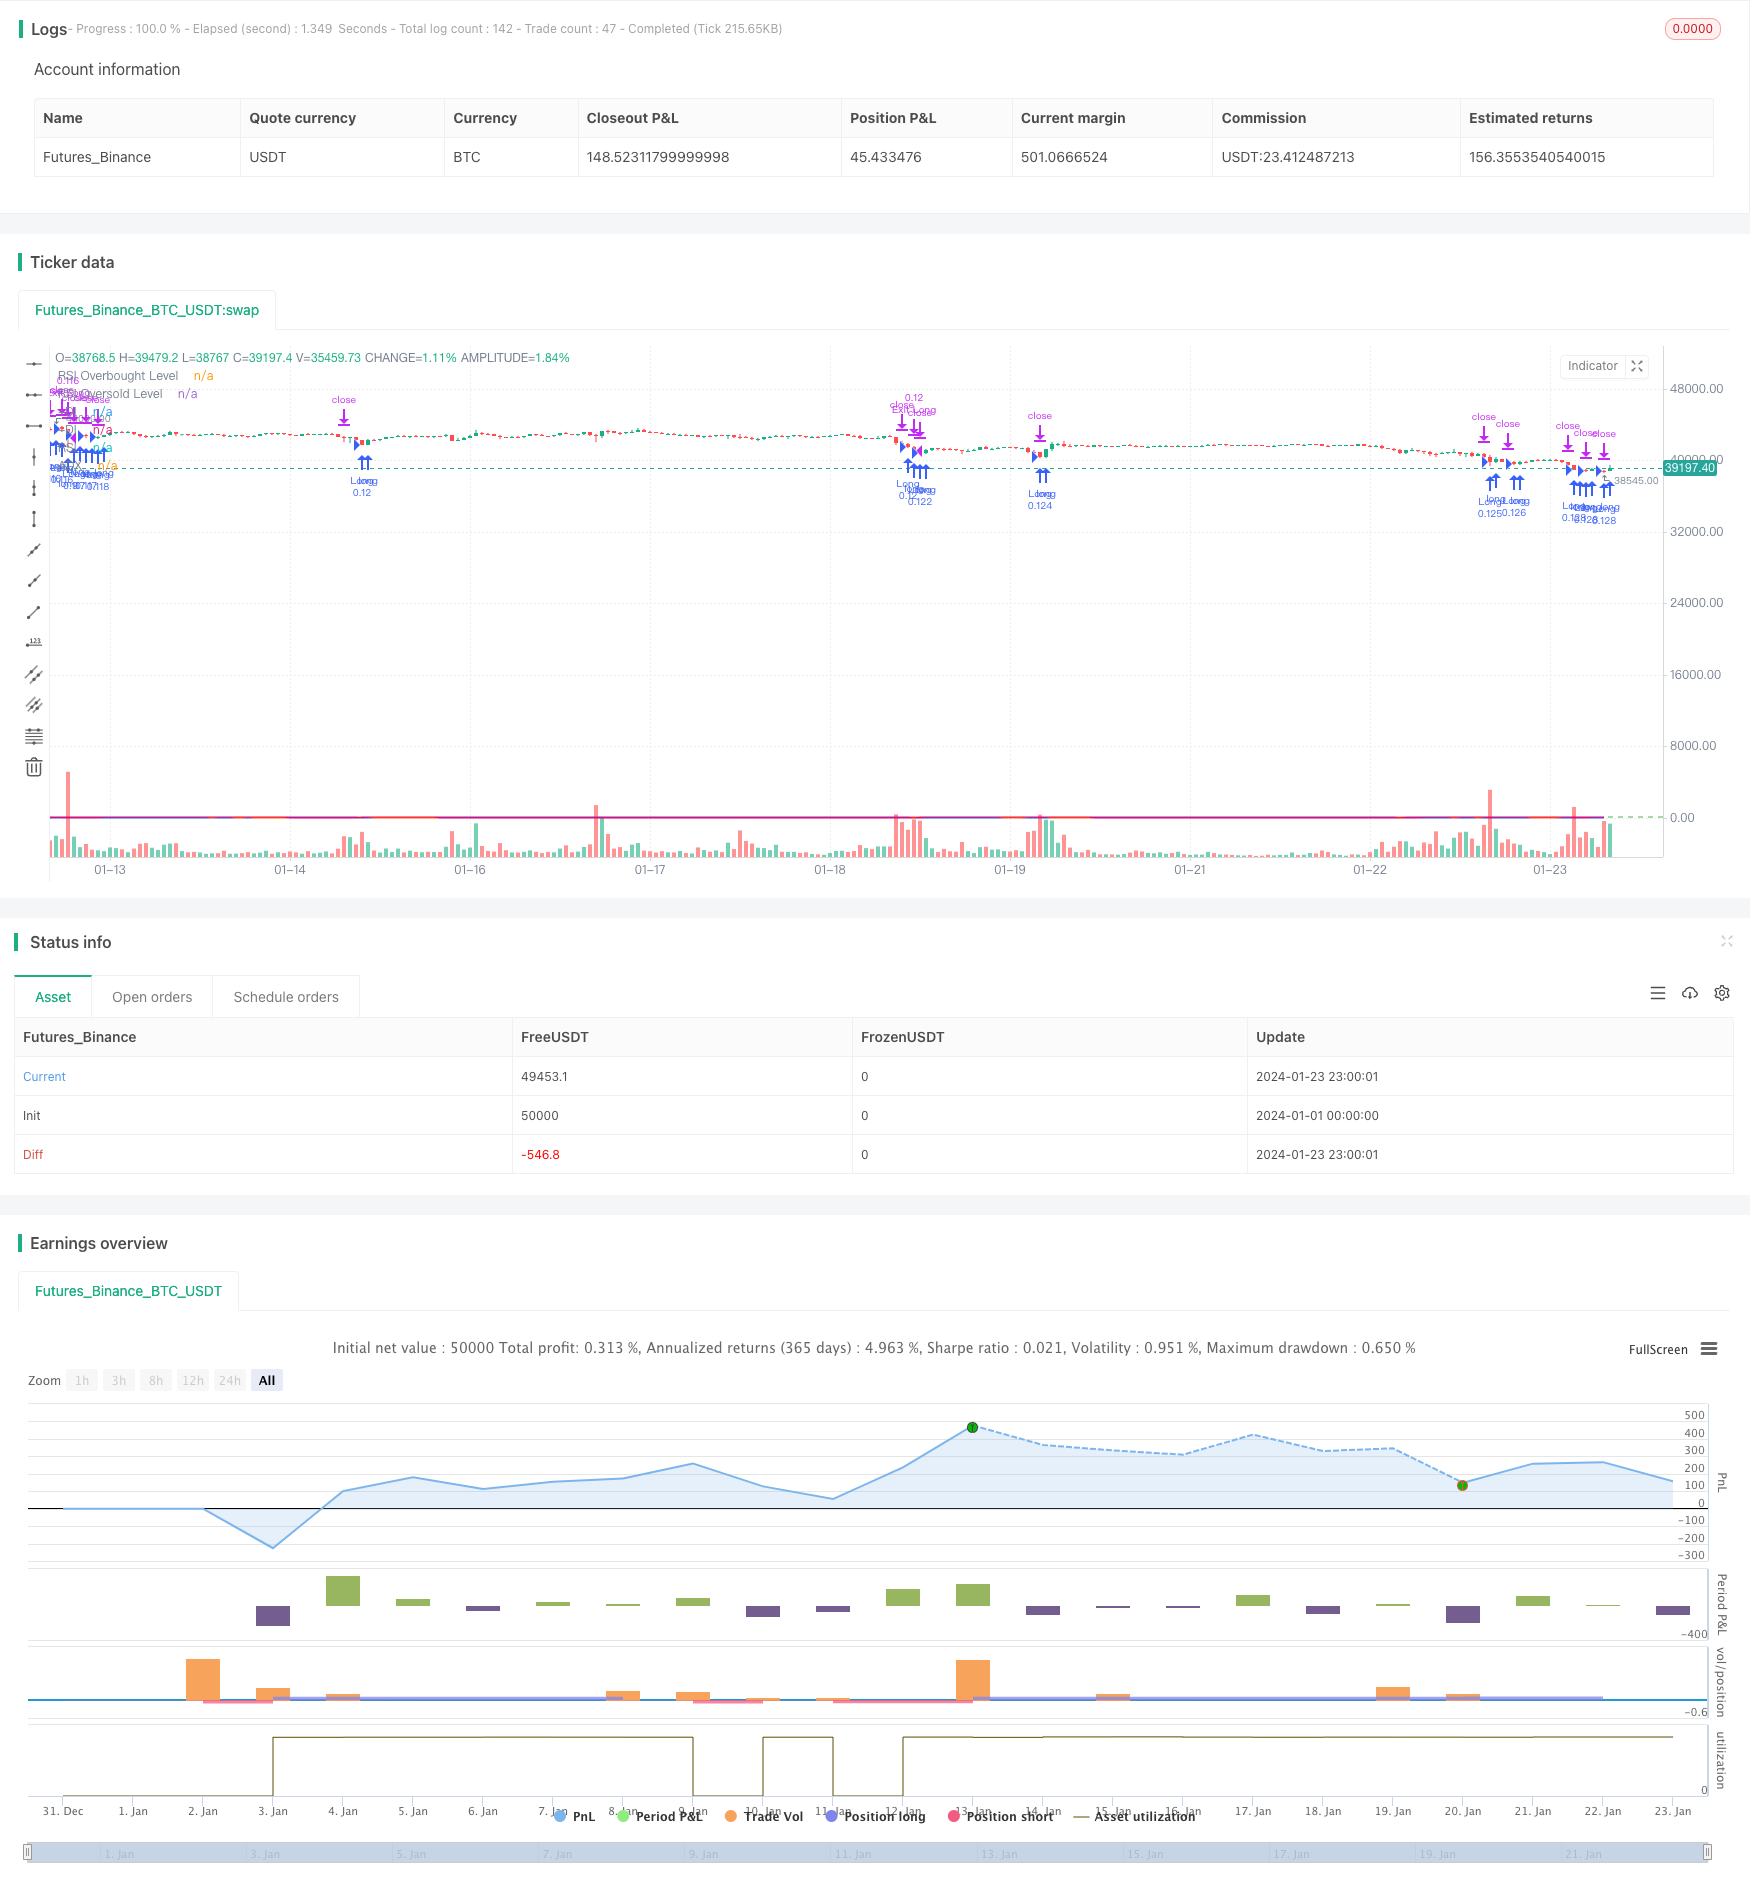
/*backtest
start: 2024-01-01 00:00:00
end: 2024-01-24 00:00:00
period: 1h
basePeriod: 15m
exchanges: [{"eid":"Futures_Binance","currency":"BTC_USDT"}]
*/

// This Pine Script™ code is subject to the terms of the Mozilla Public License 2.0 at https://mozilla.org/MPL/2.0/
// © YingYangJPN

//@version=5
strategy("DMI and RSI Strategy", overlay=true, initial_capital=10000, default_qty_type=strategy.percent_of_equity, default_qty_value=10)

// DMI indikatörünü tanımlayalım
lensig = input.int(14, title="ADX Smoothing", minval=1, maxval=50)
len = input.int(14, minval=1, title="DI Length")
up = ta.change(high)
down = -ta.change(low)
plusDM = na(up) ? na : (up > down and up > 0 ? up : 0)
minusDM = na(down) ? na : (down > up and down > 0 ? down : 0)
trur = ta.rma(ta.tr, len)
plus = fixnan(100 * ta.rma(plusDM, len) / trur)
minus = fixnan(100 * ta.rma(minusDM, len) / trur)
sum = plus + minus
adx = 100 * ta.rma(math.abs(plus - minus) / (sum == 0 ? 1 : sum), lensig)
trailing_stop_loss_factor = input.float(0.50, "Trailing Stop Loss Factor", step = 0.01)

// RSI indikatörünü tanımlayalım
rsiLength = input.int(14, minval=1, title="RSI Length")
rsiSource = input(close, title="RSI Source")
rsiOverbought = input.int(70, title="RSI Overbought Level")
rsiOversold = input.int(30, title="RSI Oversold Level")
rsiValue = ta.rsi(rsiSource, rsiLength)

// Uzun pozisyon açma koşullarını tanımlayalım
longCondition1 = rsiValue < rsiOversold // RSI oversold seviyesinin altındaysa
longCondition2 = adx > 20 // ADX 20'den büyükse
longCondition3 = minus > plus

// Kısa pozisyon açma koşullarını tanımlayalım
shortCondition1 = rsiValue > rsiOverbought // RSI overbought seviyesinin üstündeyse
shortCondition2 = adx > 20 // ADX 20'den büyükse
shortCondition3 = plus > minus

// Uzun pozisyon açalım
if longCondition1 and longCondition2 and longCondition3
    strategy.entry("Long", strategy.long)


// Kısa pozisyon açalım
if shortCondition1 and shortCondition2 and shortCondition3
    strategy.entry("Short", strategy.short)

// Trailing Stop Loss
longTrailingStopLoss = strategy.position_avg_price * (1 - trailing_stop_loss_factor / 100)
shortTrailingStopLoss = strategy.position_avg_price * (1 + trailing_stop_loss_factor / 100)
if strategy.position_size > 0
    strategy.exit("Exit Long", "Long", stop  = longTrailingStopLoss)
if strategy.position_size < 0
    strategy.exit("Exit Short", "Short", stop = shortTrailingStopLoss)

// DMI ve RSI indikatörlerini grafiğe çizelim
plot(adx, color=#F50057, title="ADX")
plot(plus, color=#2962FF, title="+DI")
plot(minus, color=#FF6D00, title="-DI")
plot(rsiValue, color=#9C27B0, title="RSI")
hline(rsiOverbought, title="RSI Overbought Level", color=#E91E63, linestyle=hline.style_dashed)
hline(rsiOversold, title="RSI Oversold Level", color=#4CAF50, linestyle=hline.style_dashed)