Chiến lược giao dịch Golden Cross
Tổng quan
Chiến lược giao dịch golden cross sử dụng giao dịch giữa hai chu kỳ khác nhau như một tín hiệu mua và bán. Cụ thể, khi đường trung bình di chuyển ngắn hạn vượt qua đường trung bình di chuyển dài hạn từ phía dưới, nó tạo ra tín hiệu giao dịch vàng, biểu thị thị trường chuyển sang giá vàng; khi đường trung bình di chuyển ngắn hạn từ phía trên đi xuống và phá vỡ đường trung bình di chuyển dài hạn, nó tạo ra tín hiệu giao dịch chết, biểu thị thị trường chuyển sang giá vàng.
Nguyên tắc chiến lược
Chiến lược này dựa trên hai nguyên tắc:
Đường trung bình di chuyển phản ánh xu hướng và sức mạnh của thị trường. Đường trung bình di chuyển ngắn hạn có thể nắm bắt các động thái và điểm biến đổi gần đây của thị trường; Đường trung bình di chuyển dài hạn thể hiện xu hướng chính của thị trường.
Khi đường trung bình di chuyển ngắn hạn và đường trung bình di chuyển dài hạn hình thành một đường giao vàng, nó cho thấy sức mạnh của thị trường ngắn hạn vượt quá sức mạnh của xu hướng dài hạn, vì vậy có thể bắt đầu một xu hướng tăng mới. Khi đường giao tử hình thành, nó cho thấy xu hướng giảm dài hạn chiếm ưu thế, vì vậy có thể tiếp tục giảm.
Cụ thể, chiến lược này đặt trung bình di chuyển đơn giản 13 chu kỳ và 30 chu kỳ và tạo ra tín hiệu giao dịch khi chúng giao nhau. Nguyên tắc giao nhau như sau:
Khi đường trung bình di chuyển ngắn thời gian đi qua đường trung bình di chuyển dài thời gian, tạo ra tín hiệu giao chéo vàng, cho thấy cơ hội làm nhiều hơn. Tại thời điểm này, hãy tham gia bằng cách đánh giá xu hướng vững chắc: Nếu giá duy trì tăng cao hơn một chu kỳ nhất định, hãy tự tin rằng hiện tại là xu hướng tăng lên, hãy làm nhiều hơn.
Khi đường trung bình di chuyển ngắn thời gian đi qua đường trung bình di chuyển dài thời gian, một tín hiệu chéo chết được tạo ra, cho thấy cơ hội tháo lỗ. Tại thời điểm này, hãy tham gia bằng cách đánh giá xu hướng bền vững: Nếu giá duy trì giảm hơn một chu kỳ nhất định, hãy tin tưởng rằng hiện tại là xu hướng giảm, hãy tháo lỗ.
Đánh giá cường độ tín hiệu chéo bằng độ dốc của đường trung bình di chuyển. Chỉ khi độ dốc của đường trung bình di chuyển ngắn hạn và dài hạn lớn hơn một ngưỡng nhất định, tín hiệu chéo được coi là đủ mạnh để tham gia. Điều này ức chế sự nhiễu của tín hiệu giả thông thường.
Stop Loss được thiết lập là 20% và Stop Loss là 100%.
Phân tích lợi thế
Chiến lược chéo hai đường đều có những lợi thế sau:
Nó rất đơn giản, dễ hiểu và dễ thực hiện, phù hợp với người mới bắt đầu.
Sử dụng tính năng giá trung bình, có một số tác dụng loại bỏ tiếng ồn, tránh bị lừa bởi biến động giá ngắn hạn.
Đánh giá xu hướng vững chắc, tránh làm quá nhiều cách tự động, nhưng kết hợp với phán đoán lớn.
Các yếu tố động lực độ dốc của đường trung bình di chuyển được đưa vào để làm cho tín hiệu đáng tin cậy hơn.
Tối ưu hóa phản hồi rất đơn giản, chỉ cần điều chỉnh một vài tham số quan trọng như tham số trung bình di chuyển và thời gian duy trì xu hướng.
Phân tích rủi ro
Chiến lược này cũng có những rủi ro sau:
Bản chất của đường giao thoa song song vẫn là một tín hiệu chậm trễ, không thể dự đoán hoàn hảo các điểm biến, có một mức độ chậm trễ. Chu kỳ trung bình di chuyển nên được rút ngắn thích hợp, hoặc được sử dụng kết hợp với các yếu tố có thể dự đoán các điểm biến.
Hệ thống giao dịch cơ học dễ bị tấn công cùng một lúc, do đó làm tăng tình trạng quá mức, làm cho dừng lỗ hoặc dừng lỗ không hiệu quả. Cần thiết lập các ngăn chặn dừng lỗ bậc thang hoặc can thiệp bằng tay thích hợp.
Không thể xử lý tốt tình trạng dao động, nên tránh các giống lặp lại theo chiều ngang trong chu kỳ như vậy, chọn các giống hướng rõ ràng để giao dịch.
Các cửa sổ thời gian để đánh giá sự kiên định của xu hướng được thiết lập khi có ảnh hưởng lớn đến kết quả hay không, cần được thử nghiệm nhiều lần để xác định giá trị tối ưu.
Hướng tối ưu hóa
Chiến lược giao chéo hai đường đều có thể được tối ưu hóa bằng cách:
Thêm các chỉ số đánh giá xu hướng cấp độ lớn, tránh các hoạt động ngược. Ví dụ: thêm vị trí của đường tròn so sánh hoặc đường trăng.
Thêm xác minh khối lượng giao dịch, chỉ phát tín hiệu khi khối lượng giao dịch lớn hơn, tránh tín hiệu giả.
Tối ưu hóa tham số trung bình di chuyển, tìm kiếm kết hợp chu kỳ tốt nhất. Bạn có thể thử tự điều chỉnh tham số trung bình di chuyển.
Kết hợp với các chỉ số công thức chính thống, như MACD, KD và các phán đoán phụ trợ, tăng độ chính xác của tín hiệu.
Thiết lập một hệ thống ngăn chặn thiệt hại theo thang để kiểm soát rủi ro tốt hơn
Tóm tắt
Chiến lược giao chéo hai đường đồng đều nói chung là một chiến lược có thể giải thích được rất trực quan. Nó kết hợp các tính năng loại bỏ tiếng ồn của đường trung bình di chuyển, với khả năng nhận ra xu hướng đơn giản để xác định giao chéo. Đồng thời, các tín hiệu được xác minh một cách nhất định, tránh đi theo gió mù quáng, điều này cũng làm tăng tính thực tế và ổn định của nó. Ngoài một số cách cải tiến được đề cập trong bài viết này, chiến lược này vẫn có rất nhiều không gian tối ưu hóa, đáng để nghiên cứu sâu hơn.
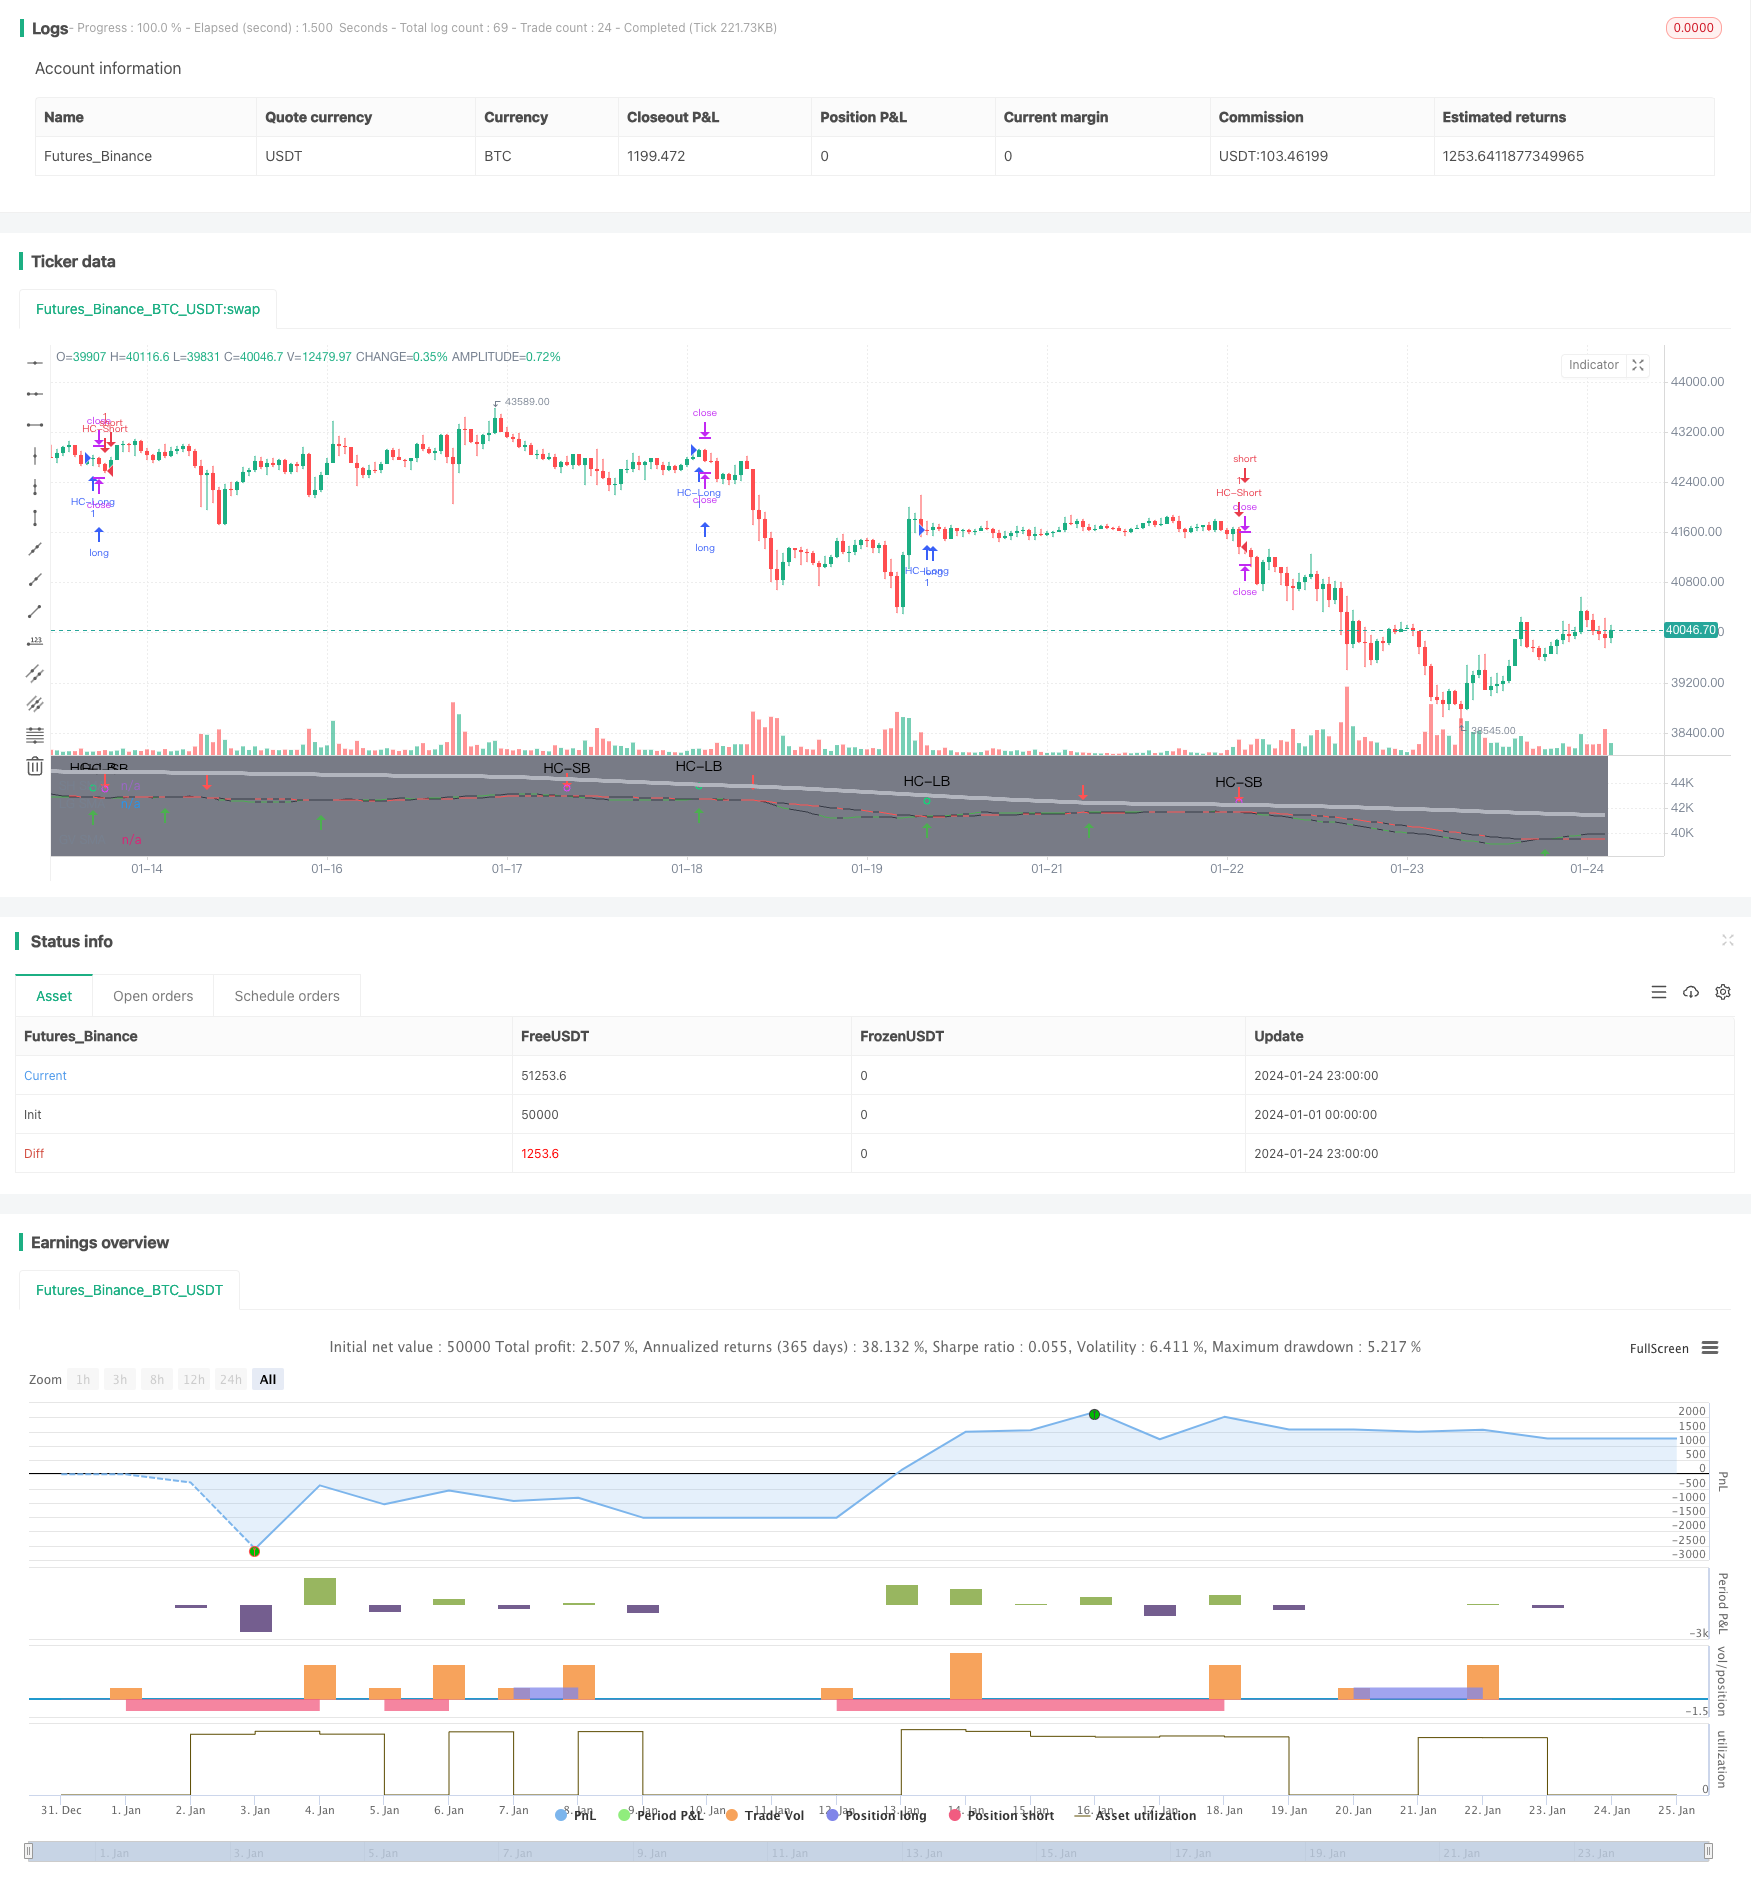
/*backtest
start: 2024-01-01 00:00:00
end: 2024-01-25 00:00:00
period: 1h
basePeriod: 15m
exchanges: [{"eid":"Futures_Binance","currency":"BTC_USDT"}]
*/

//@version=4

// This source code is subject to the terms of the Mozilla Public License 2.0 at https://mozilla.org/MPL/2.0/
// © MakeMoneyCoESTB2020


//*********************Notes for continued work***************

//************************************************************

//Hello my fellow investors
//I am creating a simple non-cluttered strategy that uses 3(+1) simple means to determine: viability, entry, and exit
//1) Has a consistent trend been maintained for several days/weeks
//2) SH SMA crossover LG SMA = Bullish entry/LG SMA crossover SH SMA = Bearish entry
//3) Use the Slope factor & Weeks in Trend (WiT) to dertermine how strong of an entry signal you are comfortable with
//4) Exit position based on next SMA cross and trend reversal or stop loss%
//3+1) For added confidence in trend detection: Apply MACD check - buy--> MACD line above signal line and corssover below histogram \\ sell --> MACD line below signal line and crossover above histogram.
//*)This code also allows you to determine your desired backtesting date compliments of alanaster


//This code is the product of many hours of hard work on the part of the greater tradingview community.  The credit goes to everyone in the community who has put code out there for the greater good.

//Happy Hunting!

// 1. Define strategy settings*************************************************************************************************************************************************************************

//Title
strategy("KISS Strategy: SMA + EMA", shorttitle="KISS Strat")

//define calculations price source
price = input(title="Price Source", defval=close)

// 2. Calculate strategy values*************************************************************************************************************************************************************************

//Calculate 13/30/200SMA
SH_SMA_length= input(title="SH SMA Length", defval=13) //short SMA length
LG_SMA_length= input(title="LG SMA Length", defval=30) //long SMA length
GV_SMA_length= input(title="SH SMA Length", defval=200) //Gravitational SMA length

SH_SMA=sma(price, SH_SMA_length) //short SMA
LG_SMA=sma(price, LG_SMA_length) //long SMA
GV_SMA=sma(price, GV_SMA_length) //gravitational SMA

//calculate MACD
//define variables for speed
fast = 12, slow = 26
//define parameters to calculate MACD
fastMA = ema(price, fast)
slowMA = ema(price, slow)
//define MACD line
macd = fastMA - slowMA
//define SIGNAL line
signal = sma(macd, 9)

//Determine what type of trend we are in
dcp = security(syminfo.tickerid, 'D', close)   //daily close price
wcp = security(syminfo.tickerid, 'W', close)   //weekly close price

WiT = input(title="Weeks In Trend", defval=1, maxval=5, minval=1)    //User input for how many weeks of price action to evaluate (Weeks in Trend = WiT)
BearTrend = false       //initialize trend variables as false
BullTrend = false       //initialize trend variables as false

// BullTrend := (wcp > SH_SMA) and (SH_SMA > LG_SMA)  //true if price is trending up based on weekly price close
// BearTrend := (wcp < SH_SMA) and (SH_SMA < LG_SMA)  //true if price is trending down based on weekly price close


// BullTrend := (price > SH_SMA) and (SH_SMA > LG_SMA)  //true if price is trending up
// BearTrend := (price < SH_SMA) and (SH_SMA < LG_SMA)  //true if price is trending down

//Determine if the market has been in a trend for 'n' weeks

n=WiT                           //create loop internal counting variable
for i=1 to WiT                  //create loop to determine if BearTrend=true to set number of weeks
    if (wcp[n] < price)         //evaluate if BearTrend=false comparing the current price to a paticular week close
        BearTrend := false      //set value to false if older price value is less than newer: trending up
        break                   //break out of for loop when trend first falters
    if (wcp[n] > price)         //evaluate if BearTrend=true comparing the current price to a paticular week close
        BearTrend := true       //set value to true if older price value is greater than newer: trending down
    n:=n-1                      //set internal counter one day closer to present

m=WiT                           //create loop internal counting variable
for j=1 to WiT                  //create loop to determine if BearTrend=true to set number of weeks
    if (wcp[m] > price)         //evaluate if BullTrend=false comparing the current price to a paticular week close
        BullTrend := false      //set value to false if older price value is greater than newer: trending down
        break                   //break out of for loop when trend first falters
    if (wcp[m] < price)         //evaluate if BullTrend=true comparing the current price to a paticular week close
        BullTrend := true       //set value to true if older price value is less than newer: trending up
    m:=m-1                      //set internal counter one day closer to present


//Determine if crossings occur
SH_LGcrossover = crossover(SH_SMA, LG_SMA)  //returns true if short crosses over long
SH_LGcrossunder = crossunder(SH_SMA, LG_SMA)    //returns true if short crosses under long

//Determine the slope of the SMAs when a cross over occurs
SlopeFactor= input(title="Slope Factor", defval=.01, minval=0, step = 0.001) //user input variable for what slope to evaluate against
XSlopeSH = abs(SH_SMA-SH_SMA[2]) //slope of short moving average (time cancels out)
XSlopeLG = abs(LG_SMA-LG_SMA[2]) //slope of long moving average (time cancels out)
StrongSlope = iff (abs(XSlopeSH-XSlopeLG)>SlopeFactor, true, false) //create a boolean variable to determine is slope intensity requirement is met

// ************************************ INPUT BACKTEST RANGE ******************************************=== coutesy of alanaster
fromMonth = input(defval = 4,    title = "From Month",      type = input.integer, minval = 1, maxval = 12)
fromDay   = input(defval = 1,    title = "From Day",        type = input.integer, minval = 1, maxval = 31)
fromYear  = input(defval = 2020, title = "From Year",       type = input.integer, minval = 1970)
thruMonth = input(defval = 1,    title = "Thru Month",      type = input.integer, minval = 1, maxval = 12)
thruDay   = input(defval = 1,    title = "Thru Day",        type = input.integer, minval = 1, maxval = 31)
thruYear  = input(defval = 2112, title = "Thru Year",       type = input.integer, minval = 1970)

// === INPUT SHOW PLOT ===
showDate  = input(defval = true, title = "Show Date Range", type = input.bool)

// === FUNCTION EXAMPLE ===
start     = timestamp(fromYear, fromMonth, fromDay, 00, 00)        // backtest start window
finish    = timestamp(thruYear, thruMonth, thruDay, 23, 59)        // backtest finish window
window()  => true

bgcolor(color = showDate and window() ? color.gray : na, transp = 90)
// === EXECUTION ===
//strategy.entry("L", strategy.long, when = window() and crossOv)    // enter long when "within window of time" AND crossover
//strategy.close("L", when = window() and crossUn)                   // exit long when "within window of time" AND crossunder

// 3. Output strategy data*************************************************************************************************************************************************************************

//Embolden line if a trend exists
trendcolorLG = BearTrend?color.red:color.black //highlights beartrend condition met graphically
trendcolorSH = BullTrend?color.green:color.black //highlights beartrend condition met graphically

//plot SMAs
plot(SH_SMA, title = "SH SMA", color = trendcolorSH)
plot(LG_SMA, title = "LG SMA", color = trendcolorLG)
plot(GV_SMA, title = "GV SMA", color = color.silver, linewidth = 4, transp = 70)

//Highlight crossovers
plotshape(series=SH_LGcrossover, style=shape.arrowup, location=location.belowbar,size=size.normal, color=color.green)
plotshape(series=SH_LGcrossunder, style=shape.arrowdown, location=location.abovebar,size=size.normal, color=color.red)

// 4. Determine Long & Short Entry Calculations*************************************************************************************************************************************************************************

//Define countback variable
countback=input(minval=0, maxval=5, title="Price CountBack", defval=0)
//User input for what evaluations to run: SMA or SMA + EMA
SMA_Y_N=input(defval = "Y", title="Run SMA", type=input.string, options=["Y", "N"])
MACD_Y_N=input(defval = "N", title="Run MACD", type=input.string, options=["Y", "N"])

//Calculate SMA Cross entry conditions
SMAbuy=false
SMAsell=false
SMAbuy := SH_LGcrossover and StrongSlope and BearTrend[WiT*7]   //enter long if short SMA crosses over long SMA & security has been in a BearTrend for 'n' days back
SMAsell := SH_LGcrossunder and StrongSlope and BullTrend[WiT*7] //enter short if short SMA crosses under long SMA & security has been in a BullTrend for 'n' days back

//Calculate MACD Cross entry conditions
MACDbuy = iff(MACD_Y_N=="Y", crossunder(signal[countback], macd[countback]), true) and iff(MACD_Y_N=="Y", macd[countback]<0, true) and StrongSlope and BearTrend     //enter long if fast MACD crosses over slow MACD & there is a strong slope & security has been in a BearTrend for 'n' days back
MACDsell = iff(MACD_Y_N=="Y", crossunder(macd[countback], signal[countback]), true) and iff(MACD_Y_N=="Y", signal[countback]>0, true) and StrongSlope and BullTrend  //enter short if fast MACD crosses under slow MACD & there is a strong slope & security has been in a BullTrend for 'n' days back

//long entry condition
dataHCLB=(iff(SMA_Y_N=="Y", SMAbuy, true) and iff(MACD_Y_N=="Y", MACDbuy, true))
plotshape(dataHCLB, title= "HC-LB", color=color.lime, style=shape.circle, text="HC-LB")
strategy.entry("HC-Long", strategy.long, comment="HC-Long", when = dataHCLB and window())

//short entry condition
dataHCSB=(iff(SMA_Y_N=="Y", SMAsell, true) and iff(MACD_Y_N=="Y", MACDsell, true))
plotshape(dataHCSB, title= "HC-SB", color=color.fuchsia, style=shape.circle, text="HC-SB")
strategy.entry("HC-Short", strategy.short, comment="HC-Short", when=dataHCSB and window())


// 5. Submit Profit and Loss Exit Calculations Orders*************************************************************************************************************************************************************************

// User Options to Change Inputs (%)
stopPer = input(12, title='Stop Loss %', type=input.float) / 100
takePer = input(25, title='Take Profit %', type=input.float) / 100

// Determine where you've entered and in what direction
longStop = strategy.position_avg_price * (1 - stopPer)
shortStop = strategy.position_avg_price * (1 + stopPer)
shortTake = strategy.position_avg_price * (1 - takePer)
longTake = strategy.position_avg_price * (1 + takePer)

//exit position conditions and orders
if strategy.position_size > 0//or crossunder(price[countback], upperBB)
    strategy.exit(id="Close Long", when = window(), stop=longStop, limit=longTake)
if strategy.position_size < 0 //or crossover(price[countback], lowerBB)
    strategy.exit(id="Close Short", when = window(), stop=shortStop, limit=shortTake)


//Evaluate/debug equation***************************************************************************************************************************************************************************
// plotshape((n==5? true : na), title='n=5', style=shape.labeldown, location=location.abovebar, text='5', color=color.white, textcolor=color.black, transp=0) //print n value if 5
// plotshape((n==4? true : na), title='n=4', style=shape.labeldown, location=location.abovebar, text='4', color=color.white, textcolor=color.black, transp=0) //print n value if 4
// plotshape((n==3? true : na), title='n=3', style=shape.labeldown, location=location.abovebar, text='3', color=color.white, textcolor=color.black, transp=0) //print n value if 3
// plotshape((n==2? true : na), title='n=2', style=shape.labeldown, location=location.abovebar, text='2', color=color.white, textcolor=color.black, transp=0) //print n value if 2
// plotshape((n==1? true : na), title='n=1', style=shape.labeldown, location=location.abovebar, text='1', color=color.white, textcolor=color.black, transp=0) //print n value if 1
// lineValue = 11                                           //set random visible line value to check when equation is true
// colorP = (BearTrend==true) ? color.green : color.red
// plot (lineValue, title = "BearTrend", color = colorP)   //Plot when condition true=green, false=red
// plot (XSlopeLG+15, color=color.white) //used for code debugging
// plot (XSlopeSH+15, color=color.blue) //used for code debugging
// plot (abs(XSlopeSH-XSlopeLG)+20, color=color.fuchsia) //used for code debugging