Chiến lược trung bình động được làm mịn tối ưu hóa danh mục đầu tư
Tổng quan
Chiến lược này dựa trên sự kết hợp giữa các đường di chuyển trơn và các chỉ số Stochastic, với mục đích nắm bắt nhiều cơ hội hơn trong xu hướng. Nó chủ yếu sử dụng các đường di chuyển trung bình chỉ số của hai chu kỳ khác nhau để tạo ra tín hiệu chiến lược, kết hợp với đường K và đường D trong chỉ số Stochastic như một lựa chọn thời gian đầu vào để hy vọng có được tỷ lệ lợi nhuận cao hơn trong xu hướng.
Nguyên tắc chiến lược
Chiến lược này sử dụng hai đường trung bình di chuyển trơn 12 chu kỳ và 26 chu kỳ. Khi đường nhanh đi qua đường chậm từ phía dưới, làm nhiều; Khi đường nhanh đi qua đường chậm từ phía trên xuống, làm trống. Để lọc tín hiệu giả, nó yêu cầu đường nhanh và đường chậm đồng hướng, đường nhanh chỉ có thể làm nhiều trên đường chậm và đường nhanh chỉ có thể làm trống dưới đường chậm.
Đường K trong chỉ số Stochastic giao nhau với đường D để chọn thời điểm vào cửa. Khi đường K giao nhau với đường D từ phía dưới đường mua quá mức, hãy làm nhiều; Khi đường K giao nhau với đường D từ phía dưới đường bán quá mức, hãy làm trống.
Trung bình di chuyển trơn định hướng xu hướng, Stochastic chỉ số lọc tiếng ồn và chọn thời gian nhập cuộc. Sự kết hợp của chúng có thể mang lại nhiều cơ hội lợi nhuận hơn trong xu hướng.
Lợi thế chiến lược
- Chiến lược trung bình di chuyển trơn tự nó có tính năng chuyển động và dễ theo dõi xu hướng
- Sử dụng Stochastic để lọc tiếng ồn và tăng khả năng lợi nhuận
- Kết hợp đường trung bình chậm và nhanh, khi đường nhanh quay trở lại gần đường chậm, có thể có cơ hội chơi tốt hơn
- Sử dụng kết hợp chéo giữa K và D trong chỉ số Stochastic để tiếp tục chọn điểm vào tốt hơn
Do đó, chiến lược này có thể được sử dụng một cách ngẫu nhiên và có chọn lọc để nắm bắt cơ hội, từ đó đạt được tỷ lệ lợi nhuận cao hơn.
Phân tích rủi ro
- Rủi ro rời khỏi sân trong thời gian ngắn. Khi đường nhanh quay trở lại đường chậm, có thể bị từ chối hoặc bị mắc kẹt
- Do tính chất của nó, nó không thể thích ứng nhanh chóng khi thị trường biến động mạnh, có thể dẫn đến tổn thất lớn
Để giảm thiểu những rủi ro này, chúng ta có thể đặt lệnh dừng lỗ hoặc sử dụng các tham số trung bình di chuyển thoải mái hơn.
Hướng tối ưu hóa
Chiến lược này có thể được tối ưu hóa hơn nữa ở những khía cạnh sau:
- Kiểm tra các kết hợp của các tham số trung bình di chuyển khác nhau để tìm ra tham số tốt hơn
- Kiểm tra sự kết hợp của các tham số Stochastic khác nhau
- Tăng chiến lược dừng lỗ
- Tăng dừng động dựa trên biến động
- Kiểm tra sự kết hợp tối ưu hóa các tham số chu kỳ khác nhau của các giống khác nhau
- Các tham số tối ưu hóa để kiểm tra thuật toán học máy
Bằng cách thử nghiệm các tổ hợp tham số khác nhau, bạn có thể tìm thấy các tham số mạnh hơn; đồng thời thiết lập chiến lược dừng lỗ có thể làm giảm rủi ro và tăng sự ổn định của chiến lược.
Tóm tắt
Chiến lược này kết hợp các lợi thế của moving average và Stochastic, có thể theo dõi xu hướng và chọn thời điểm tốt hơn để tham gia. Nó dễ vận hành, có thể kiểm soát rủi ro và có giá trị thực tế lớn. Hiệu suất của nó có thể được nâng cao hơn nữa thông qua việc kiểm tra và tối ưu hóa liên tục. Nó cung cấp một mô hình chiến lược theo dõi xu hướng ổn định hiệu quả cho các nhà giao dịch định lượng.
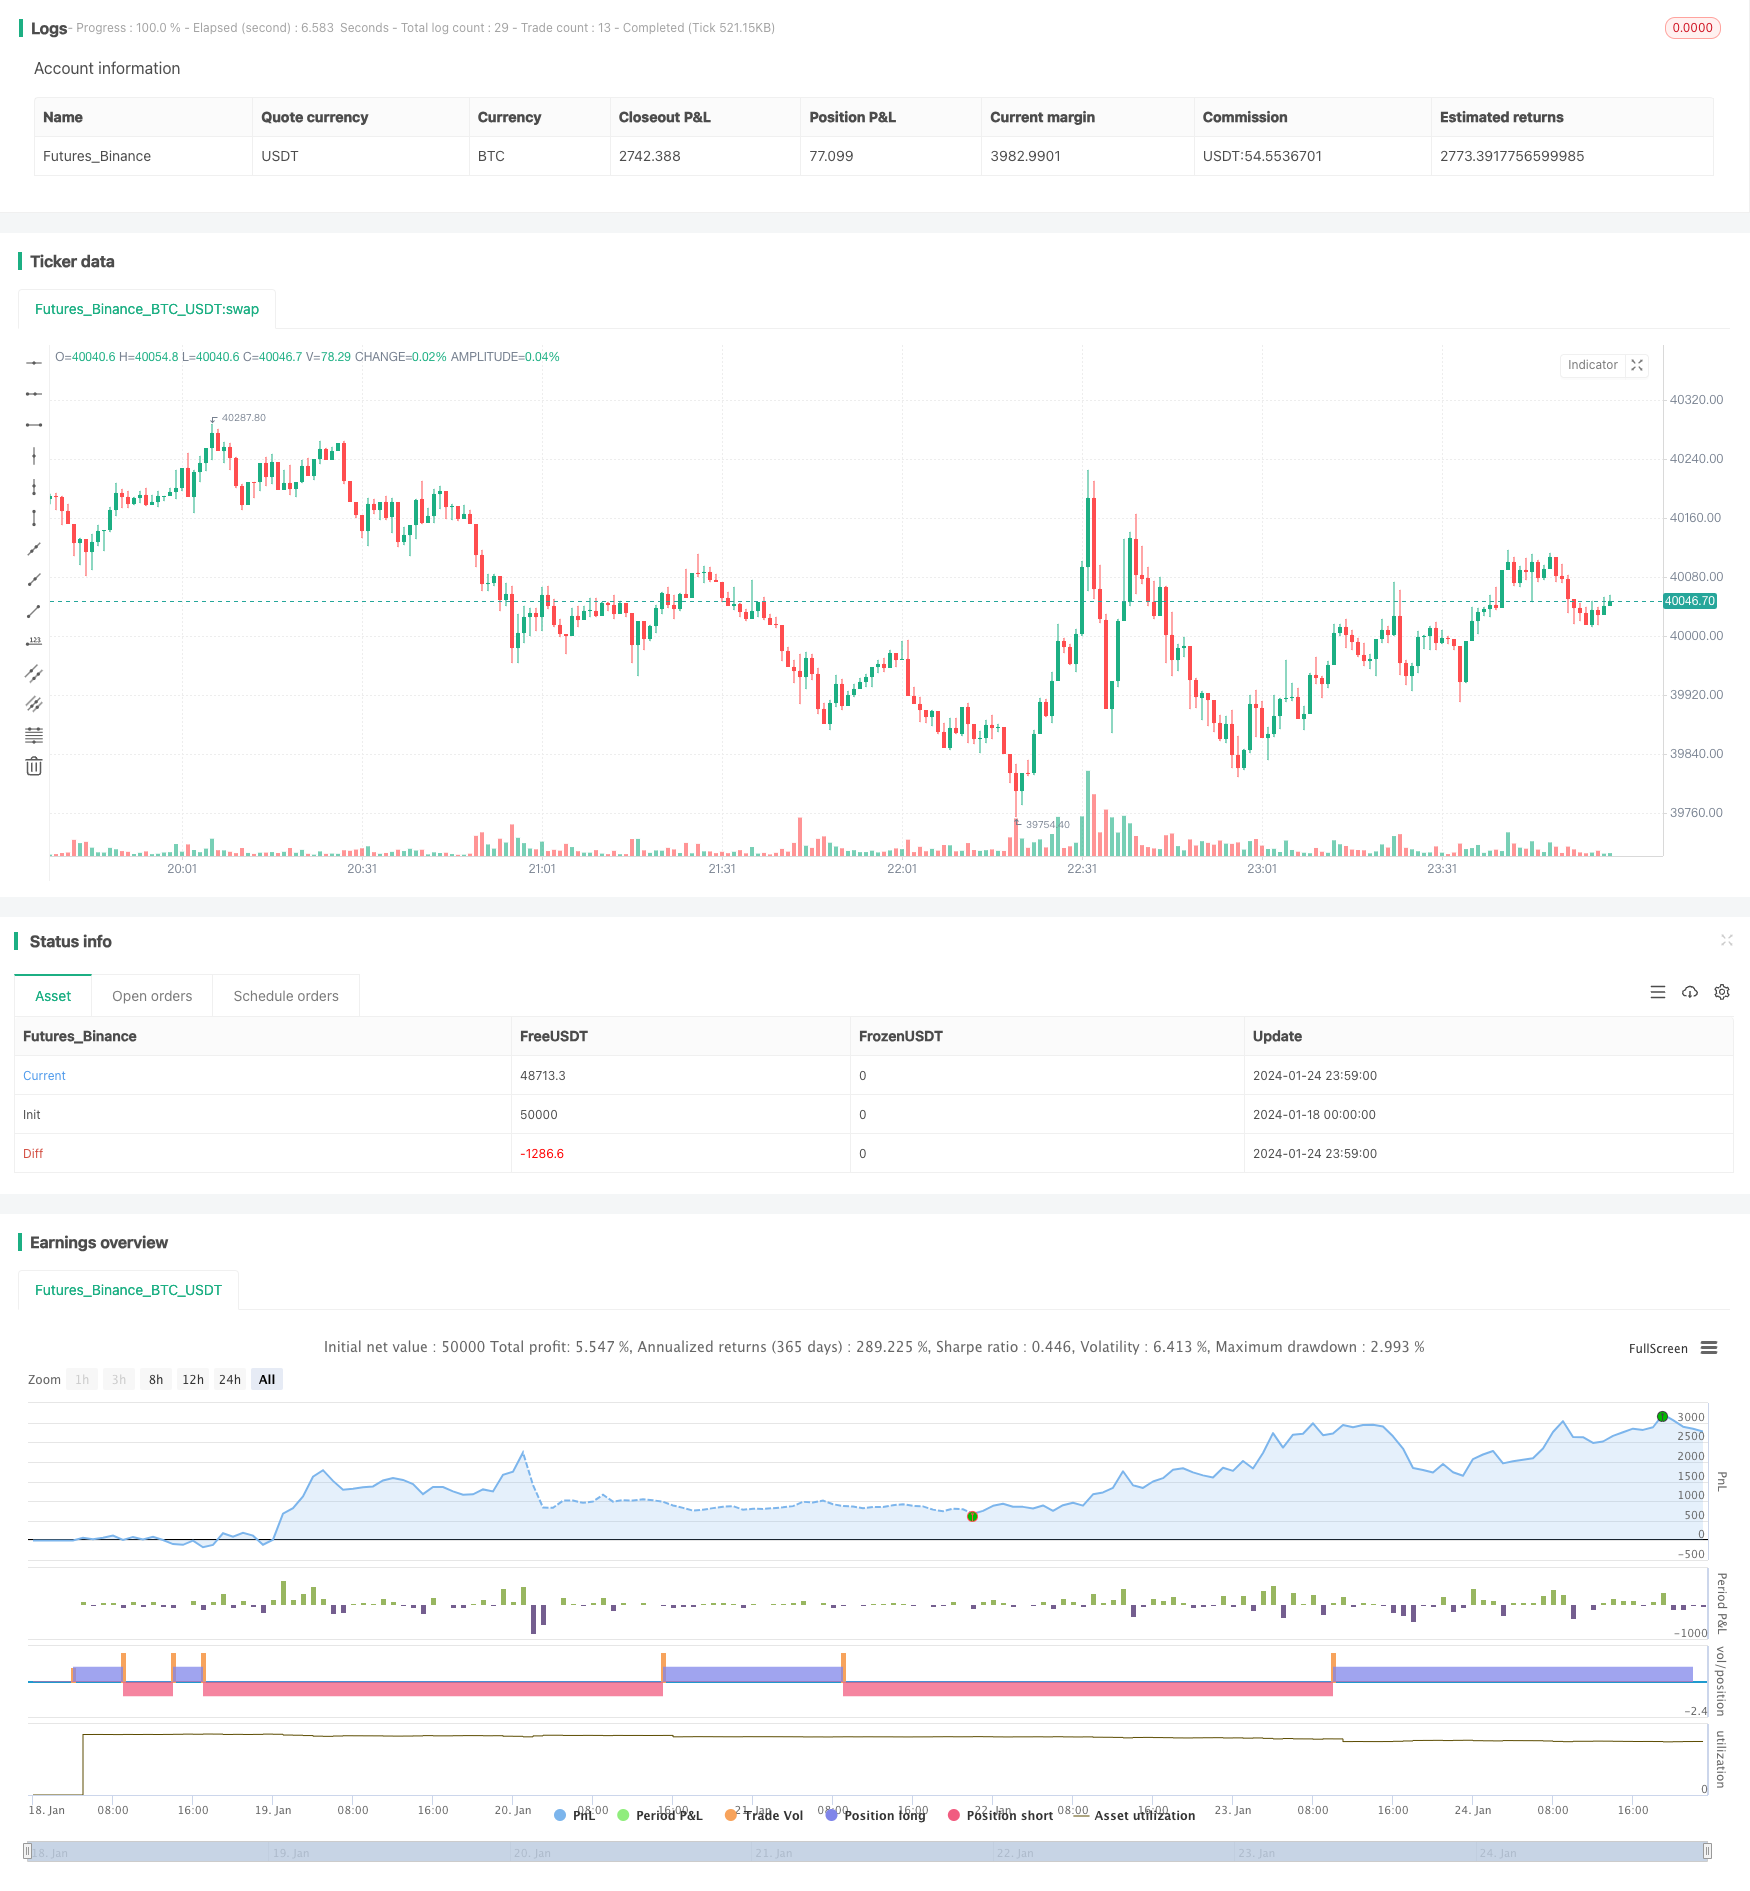
/*backtest
start: 2024-01-18 00:00:00
end: 2024-01-25 00:00:00
period: 1m
basePeriod: 1m
exchanges: [{"eid":"Futures_Binance","currency":"BTC_USDT"}]
*/

//@version=4
// author SoftKill

strategy(title="Price EMA with stock", shorttitle="EMA STOCH", overlay=true)
src = input(title="Source", type=input.source, defval=close)

src_0 = src[0]
src_1 = src[1]
src_2 = src[2]
src_3 = src[3]
src_4 = src[4]

len50 = input(50, minval=1, title="Length")
src50 = input(close, title="Source")
out50 = ema(src50, len50)
len100 = input(100)
src100 = input(close, title="Source")
out100 = ema(src100, len100)

len1 = input(1, minval=1, title="Length")
src1 = input(close, title="Source")
out1 = sma(src1, len1)

length = input(5, minval=1)
OverBought = input(80)
OverSold = input(20)
smoothK = 3
smoothD = 3

k = sma(stoch(close, high, low, length), smoothK)
d = sma(k, smoothD)
cu = crossover(k,OverSold)
co = crossunder(k,OverBought)

sma_down = crossunder(out1, out50)
sma_up = crossover(out1,out50)

//if (not na(k) and not na(d))
  //  if (co and k < OverSold)
    //    strategy.entry("StochLE", strategy.long, comment="StochLE")
    //if (cu and k > OverBought)
     //   strategy.entry("StochSE", strategy.short, comment="StochSE")

crossCandle_4 = crossover(src[4],out50)
crossCandleUnder_4= cross(src[4],out50)
crossCandle_3 = crossover(src[3],out50)
crossCandleUnder_3= crossunder(src[3],out50)
crossCandle_2 = crossover(src[2],out50)
crossCandleUnder_2= crossunder(src[2],out50)
crossCandle_1 = crossover(src[1],out50)
crossCandleUnder_1= crossunder(src[1],out50)
crossCandle_0 = crossover(src[0],out50)
crossCandleUnder_0= crossunder(src[0],out50)

conditionOver = (crossCandle_4 or crossCandle_3 or crossCandle_2 or crossCandle_1 or crossCandle_0)
conditionUnder =(crossCandleUnder_4 or crossCandleUnder_3 or crossCandleUnder_2 or crossCandleUnder_1 or crossCandleUnder_0)

touch4 = (cross(low[4],out50) or cross(high[4],out50))
touch3 = (cross(low[3],out50) or cross(high[3],out50))
touch2 = (cross(low[2],out50) or cross(high[2],out50))
touch1 = (cross(low[1],out50) or cross(high[1],out50))

touch = touch1 or touch2 or touch3 or touch4

//and sma_up
//and sma_down

// Getting inputs
fast_length = input(title="Fast Length", type=input.integer, defval=12)
slow_length = input(title="Slow Length", type=input.integer, defval=26)
src_macd = input(title="Source", type=input.source, defval=close)
signal_length = input(title="Signal Smoothing", type=input.integer, minval = 1, maxval = 50, defval = 9)
sma_source = input(title="Simple MA(Oscillator)", type=input.bool, defval=false)
sma_signal = input(title="Simple MA(Signal Line)", type=input.bool, defval=false)

// Plot colors
col_grow_above = #26A69A
col_grow_below = #FFCDD2
col_fall_above = #B2DFDB
col_fall_below = #EF5350
col_macd = #0094ff
col_signal = #ff6a00

// Calculating
fast_ma = sma_source ? sma(src_macd, fast_length) : ema(src_macd, fast_length)
slow_ma = sma_source ? sma(src_macd, slow_length) : ema(src_macd, slow_length)
macd = fast_ma - slow_ma
signal = sma_signal ? sma(macd, signal_length) : ema(macd, signal_length)
hist = macd - signal

//plot(hist, title="Histogram", style=plot.style_columns, color=(hist>=0 ? (hist[1] < hist ? col_grow_above : col_fall_above) : (hist[1] < hist ? col_grow_below : col_fall_below) ), transp=0 )
//plot(macd, title="MACD", color=col_macd, transp=0)
//plot(signal, title="Signal", color=col_signal, transp=0)


// plot((conditionOver or conditionUnder or touch)  and src[0] >= out50 and close >= out50 and  (cu) and out50 > out100 and hist>=0 , title="Buy", style=plot.style_columns, color=color.lime)
// plot((conditionOver or conditionUnder or touch)  and src[0] <= out50 and close <= out50 and  (co) and out50< out100 and hist<=0 , title="sell", style=plot.style_columns, color=color.red)


long_cond = ((conditionOver or conditionUnder or touch)  and src[0] >= out50 and close > out50 and  (cu) and out50 > out100 and hist>=0)
short_cond = ((conditionOver or conditionUnder or touch)  and src[0] <= out50 and close < out50 and  (co) and out50< out100 and hist<=0)

tp=input(0.1)
sl=input(0.1)

strategy.entry("long",strategy.long, when=long_cond)
strategy.entry("short",strategy.short, when=short_cond)

strategy.exit("X_long", "long", profit=close * tp / syminfo.mintick,  loss=close * sl / syminfo.mintick, when=touch  )
strategy.exit("x_short", "short",profit=close * tp / syminfo.mintick,loss=close * sl / syminfo.mintick,when = touch )

// //tp = input(0.0003, title="tp")
// tp = 0.0003
// //sl = input(1.0 , title="sl")
// sl = 1.0
// strategy.exit("closelong", "long" , profit = close * tp / syminfo.mintick, loss = close * sl / syminfo.mintick, alert_message = "closelong")
// strategy.exit("closeshort", "short" , profit = close * tp / syminfo.mintick, loss = close * sl / syminfo.mintick, alert_message = "closeshort")