Chiến lược mua và bán tự động Wave B của Market Code
Tổng quan
Chiến lược này sử dụng lý thuyết sóng của chỉ số mật mã thị trường, kết hợp với nhiều chỉ số kỹ thuật để thực hiện mua và bán tự động. Nó có thể xác định cơ hội và theo dõi xu hướng khi xu hướng bắt đầu.
Nguyên tắc chiến lược
Chiến lược này chủ yếu dựa trên chỉ số sóng B mã hóa thị trường. Chỉ số này phân chia hành động giá thành hai cấp: sóng 1 và sóng 2. Phản ứng sóng 1 nhạy cảm, phản ứng sóng 2 mềm.
Mã tính toán 1 và 2 sóng thông qua hàm Wavetrend. Sau đó kết hợp với mua quá mức để phân biệt hướng sóng. Ví dụ: khi Wave1 đi qua Wave2 trong khi Wave2 nằm trong khu vực mua quá mức, đó là tín hiệu bán.
Ngoài ra, mã cũng giới thiệu một số chỉ số hỗ trợ để cải thiện độ chính xác của quyết định, bao gồm:
Khu vực giá trị cực đoan: kết hợp RSI và chỉ số dòng tiền để xác định khu vực biến động giá.
KD: Đánh giá về sự tăng trưởng
Tránh xa: Tìm ra điểm thay đổi
Hình cờ: Xác định xu hướng bền vững
Cuối cùng, quyết định giao dịch cuối cùng được đánh giá dựa trên Wave và các chỉ số hỗ trợ.
Lợi thế chiến lược
Lợi thế lớn nhất của chiến lược này là khả năng đối phó với các môi trường thị trường khác nhau. Cụ thể, nó được thể hiện chủ yếu trong các khía cạnh sau:
- Kết hợp nhiều chỉ số, đánh giá chính xác
Chiến lược này không chỉ sử dụng giao thoa của Wave như một tiêu chuẩn phán đoán, mà còn giới thiệu nhiều chỉ số như RSI, KD, deviation và nhiều chỉ số khác nhau để tăng độ chính xác của quyết định thông qua sự kết hợp.
- Phương pháp này có thể được sử dụng để đánh giá các xu hướng.
Bằng cách đưa ra mô-đun phán đoán hình cờ, có thể đánh giá hiệu quả sự liên tục của xu hướng, tránh bị nặng nề, do đó có thể nhận ra cơ hội khi xu hướng bắt đầu. Điều này làm cho chiến lược đặc biệt giỏi theo dõi xu hướng.
- Không có nhiều chỗ để tối ưu hóa các tham số thủ công
Các tham số chiến lược có thể được tùy chỉnh cao, người dùng có thể chọn các tham số khác nhau để tối ưu hóa dựa trên phán đoán và hiểu biết của mình về thị trường, do đó thích ứng với môi trường thị trường phức tạp hơn. Điều này làm cho phạm vi ứng dụng của chiến lược rộng hơn.
Rủi ro chiến lược
Chiến lược này cũng có một số rủi ro tiềm ẩn, đặc biệt là ở những khía cạnh sau:
- Các chỉ số hỗ trợ đa dạng để đánh giá xung đột
Có rất nhiều chỉ số hỗ trợ, và trong một số trường hợp cực đoan, có thể có các chỉ số đánh giá xung đột. Điều này sẽ mang lại sự không chắc chắn cho quyết định cuối cùng.
- Khó điều chỉnh các tham số
Vì có nhiều tham số có thể điều chỉnh, để đạt được sự kết hợp tham số tối ưu cần có nhiều dữ liệu phản hồi và thử nghiệm, khó khăn hơn và dễ bị tối ưu hóa quá mức.
- Có thể quá nhiều người mua bán.
Trong các tình huống xung đột, giao thoa Wave có thể xảy ra thường xuyên, dẫn đến việc giao dịch quá thường xuyên. Điều này sẽ dẫn đến chi phí giao dịch bổ sung.
Theo đó, có thể tối ưu hóa theo các khía cạnh sau:
Tiếp tục giới thiệu thêm các điều kiện lọc để đảm bảo sự ổn định của các quyết định
Ưu tiên điều chỉnh các tham số có ảnh hưởng đến chiến lược
Tăng phạm vi dừng lỗ, giảm tần suất mua bán
Tóm tắt
Nhìn chung, chiến lược này sử dụng lý thuyết sóng mật mã thị trường và nhiều chỉ số kỹ thuật để tự động xác định điểm mua và bán và theo dõi xu hướng. Các tham số của nó có thể điều chỉnh được, thích ứng rộng rãi và giỏi trong việc nắm bắt cơ hội xu hướng. Tuy nhiên, cũng cần lưu ý đến một số rủi ro tiềm ẩn, cần phải liên tục tối ưu hóa từ các quy tắc phán đoán nâng cấp và điều chỉnh tham số để làm cho chiến lược trở nên vững chắc hơn.
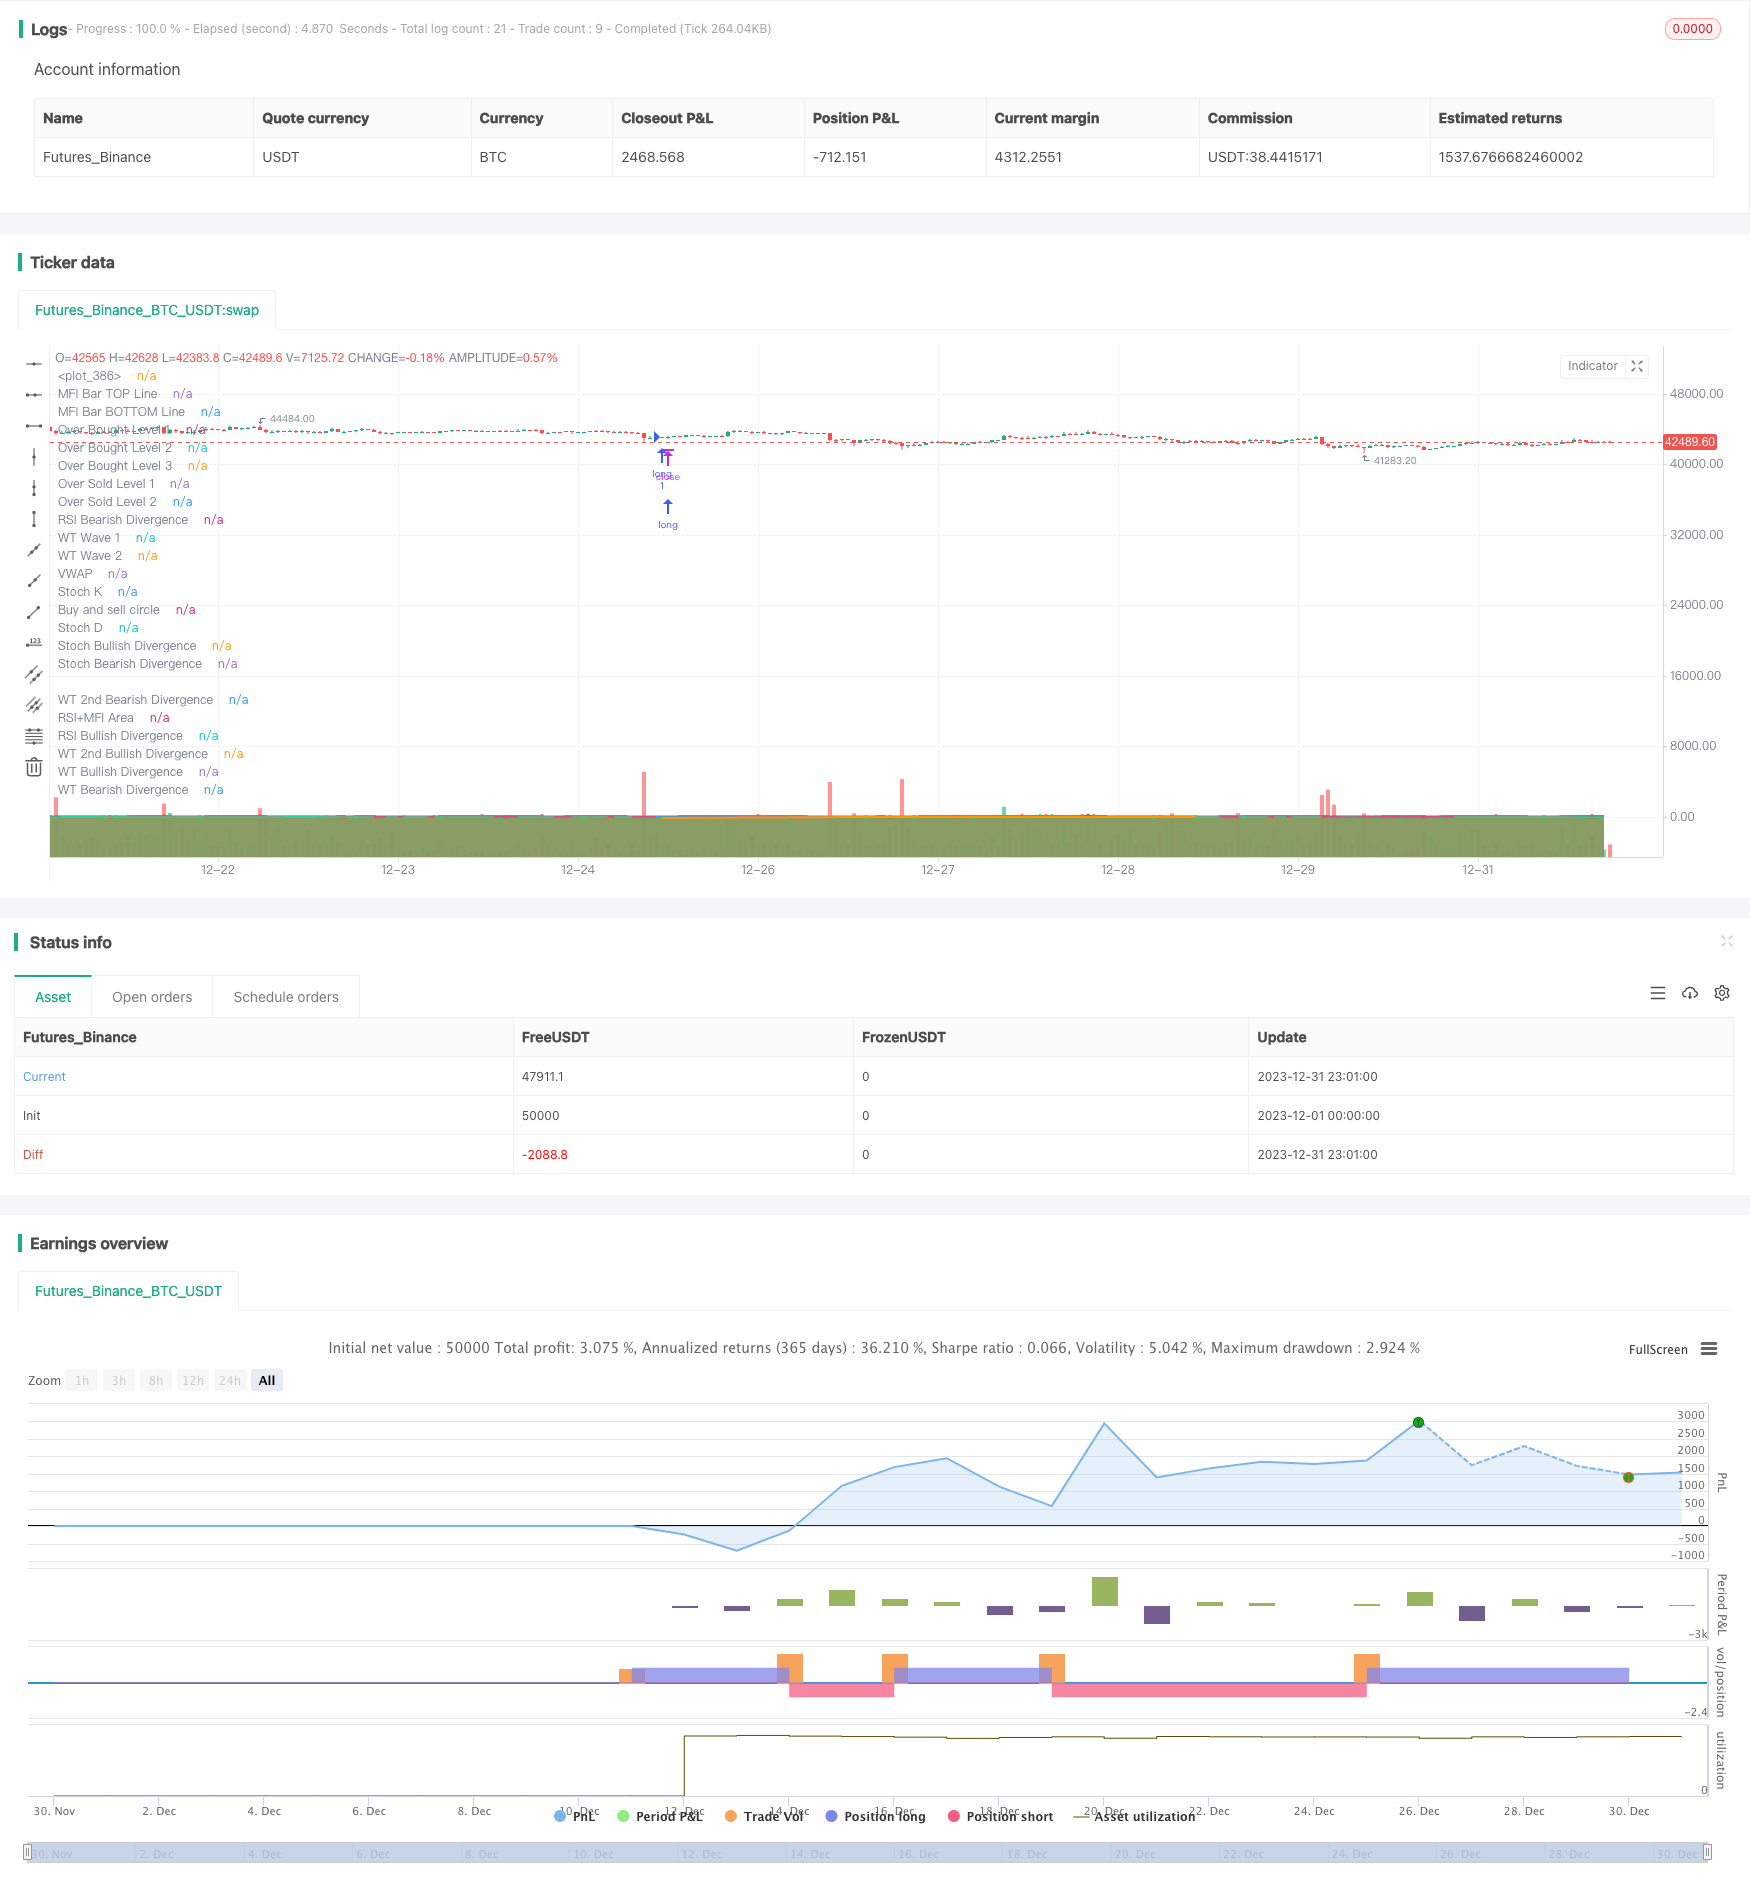
/*backtest
start: 2023-12-01 00:00:00
end: 2023-12-31 23:59:59
period: 1h
basePeriod: 15m
exchanges: [{"eid":"Futures_Binance","currency":"BTC_USDT"}]
*/

// This source code is subject to the terms of the Mozilla Public License 2.0 at https://mozilla.org/MPL/2.0/
// © vumanchu

//@version=5


//  Thanks to dynausmaux for the code
//  Thanks to falconCoin for https://www.tradingview.com/script/KVfgBvDd-Market-Cipher-B-Free-version-with-Buy-and-sell/ inspired me to start this.
//  Thanks to LazyBear for WaveTrend Oscillator https://www.tradingview.com/script/2KE8wTuF-Indicator-WaveTrend-Oscillator-WT/
//  Thanks to RicardoSantos for https://www.tradingview.com/script/3oeDh0Yq-RS-Price-Divergence-Detector-V2/
//  Thanks to LucemAnb for Plain Stochastic Divergence https://www.tradingview.com/script/FCUgF8ag-Plain-Stochastic-Divergence/
//  Thanks to andreholanda73 for MFI+RSI Area https://www.tradingview.com/script/UlGZzUAr/
//  I especially want to thank TradingView for its platform that facilitates development and learning.

//
//  CIRCLES & TRIANGLES:
//    - LITTLE CIRCLE: They appear at all WaveTrend wave crossings.
//    - GREEN CIRCLE: The wavetrend waves are at the oversold level and have crossed up (bullish).
//    - RED CIRCLE: The wavetrend waves are at the overbought level and have crossed down (bearish).
//    - GOLD/ORANGE CIRCLE: When RSI is below 20, WaveTrend waves are below or equal to -80 and have crossed up after good bullish divergence (DONT BUY WHEN GOLD CIRCLE APPEAR).
//    - None of these circles are certain signs to trade. It is only information that can help you.
//    - PURPLE TRIANGLE: Appear when a bullish or bearish divergence is formed and WaveTrend waves crosses at overbought and oversold points.
//
//  NOTES:
//    - I am not an expert trader or know how to program pine script as such, in fact it is my first indicator only to study and all the code is copied and modified from other codes that are published in TradingView.
//    - I am very grateful to the entire TV community that publishes codes so that other newbies like me can learn and present their results. This is an attempt to imitate Market Cipher B.
//    - Settings by default are for 4h timeframe, divergences are more stronger and accurate. Haven't tested in all timeframes, only 2h and 4h.
//    - If you get an interesting result in other timeframes I would be very grateful if you would comment your configuration to implement it or at least check it.
//
//  CONTRIBUTIONS:
//    - Tip/Idea: Add higher timeframe analysis for bearish/bullish patterns at the current timeframe.
//    + Bearish/Bullish FLAG:
//      - MFI+RSI Area are RED (Below 0).
//      - Wavetrend waves are above 0 and crosses down.
//      - VWAP Area are below 0 on higher timeframe.
//      - This pattern reversed becomes bullish.
//    - Tip/Idea: Check the last heikinashi candle from 2 higher timeframe
//    + Bearish/Bullish DIAMOND:
//      - HT Candle is red
//      - WT > 0 and crossed down

strategy(title='MCB CIRCLE ONLY PGB STRAT BUN TP SL TEST', shorttitle='MCB CIRCLE ONLY PGB STRAT BUN TP SL TEST', overlay=true )
    // strategy.cash
    //max_bars_back = 200)

// PARAMETERS {

// WaveTrend
wtShow = input(true, title='Show WaveTrend')
wtBuyShow = input(true, title='Show Buy dots')
wtGoldShow = input(true, title='Show Gold dots')
wtSellShow = input(true, title='Show Sell dots')
wtDivShow = input(true, title='Show Div. dots')
vwapShow = input(true, title='Show Fast WT')
wtChannelLen = input(9, title='WT Channel Length')
wtAverageLen = input(12, title='WT Average Length')
wtMASource = input(hlc3, title='WT MA Source')
wtMALen = input(3, title='WT MA Length')

// WaveTrend Overbought & Oversold lines
obLevel = input(70, title='WT Overbought Level 1')
obLevel2 = input(99, title='WT Overbought Level 2')
obLevel3 = input(99, title='WT Overbought Level 3')
osLevel = -obLevel
osLevel2 = input(-99, title='WT Oversold Level 2')
osLevel3 = input(-99, title='WT Oversold Level 3')

// Divergence WT
wtShowDiv = input(true, title='Show WT Regular Divergences')
wtShowHiddenDiv = input(false, title='Show WT Hidden Divergences')
showHiddenDiv_nl = input(true, title='Not apply OB/OS Limits on Hidden Divergences')
wtDivOBLevel = input(81, title='WT Bearish Divergence min')
// wtDivOSLevel = input(-91, title='WT Bullish Divergence min')
wtDivOSLevel = -wtDivOBLevel

// Divergence extra range
wtDivOBLevel_addshow = input(true, title='Show 2nd WT Regular Divergences')
wtDivOBLevel_add = input(63, title='WT 2nd Bearish Divergence')
// wtDivOSLevel_add = input(-40, title='WT 2nd Bullish Divergence 15 min')
wtDivOSLevel_add = -wtDivOBLevel_add

// RSI+MFI
rsiMFIShow = input(true, title='Show MFI')
rsiMFIperiod = input(60, title='MFI Period')
rsiMFIMultiplier = input.float(150, title='MFI Area multiplier')
rsiMFIPosY = input(2.5, title='MFI Area Y Pos')

// RSI
rsiShow = input(false, title='Show RSI')
rsiSRC = input(close, title='RSI Source')
rsiLen = input(14, title='RSI Length')
rsiOversold = input.int(30, title='RSI Oversold', minval=30, maxval=100)
rsiOverbought = input.int(60, title='RSI Overbought', minval=0, maxval=60)

// Divergence RSI
rsiShowDiv = input(false, title='Show RSI Regular Divergences')
rsiShowHiddenDiv = input(false, title='Show RSI Hidden Divergences')
rsiDivOBLevel = input(60, title='RSI Bearish Divergence min')
rsiDivOSLevel = input(30, title='RSI Bullish Divergence min')

// RSI Stochastic
stochShow = input(true, title='Show Stochastic RSI')
stochUseLog = input(true, title=' Use Log?')
stochAvg = input(false, title='Use Average of both K & D')
stochSRC = input(close, title='Stochastic RSI Source')
stochLen = input(14, title='Stochastic RSI Length')
stochRsiLen = input(14, title='RSI Length ')
stochKSmooth = input(3, title='Stochastic RSI K Smooth')
stochDSmooth = input(3, title='Stochastic RSI D Smooth')

// Divergence stoch
stochShowDiv = input(false, title='Show Stoch Regular Divergences')
stochShowHiddenDiv = input(false, title='Show Stoch Hidden Divergences')

// Schaff Trend Cycle
tcLine = input(false, title='Show Schaff TC line')
tcSRC = input(close, title='Schaff TC Source')
tclength = input(10, title='Schaff TC')
tcfastLength = input(23, title='Schaff TC Fast Lenght')
tcslowLength = input(50, title='Schaff TC Slow Length')
tcfactor = input(0.5, title='Schaff TC Factor')

// Sommi Flag
sommiFlagShow = input(false, title='Show Sommi flag')
sommiShowVwap = input(false, title='Show Sommi F. Wave')
sommiVwapTF = input('720', title='Sommi F. Wave timeframe')
sommiVwapBearLevel = input(0, title='F. Wave Bear Level (less than)')
sommiVwapBullLevel = input(0, title='F. Wave Bull Level (more than)')
soomiFlagWTBearLevel = input(0, title='WT Bear Level (more than)')
soomiFlagWTBullLevel = input(0, title='WT Bull Level (less than)')
soomiRSIMFIBearLevel = input(0, title='Money flow Bear Level (less than)')
soomiRSIMFIBullLevel = input(0, title='Money flow Bull Level (more than)')

// Sommi Diamond
sommiDiamondShow = input(false, title='Show Sommi diamond')
sommiHTCRes = input('60', title='HTF Candle Res. 1')
sommiHTCRes2 = input('240', title='HTF Candle Res. 2')
soomiDiamondWTBearLevel = input(0, title='WT Bear Level (More than)')
soomiDiamondWTBullLevel = input(0, title='WT Bull Level (Less than)')

// macd Colors
macdWTColorsShow = input(false, title='Show MACD Colors')
macdWTColorsTF = input('240', title='MACD Colors MACD TF')

darkMode = input(false, title='Dark mode')


// Colors
colorRed = #ff0000
colorPurple = #e600e6
colorGreen = #3fff00
colorOrange = #e2a400
colorYellow = #ffe500
colorWhite = #ffffff
colorPink = #ff00f0
colorBluelight = #31c0ff

colorWT1 = #90caf9
colorWT2 = #0d47a1

colorWT2_ = #131722

colormacdWT1a = #4caf58
colormacdWT1b = #af4c4c
colormacdWT1c = #7ee57e
colormacdWT1d = #ff3535

colormacdWT2a = #305630
colormacdWT2b = #310101
colormacdWT2c = #132213
colormacdWT2d = #770000

// } PARAMETERS


// FUNCTIONS {

// Divergences
f_top_fractal(src) =>
    src[4] < src[2] and src[3] < src[2] and src[2] > src[1] and src[2] > src[0]
f_bot_fractal(src) =>
    src[4] > src[2] and src[3] > src[2] and src[2] < src[1] and src[2] < src[0]
f_fractalize(src) =>
    f_top_fractal(src) ? 1 : f_bot_fractal(src) ? -1 : 0

f_findDivs(src, topLimit, botLimit, useLimits) =>
    fractalTop = f_fractalize(src) > 0 and (useLimits ? src[2] >= topLimit : true) ? src[2] : na
    fractalBot = f_fractalize(src) < 0 and (useLimits ? src[2] <= botLimit : true) ? src[2] : na
    highPrev = ta.valuewhen(fractalTop, src[2], 0)[2]
    highPrice = ta.valuewhen(fractalTop, high[2], 0)[2]
    lowPrev = ta.valuewhen(fractalBot, src[2], 0)[2]
    lowPrice = ta.valuewhen(fractalBot, low[2], 0)[2]
    bearSignal = fractalTop and high[2] > highPrice and src[2] < highPrev
    bullSignal = fractalBot and low[2] < lowPrice and src[2] > lowPrev
    bearDivHidden = fractalTop and high[2] < highPrice and src[2] > highPrev
    bullDivHidden = fractalBot and low[2] > lowPrice and src[2] < lowPrev
    [fractalTop, fractalBot, lowPrev, bearSignal, bullSignal, bearDivHidden, bullDivHidden]

// RSI+MFI
f_rsimfi(_period, _multiplier, _tf) =>
    request.security(syminfo.tickerid, _tf, ta.sma((close - open) / (high - low) * _multiplier, _period) - rsiMFIPosY)

// WaveTrend
f_wavetrend(src, chlen, avg, malen, tf) =>
    tfsrc = request.security(syminfo.tickerid, tf, src)
    esa = ta.ema(tfsrc, chlen)
    de = ta.ema(math.abs(tfsrc - esa), chlen)
    ci = (tfsrc - esa) / (0.015 * de)
    wt1 = request.security(syminfo.tickerid, tf, ta.ema(ci, avg))
    wt2 = request.security(syminfo.tickerid, tf, ta.sma(wt1, malen))
    wtVwap = wt1 - wt2
    wtOversold = wt2 <= osLevel
    wtOverbought = wt2 >= obLevel
    wtCross = ta.cross(wt1, wt2)
    wtCrossUp = wt2 - wt1 <= 0
    wtCrossDown = wt2 - wt1 >= 0
    wtCrosslast = ta.cross(wt1[2], wt2[2])
    wtCrossUplast = wt2[2] - wt1[2] <= 0
    wtCrossDownlast = wt2[2] - wt1[2] >= 0
    [wt1, wt2, wtOversold, wtOverbought, wtCross, wtCrossUp, wtCrossDown, wtCrosslast, wtCrossUplast, wtCrossDownlast, wtVwap]

// Schaff Trend Cycle
f_tc(src, length, fastLength, slowLength) =>
    ema1 = ta.ema(src, fastLength)
    ema2 = ta.ema(src, slowLength)
    macdVal = ema1 - ema2
    alpha = ta.lowest(macdVal, length)
    beta = ta.highest(macdVal, length) - alpha
    gamma = (macdVal - alpha) / beta * 100
    gamma := beta > 0 ? gamma : nz(gamma[1])
    delta = gamma
    delta := na(delta[1]) ? delta : delta[1] + tcfactor * (gamma - delta[1])
    epsilon = ta.lowest(delta, length)
    zeta = ta.highest(delta, length) - epsilon
    eta = (delta - epsilon) / zeta * 100
    eta := zeta > 0 ? eta : nz(eta[1])
    stcReturn = eta
    stcReturn := na(stcReturn[1]) ? stcReturn : stcReturn[1] + tcfactor * (eta - stcReturn[1])
    stcReturn

// Stochastic RSI
f_stochrsi(_src, _stochlen, _rsilen, _smoothk, _smoothd, _log, _avg) =>
    src = _log ? math.log(_src) : _src
    rsi = ta.rsi(src, _rsilen)
    kk = ta.sma(ta.stoch(rsi, rsi, rsi, _stochlen), _smoothk)
    d1 = ta.sma(kk, _smoothd)
    avg_1 = math.avg(kk, d1)
    k = _avg ? avg_1 : kk
    [k, d1]

// MACD
f_macd(src, fastlen, slowlen, sigsmooth, tf) =>
    fast_ma = request.security(syminfo.tickerid, tf, ta.ema(src, fastlen))
    slow_ma = request.security(syminfo.tickerid, tf, ta.ema(src, slowlen))
    macd = fast_ma - slow_ma
    signal = request.security(syminfo.tickerid, tf, ta.sma(macd, sigsmooth))
    hist = macd - signal
    [macd, signal, hist]

// MACD Colors on WT
f_macdWTColors(tf) =>
    hrsimfi = f_rsimfi(rsiMFIperiod, rsiMFIMultiplier, tf)
    [macd, signal, hist] = f_macd(close, 28, 42, 9, macdWTColorsTF)
    macdup = macd >= signal
    macddown = macd <= signal
    macdWT1Color = macdup ? hrsimfi > 0 ? colormacdWT1c : colormacdWT1a : macddown ? hrsimfi < 0 ? colormacdWT1d : colormacdWT1b : na
    macdWT2Color = macdup ? hrsimfi < 0 ? colormacdWT2c : colormacdWT2a : macddown ? hrsimfi < 0 ? colormacdWT2d : colormacdWT2b : na
    [macdWT1Color, macdWT2Color]

// Get higher timeframe candle
f_getTFCandle(_tf) =>
    _open = request.security(ticker.heikinashi(syminfo.tickerid), _tf, open, barmerge.gaps_off, barmerge.lookahead_on)
    _close = request.security(ticker.heikinashi(syminfo.tickerid), _tf, close, barmerge.gaps_off, barmerge.lookahead_on)
    _high = request.security(ticker.heikinashi(syminfo.tickerid), _tf, high, barmerge.gaps_off, barmerge.lookahead_on)
    _low = request.security(ticker.heikinashi(syminfo.tickerid), _tf, low, barmerge.gaps_off, barmerge.lookahead_on)
    hl2 = (_high + _low) / 2.0
    newBar = ta.change(_open)
    candleBodyDir = _close > _open
    [candleBodyDir, newBar]

// Sommi flag
f_findSommiFlag(tf, wt1, wt2, rsimfi, wtCross, wtCrossUp, wtCrossDown) =>
    [hwt1, hwt2, hwtOversold, hwtOverbought, hwtCross, hwtCrossUp, hwtCrossDown, hwtCrosslast, hwtCrossUplast, hwtCrossDownlast, hwtVwap] = f_wavetrend(wtMASource, wtChannelLen, wtAverageLen, wtMALen, tf)

    bearPattern = rsimfi < soomiRSIMFIBearLevel and wt2 > soomiFlagWTBearLevel and wtCross and wtCrossDown and hwtVwap < sommiVwapBearLevel

    bullPattern = rsimfi > soomiRSIMFIBullLevel and wt2 < soomiFlagWTBullLevel and wtCross and wtCrossUp and hwtVwap > sommiVwapBullLevel

    [bearPattern, bullPattern, hwtVwap]

f_findSommiDiamond(tf, tf2, wt1, wt2, wtCross, wtCrossUp, wtCrossDown) =>
    [candleBodyDir, newBar] = f_getTFCandle(tf)
    [candleBodyDir2, newBar2] = f_getTFCandle(tf2)
    bearPattern = wt2 >= soomiDiamondWTBearLevel and wtCross and wtCrossDown and not candleBodyDir and not candleBodyDir2
    bullPattern = wt2 <= soomiDiamondWTBullLevel and wtCross and wtCrossUp and candleBodyDir and candleBodyDir2
    [bearPattern, bullPattern]

// } FUNCTIONS

// CALCULATE INDICATORS {

// RSI
rsi = ta.rsi(rsiSRC, rsiLen)
rsiColor = rsi <= rsiOversold ? colorGreen : rsi >= rsiOverbought ? colorRed : colorPurple

// RSI + MFI Area
rsiMFI = f_rsimfi(rsiMFIperiod, rsiMFIMultiplier, timeframe.period)
rsiMFIColor = rsiMFI > 0 ? #3ee145 : #ff3d2e

// Calculates WaveTrend
[wt1, wt2, wtOversold, wtOverbought, wtCross, wtCrossUp, wtCrossDown, wtCross_last, wtCrossUp_last, wtCrossDown_last, wtVwap] = f_wavetrend(wtMASource, wtChannelLen, wtAverageLen, wtMALen, timeframe.period)

// Stochastic RSI
[stochK, stochD] = f_stochrsi(stochSRC, stochLen, stochRsiLen, stochKSmooth, stochDSmooth, stochUseLog, stochAvg)

// Schaff Trend Cycle
tcVal = f_tc(tcSRC, tclength, tcfastLength, tcslowLength)

// Sommi flag
[sommiBearish, sommiBullish, hvwap] = f_findSommiFlag(sommiVwapTF, wt1, wt2, rsiMFI, wtCross, wtCrossUp, wtCrossDown)

//Sommi diamond
[sommiBearishDiamond, sommiBullishDiamond] = f_findSommiDiamond(sommiHTCRes, sommiHTCRes2, wt1, wt2, wtCross, wtCrossUp, wtCrossDown)

// macd colors
[macdWT1Color, macdWT2Color] = f_macdWTColors(macdWTColorsTF)

// WT Divergences
[wtFractalTop, wtFractalBot, wtLow_prev, wtBearDiv, wtBullDiv, wtBearDivHidden, wtBullDivHidden] = f_findDivs(wt2, wtDivOBLevel, wtDivOSLevel, true)

[wtFractalTop_add, wtFractalBot_add, wtLow_prev_add, wtBearDiv_add, wtBullDiv_add, wtBearDivHidden_add, wtBullDivHidden_add] = f_findDivs(wt2, wtDivOBLevel_add, wtDivOSLevel_add, true)
[wtFractalTop_nl, wtFractalBot_nl, wtLow_prev_nl, wtBearDiv_nl, wtBullDiv_nl, wtBearDivHidden_nl, wtBullDivHidden_nl] = f_findDivs(wt2, 0, 0, false)

wtBearDivHidden_ = showHiddenDiv_nl ? wtBearDivHidden_nl : wtBearDivHidden
wtBullDivHidden_ = showHiddenDiv_nl ? wtBullDivHidden_nl : wtBullDivHidden

wtBearDivColor = wtShowDiv and wtBearDiv or wtShowHiddenDiv and wtBearDivHidden_ ? colorRed : na
wtBullDivColor = wtShowDiv and wtBullDiv or wtShowHiddenDiv and wtBullDivHidden_ ? colorGreen : na

wtBearDivColor_add = wtShowDiv and wtDivOBLevel_addshow and wtBearDiv_add or wtShowHiddenDiv and wtDivOBLevel_addshow and wtBearDivHidden_add ? #9a0202 : na
wtBullDivColor_add = wtShowDiv and wtDivOBLevel_addshow and wtBullDiv_add or wtShowHiddenDiv and wtDivOBLevel_addshow and wtBullDivHidden_add ? #1b5e20 : na

// RSI Divergences
[rsiFractalTop, rsiFractalBot, rsiLow_prev, rsiBearDiv, rsiBullDiv, rsiBearDivHidden, rsiBullDivHidden] = f_findDivs(rsi, rsiDivOBLevel, rsiDivOSLevel, true)
[rsiFractalTop_nl, rsiFractalBot_nl, rsiLow_prev_nl, rsiBearDiv_nl, rsiBullDiv_nl, rsiBearDivHidden_nl, rsiBullDivHidden_nl] = f_findDivs(rsi, 0, 0, false)

rsiBearDivHidden_ = showHiddenDiv_nl ? rsiBearDivHidden_nl : rsiBearDivHidden
rsiBullDivHidden_ = showHiddenDiv_nl ? rsiBullDivHidden_nl : rsiBullDivHidden

rsiBearDivColor = rsiShowDiv and rsiBearDiv or rsiShowHiddenDiv and rsiBearDivHidden_ ? colorRed : na
rsiBullDivColor = rsiShowDiv and rsiBullDiv or rsiShowHiddenDiv and rsiBullDivHidden_ ? colorGreen : na

// Stoch Divergences
[stochFractalTop, stochFractalBot, stochLow_prev, stochBearDiv, stochBullDiv, stochBearDivHidden, stochBullDivHidden] = f_findDivs(stochK, 0, 0, false)

stochBearDivColor = stochShowDiv and stochBearDiv or stochShowHiddenDiv and stochBearDivHidden ? colorRed : na
stochBullDivColor = stochShowDiv and stochBullDiv or stochShowHiddenDiv and stochBullDivHidden ? colorGreen : na


// Small Circles WT Cross
signalColor = wt2 - wt1 > 0 ? color.red : color.lime

// Buy signal.
buySignal = wtCross and wtCrossUp and wtOversold

buySignalDiv = wtShowDiv and wtBullDiv or wtShowDiv and wtBullDiv_add or stochShowDiv and stochBullDiv or rsiShowDiv and rsiBullDiv

buySignalDiv_color = wtBullDiv ? colorGreen : wtBullDiv_add ? color.new(colorGreen, 100) : rsiShowDiv ? colorGreen : na

// Sell signal
sellSignal = wtCross and wtCrossDown and wtOverbought

sellSignalDiv = wtShowDiv and wtBearDiv or wtShowDiv and wtBearDiv_add or stochShowDiv and stochBearDiv or rsiShowDiv and rsiBearDiv

sellSignalDiv_color = wtBearDiv ? colorRed : wtBearDiv_add ? color.new(colorRed, 60) : rsiBearDiv ? colorRed : na

// Gold Buy
lastRsi = ta.valuewhen(wtFractalBot, rsi[2], 0)[2]
wtGoldBuy = (wtShowDiv and wtBullDiv or rsiShowDiv and rsiBullDiv) and wtLow_prev <= osLevel3 and wt2 > osLevel3 and wtLow_prev - wt2 <= -5 and lastRsi < 30

// } CALCULATE INDICATORS


// DRAW {
bgcolor(darkMode ? color.new(#000000, 80) : na, transp=90)
zLine = plot(0, color=color.new(colorWhite, 50))

//  MFI BAR
rsiMfiBarTopLine = plot(rsiMFIShow ? -95 : na, title='MFI Bar TOP Line', transp=100)
rsiMfiBarBottomLine = plot(rsiMFIShow ? -99 : na, title='MFI Bar BOTTOM Line', transp=50)
fill(rsiMfiBarTopLine, rsiMfiBarBottomLine, title='MFI Bar Colors', color=rsiMFIColor, transp=75)

// WT Areas
plot(wtShow ? wt1 : na, style=plot.style_area, title='WT Wave 1', color=macdWTColorsShow ? macdWT1Color : colorWT1, transp=0)
plot(wtShow ? wt2 : na, style=plot.style_area, title='WT Wave 2', color=macdWTColorsShow ? macdWT2Color : darkMode ? colorWT2_ : colorWT2, transp=20)

// VWAP
plot(vwapShow ? wtVwap : na, title='VWAP', color=color.new(colorYellow, 45), style=plot.style_area, linewidth=2)

// MFI AREA
rsiMFIplot = plot(rsiMFIShow ? rsiMFI : na, title='RSI+MFI Area', color=rsiMFIColor, transp=20)
fill(rsiMFIplot, zLine, rsiMFIColor, transp=40)

// WT Div

plot(series=wtFractalTop ? wt2[2] : na, title='WT Bearish Divergence', color=wtBearDivColor, linewidth=2, offset=-2)
plot(series=wtFractalBot ? wt2[2] : na, title='WT Bullish Divergence', color=wtBullDivColor, linewidth=2, offset=-2)

// WT 2nd Div
plot(series=wtFractalTop_add ? wt2[2] : na, title='WT 2nd Bearish Divergence', color=wtBearDivColor_add, linewidth=2, offset=-2)
plot(series=wtFractalBot_add ? wt2[2] : na, title='WT 2nd Bullish Divergence', color=wtBullDivColor_add, linewidth=2, offset=-2)

// RSI
plot(rsiShow ? rsi : na, title='RSI', color=rsiColor, linewidth=2, transp=25)

// RSI Div
plot(series=rsiFractalTop ? rsi[2] : na, title='RSI Bearish Divergence', color=rsiBearDivColor, linewidth=1, offset=-2)
plot(series=rsiFractalBot ? rsi[2] : na, title='RSI Bullish Divergence', color=rsiBullDivColor, linewidth=1, offset=-2)

// Stochastic RSI
stochKplot = plot(stochShow ? stochK : na, title='Stoch K', color=color.new(#21baf3, 0), linewidth=2)
stochDplot = plot(stochShow ? stochD : na, title='Stoch D', color=color.new(#673ab7, 60), linewidth=1)
stochFillColor = stochK >= stochD ? color.new(#21baf3, 75) : color.new(#673ab7, 60)
fill(stochKplot, stochDplot, title='KD Fill', color=stochFillColor, transp=90)

// Stoch Div
plot(series=stochFractalTop ? stochK[2] : na, title='Stoch Bearish Divergence', color=stochBearDivColor, linewidth=1, offset=-2)
plot(series=stochFractalBot ? stochK[2] : na, title='Stoch Bullish Divergence', color=stochBullDivColor, linewidth=1, offset=-2)

// Schaff Trend Cycle
plot(tcLine ? tcVal : na, color=color.new(#673ab7, 25), linewidth=2, title='Schaff Trend Cycle 1')
plot(tcLine ? tcVal : na, color=color.new(colorWhite, 50), linewidth=1, title='Schaff Trend Cycle 2')


// Draw Overbought & Oversold lines
plot(obLevel, title='Over Bought Level 1', color=color.new(colorWhite, 11), linewidth=1, style=plot.style_line)
plot(obLevel2, title='Over Bought Level 2', color=color.new(colorWhite, 85), linewidth=1, style=plot.style_stepline)
plot(obLevel3, title='Over Bought Level 3', color=color.new(colorWhite, 95), linewidth=1, style=plot.style_circles)

plot(osLevel, title='Over Sold Level 1', color=color.new(colorWhite, 11), linewidth=1, style=plot.style_line)
plot(osLevel2, title='Over Sold Level 2', color=color.new(colorWhite, 85), linewidth=1, style=plot.style_stepline)

// Sommi flag
plotchar(sommiFlagShow and sommiBearish ? 108 : na, title='Sommi bearish flag', char='⚑', color=color.new(colorPink, 0), location=location.absolute, size=size.tiny)
plotchar(sommiFlagShow and sommiBullish ? -108 : na, title='Sommi bullish flag', char='⚑', color=color.new(colorBluelight, 0), location=location.absolute, size=size.tiny)
plot(sommiShowVwap ? ta.ema(hvwap, 3) : na, title='Sommi higher VWAP', color=color.new(colorYellow, 15), linewidth=2, style=plot.style_line)

// Sommi diamond
plotchar(sommiDiamondShow and sommiBearishDiamond ? 108 : na, title='Sommi bearish diamond', char='◆', color=color.new(colorPink, 0), location=location.absolute, size=size.tiny)
plotchar(sommiDiamondShow and sommiBullishDiamond ? -108 : na, title='Sommi bullish diamond', char='◆', color=color.new(colorBluelight, 0), location=location.absolute, size=size.tiny)

// Circles
plot(wtCross ? wt2 : na, title='Buy and sell circle', color=signalColor, style=plot.style_circles, linewidth=3, transp=15)

plotchar(wtBuyShow and buySignal ? -107 : na, title='Buy circle', char='·', color=color.new(colorGreen, 10), location=location.absolute, size=size.small)
plotchar(wtSellShow and sellSignal ? 105 : na, title='Sell circle', char='·', color=color.new(colorRed, 10), location=location.absolute, size=size.small)

plotchar(wtDivShow and buySignalDiv ? -106 : na, title='Divergence buy circle', char='•', color=buySignalDiv_color, location=location.absolute, size=size.small, offset=-2, transp=70)
plotchar(wtDivShow and sellSignalDiv ? 106 : na, title='Divergence sell circle', char='•', color=sellSignalDiv_color, location=location.absolute, size=size.small, offset=-2, transp=70)

plotchar(wtGoldBuy and wtGoldShow ? -106 : na, title='Gold  buy gold circle', char='•', color=color.new(colorOrange, 60), location=location.absolute, size=size.small, offset=-2)

// } DRAW


long = ta.crossover (wt1, wt2) and wt1<osLevel
// long = wtBullDiv or ta.crossover (wt1, wt2) and wt1<osLevel
// long = wtBullDiv
// short= wtBearDiv
// short= wtBearDiv or ta.crossunder(wt1, wt2) and wt1>obLevel
short= ta.crossunder(wt1, wt2) and wt1>obLevel

// Position Management Tools
pos = 0.0
pos:= long? 1 : short? -1 : pos[1]

longCond  = long  and (pos[1]!= 1 or na(pos[1]))
shortCond = short and (pos[1]!=-1 or na(pos[1]))

// EXIT FUNCTIONS //
i_sl  = input.float(0.0, title="Stop Loss %     ", minval=0, step=1, inline='sl ')
i_tp  = input.float(0.0, title="Take Profit %   ", minval=0, step=1, inline='tp ')
i_tsl = input.float(0.0, title="Trailing Stop Loss %", minval=0, step=1, inline='tsl')

sl  = i_sl >0? i_sl /100 : 99999
tp  = i_tp >0? i_tp /100 : 99999
tsl = i_tsl>0? i_tsl/100 : 99999

long_entry  = ta.valuewhen(longCond , close, 0)
short_entry = ta.valuewhen(shortCond, close, 0)

// Trailing Stop Loss
trail_long = 0.0, trail_short = 0.0
trail_long  := longCond? high : high>trail_long[1]? high : pos<1 ? 0  : trail_long[1]
trail_short := shortCond? low : low<trail_short[1]? low : pos>-1 ? 99999  : trail_short[1]
trail_long_final   = trail_long  * (1-tsl)
trail_short_final  = trail_short * (1+tsl)

// Simple Stop Loss and Take Profit
sl_long0   = long_entry * (1 - sl)
sl_short0  = short_entry * (1 + sl)

tp_long  = long_entry * (1 + tp)
tp_short = short_entry * (1 - tp)

sl_long  = math.max(sl_long0, trail_long_final)
sl_short = math.min(sl_short0, trail_short_final)

// Position Adjustment
long_sl  = low <sl_long[1]  and pos[1]==1
short_sl = high>sl_short[1] and pos[1]==-1

final_long_tp  = high>tp_long[1]  and pos[1]==1
final_short_tp = low <tp_short[1] and pos[1]==-1

if ((long_sl or final_long_tp) and not shortCond) or ((short_sl or final_short_tp) and not longCond)
    pos:=0

//  Strategy Backtest Limiting Algorithm
i_startTime = input(defval = timestamp("01 Sep 2002 13:30 +0000"), title = "Backtesting Start Time")
i_endTime   = input(defval = timestamp("30 Sep 2099 19:30 +0000"), title = "Backtesting End Time"  )
timeCond   = true
strategy.initial_capital = 50000
equity = strategy.initial_capital + strategy.netprofit

if equity>0 and timeCond
    if longCond
        strategy.entry("long" , strategy.long )
    if shortCond
        strategy.entry("short", strategy.short)

    strategy.exit("SL/TP", from_entry = "long" , stop=sl_long , limit=tp_long , comment_profit ='TP', comment_loss='SL')
    strategy.exit("SL/TP", from_entry = "short", stop=sl_short, limit=tp_short, comment_profit ='TP', comment_loss='SL')

// ALERTS {

// BUY
alertcondition(longCond, 'Buy (Big green circle)', 'Green circle WaveTrend Oversold')
alertcondition(buySignalDiv, 'Buy (Big green circle + Div)', 'Buy & WT Bullish Divergence & WT Overbought')
alertcondition(wtGoldBuy, 'GOLD Buy (Big GOLDEN circle)', 'Green & GOLD circle WaveTrend Overbought')
alertcondition(sommiBullish or sommiBullishDiamond, 'Sommi bullish flag/diamond', 'Blue flag/diamond')
alertcondition(wtCross and wtCrossUp, 'Buy (Small green dot)', 'Buy small circle')

// SELL
alertcondition(sommiBearish or sommiBearishDiamond, 'Sommi bearish flag/diamond', 'Purple flag/diamond')
alertcondition(sellSignal, 'Sell (Big red circle)', 'Red Circle WaveTrend Overbought')
alertcondition(sellSignalDiv, 'Sell (Big red circle + Div)', 'Buy & WT Bearish Divergence & WT Overbought')
alertcondition(wtCross and wtCrossDown, 'Sell (Small red dot)', 'Sell small circle')

// } ALERTS