Chiến lược theo dõi xu hướng chéo thị trường dựa trên đường trung bình động EMA, dừng lỗ động hai chiều
Ngày tạo:
2024-01-29 09:57:20
sửa đổi lần cuối:
2024-01-29 09:57:20
sao chép:
0
Số nhấp chuột:
710
1
tập trung vào
1750
Người theo dõi
Tổng quan
Chiến lược này dựa trên EMA trung bình để theo dõi hai chiều và thiết lập đường dừng ngắn dài động để nắm bắt xu hướng.
Nguyên tắc chiến lược
- Tính toán đường EMA nhanh ((5) và đường EMA chậm ((20)
- Làm nhiều hơn khi đường nhanh đi qua đường chậm từ phía dưới; làm khoảng trống khi đường nhanh đi qua đường chậm từ phía trên
- Sau khi thực hiện nhiều, thiết lập một đường dừng động cho giá khởi điểm(1- Tỷ lệ phần trăm lỗ hổng của vị trí dài); Sau khi làm giảm giá, thiết lập đường dừng động như giá nhập(1 + tỷ lệ phần trăm lỗ ngắn)
- Một khi giá kích hoạt đường dừng tương ứng, dừng lại.
Phân tích lợi thế
- EMA trung bình có khả năng theo dõi xu hướng mạnh mẽ, đồng hồ hình thành qua hai chiều, có thể khóa hiệu quả cơ hội xu hướng
- Động lực tính toán đường dừng lỗ, tiếp tục thị trường sau khi đạt được lợi nhuận, có thể khóa lợi nhuận theo xu hướng tối đa
- Sử dụng VWP như một điều kiện lọc bổ sung để tránh bị mắc kẹt và cải thiện chất lượng tín hiệu
Phân tích rủi ro
- Chiến lược xu hướng thuần túy, dễ bị mắc kẹt khi thị trường biến động
- Lạm phát quá nhẹ có thể làm tăng tổn thất
- EMA có thể bị trễ ở điểm tốt nhất của thị trường
Các phương pháp có thể được tối ưu hóa bằng cách sử dụng ATR để kiểm soát rủi ro, tối ưu hóa chiến lược dừng lỗ ngắn hạn hoặc kết hợp với các chỉ số khác để lọc tiếng ồn giao dịch.
Hướng tối ưu hóa
- Kết hợp các chỉ số dừng động như ATR hoặc DONCH để thiết lập đường dừng phù hợp hơn với thị trường
- Thêm các chỉ số kỹ thuật khác để lọc tín hiệu, chẳng hạn như MACD, KDJ, và nhiều hơn nữa, để giảm sai lệch
- Tối ưu hóa tham số, tìm kiếm kết hợp chiều dài đường trung bình chậm nhanh tốt nhất
- Bạn có thể thử các phương pháp học máy để tìm các tham số tối ưu
Tóm tắt
Chiến lược này nói chung là một chiến lược theo dõi xu hướng rất điển hình. Hai EMA tạo ra một cái chết, dừng động, có thể khóa hiệu quả cho xu hướng. Ngoài ra, có một số rủi ro bị tụt hậu và rủi ro dừng quá rộng.
Mã nguồn chiến lược
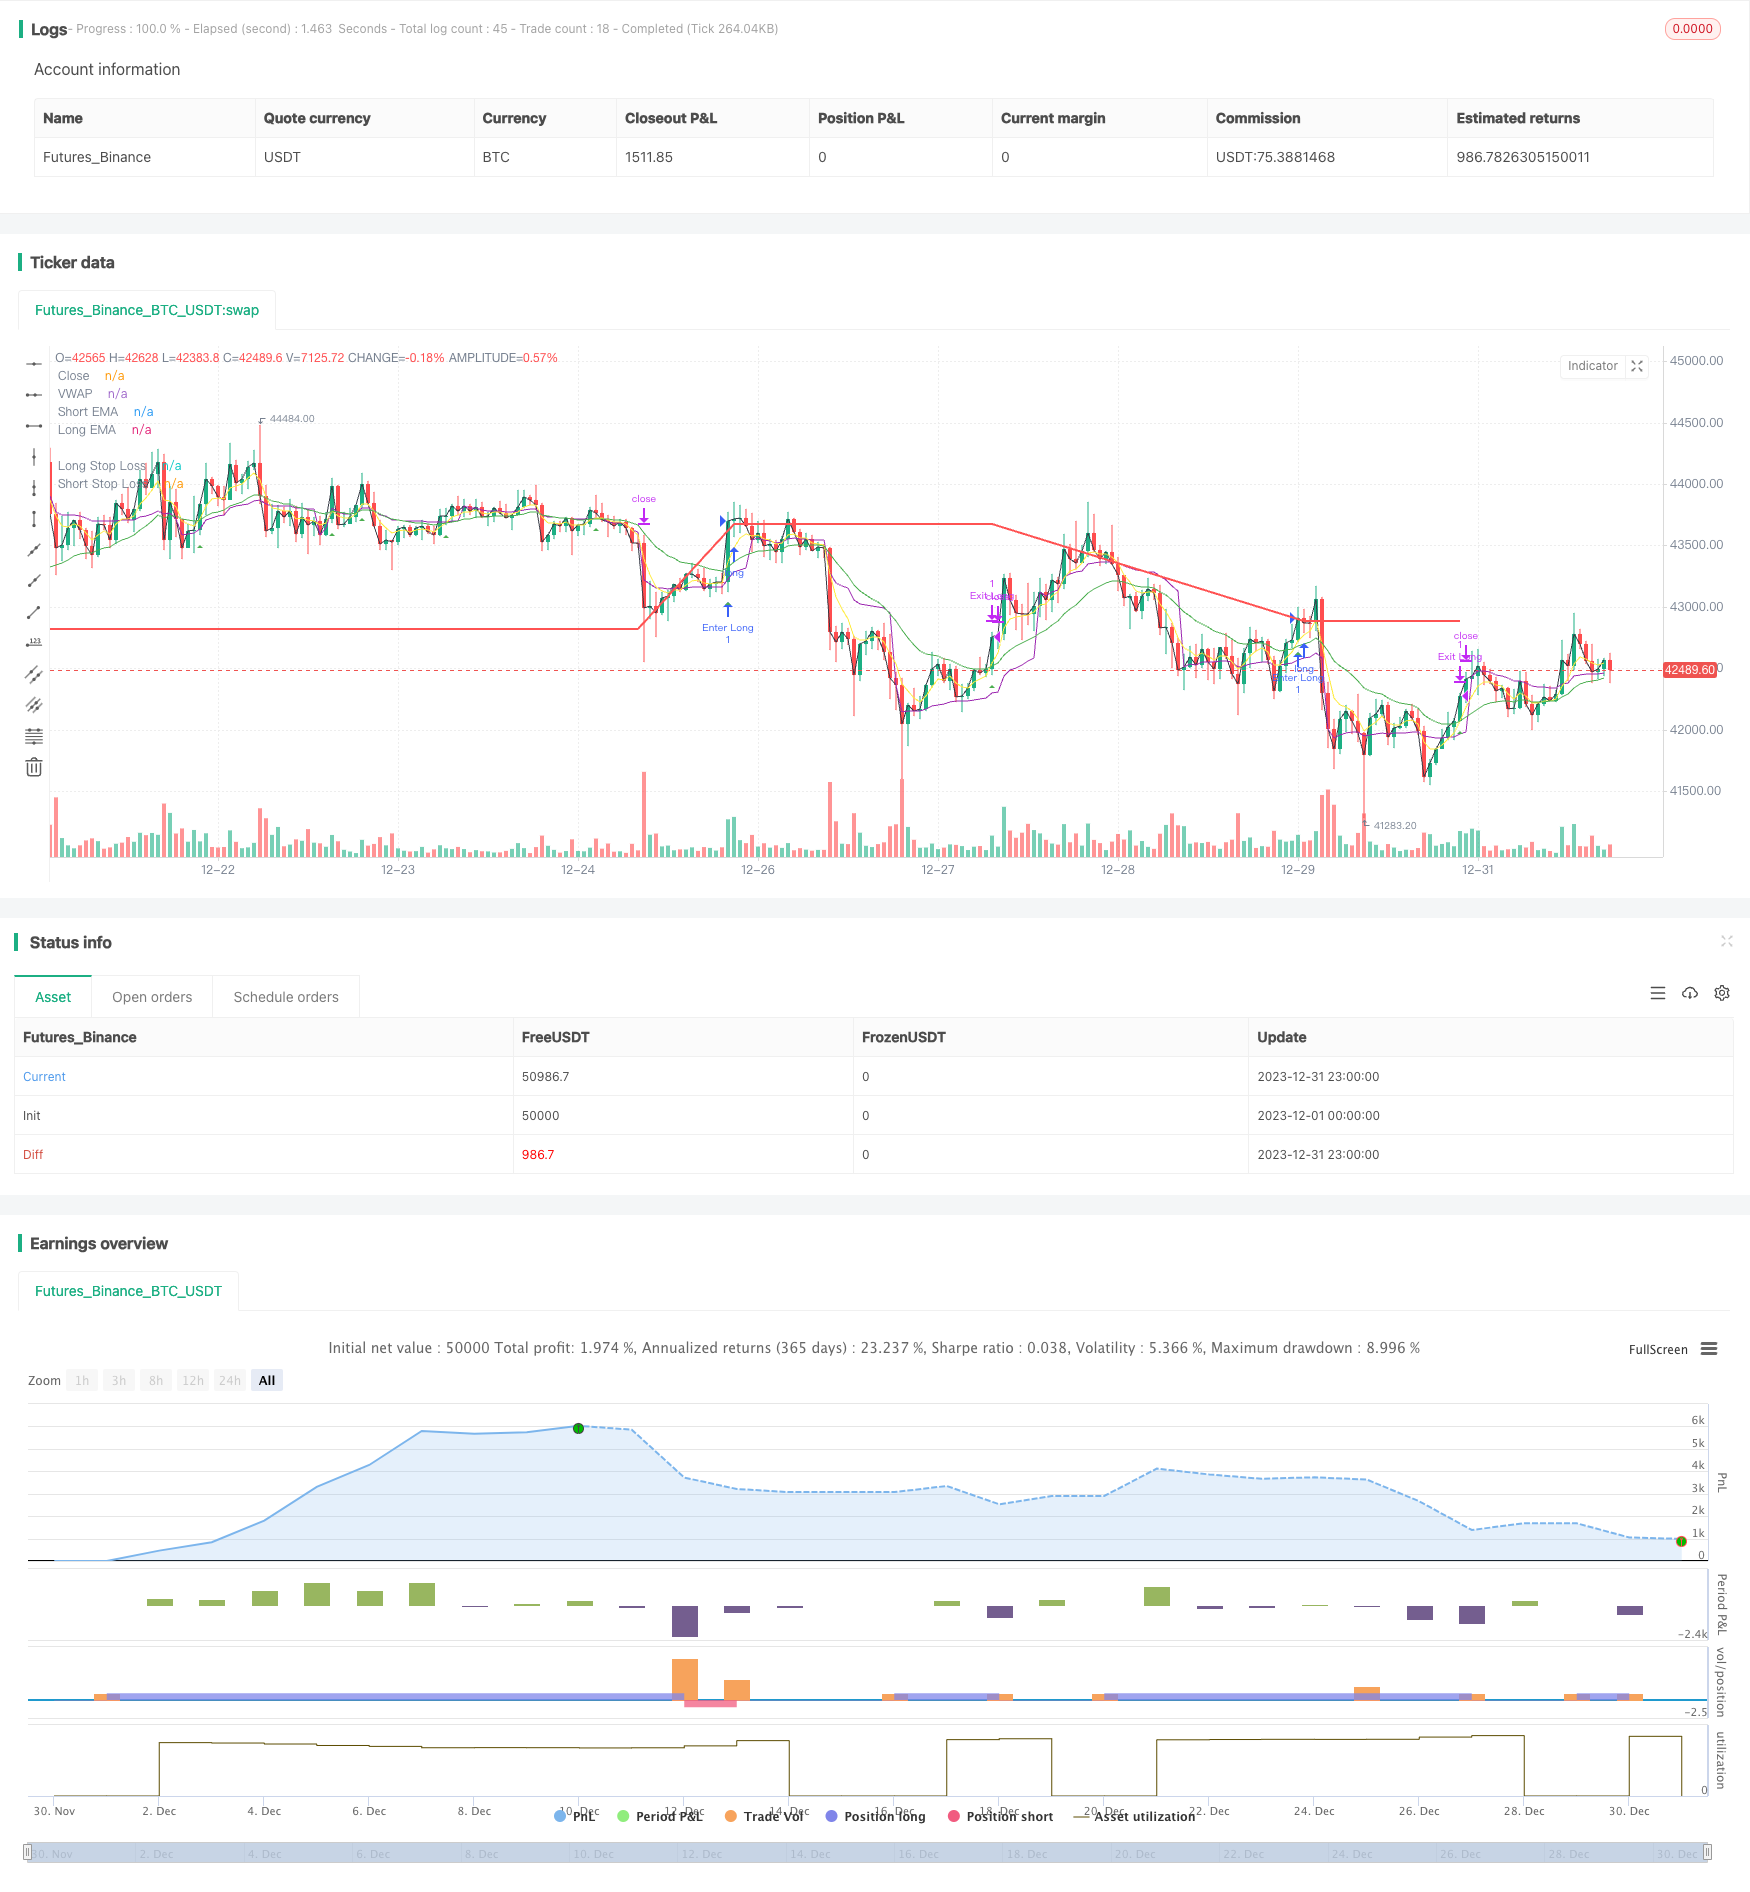
/*backtest
start: 2023-12-01 00:00:00
end: 2023-12-31 23:59:59
period: 1h
basePeriod: 15m
exchanges: [{"eid":"Futures_Binance","currency":"BTC_USDT"}]
*/

//@version=5

strategy("EMA Crossover Strategy", shorttitle="EMAC", overlay=true,calc_on_every_tick=true)

// Input parameters
shortEmaLength = input(5, title="Short EMA Length")
longEmaLength = input(20, title="Long EMA Length")
priceEmaLength = input(1, title="Price EMA Length")

// Set stop loss level with input options (optional)
longLossPerc = input.float(0.05, title="Long Stop Loss (%)",
     minval=0.0, step=0.1) * 0.01

shortLossPerc = input.float(0.05, title="Short Stop Loss (%)",
     minval=0.0, step=0.1) * 0.01

// Calculating indicators
shortEma = ta.ema(close, shortEmaLength)
longEma = ta.ema(close, longEmaLength)
//priceEma = ta.ema(close, priceEmaLength)
vwap = ta.vwap(close)

// Long entry conditions
longCondition = ta.crossover(shortEma, longEma) and close > vwap
// Short entry conditions
shortCondition = ta.crossunder(shortEma, longEma) and close > vwap

// STEP 2:
// Determine stop loss price
longStopPrice  = strategy.position_avg_price * (1 - longLossPerc)
shortStopPrice = strategy.position_avg_price * (1 + shortLossPerc)


if (longCondition)
    strategy.entry("Enter Long", strategy.long)
    strategy.exit("Exit Long",from_entry = "Enter Long",stop= longStopPrice)
plotshape(series=longCondition, title="Long Signal", color=color.green, style=shape.triangleup, location=location.belowbar)


if (shortCondition)
    strategy.entry("Enter Short", strategy.short)
    strategy.exit("Exit Short", from_entry = "Enter Short",stop = shortStopPrice)
plotshape(series=shortCondition, title="Short Signal", color=color.red, style=shape.triangledown, location=location.abovebar)

// Stop loss levels
//longStopLoss = (1 - stopLossPercent) * close
//shortStopLoss = (1 + stopLossPercent) * close

// Exit conditions
//strategy.exit("Long", from_entry="Long", loss=longStopLoss)
//strategy.exit("Short", from_entry="Short", loss=shortStopLoss)

// Plotting indicators on the chart
plot(shortEma, color=color.yellow, title="Short EMA")
plot(longEma, color=color.green, title="Long EMA")
plot(close, color=color.black, title="Close")
plot(vwap, color=color.purple, title="VWAP")

// Plot stop loss values for confirmation
plot(strategy.position_size > 0 ? longStopPrice : na,
     color=color.red, style=plot.style_line,
     linewidth=2, title="Long Stop Loss")

plot(strategy.position_size < 0 ? shortStopPrice : na,
     color=color.blue, style=plot.style_line,
     linewidth=2, title="Short Stop Loss")
// Plotting stop loss lines
//plot(longStopLoss, color=color.red, title="Long Stop Loss", linewidth=2, style=plot.style_line)
//plot(shortStopLoss, color=color.aqua, title="Short Stop Loss", linewidth=2, style=plot.style_line)