Chiến lược đảo ngược đột phá ngắn hạn chéo 5EMA
Bài viết này sẽ giới thiệu một chiến lược giao dịch đảo ngược phá vỡ đường ngắn dựa trên chỉ số 5EMA. Chiến lược này chủ yếu sử dụng chỉ số 5EMA để xác định xu hướng giá và thực hiện giao dịch đảo ngược khi giá phá vỡ EMA.
Tổng quan về chiến lược
Chiến lược này là một chiến lược định lượng đường ngắn, chủ yếu được sử dụng cho giao dịch tần số cao. Chiến lược sẽ đồng thời đánh giá các tín hiệu đầu nhiều và đầu trống, có thể giao dịch hai chiều. Khi giá phá vỡ chỉ số 5EMA, nó tạo ra tín hiệu giao dịch, đi vào lệnh mua hoặc bán tùy theo hướng phá vỡ.
Lợi thế của chiến lược là nắm bắt cơ hội đảo ngược giá ngắn và nhanh chóng vào sân. Rủi ro chủ yếu đến từ tổn thất do phá vỡ giả.
Nguyên tắc chiến lược
Sử dụng chỉ số EMA 5 chu kỳ để xác định xu hướng ngắn hạn của giá
Xác định giá có phá vỡ chỉ số EMA hay không
Khi giá phá vỡ EMA từ trên xuống, nó tạo ra tín hiệu bán
Khi giá vượt qua EMA từ dưới lên, nó tạo ra tín hiệu mua
Thiết lập điểm dừng và dừng để hạn chế tổn thất đơn
Vì chỉ số EMA có khả năng đánh giá hiệu quả các xu hướng ngắn hạn, nó có thể nhanh chóng nắm bắt cơ hội giao dịch khi có sự đảo ngược rõ rệt về giá. Các tham số của 5EMA khá linh hoạt, phản ứng nhanh với thị trường và phù hợp với giao dịch tần số cao.
Lợi thế chiến lược
- Phản ứng nhanh, phù hợp với tần số cao để nắm bắt cơ hội giao dịch ngắn
- Giao dịch hai chiều, bạn có thể làm nhiều nhược điểm cùng một lúc
- Cốp dừng thiệt hại được thiết lập hợp lý, thiệt hại đơn lẻ có giới hạn
- Thiết lập tham số đơn giản, dễ dàng tối ưu hóa chiến lược
Rủi ro chiến lược và giải pháp
- Rủi ro đột phá giả tạo gây ra thiệt hại không cần thiết
- Tối ưu hóa các tham số chu kỳ EMA để đảm bảo chỉ số ổn định
- Tỷ lệ giao dịch quá cao có thể dẫn đến những đợt tăng hay giảm.
- Hạn chế số lần giao dịch tối đa mỗi ngày
Hướng tối ưu hóa chiến lược
- Tối ưu hóa các tham số chỉ số EMA để tìm kết hợp chu kỳ tốt nhất
- Tăng bộ lọc để giảm khả năng phá vỡ giả
- Hạn chế số lần giao dịch tối đa mỗi ngày
- Kết hợp các chỉ số khác để đánh giá xu hướng
Tóm tắt
Chiến lược này nói chung là một chiến lược phá vỡ đường ngắn rất thực tế. Sử dụng chỉ số EMA để xác định giá đảo ngược rất đơn giản và hiệu quả, là một công cụ quan trọng để định lượng giao dịch.
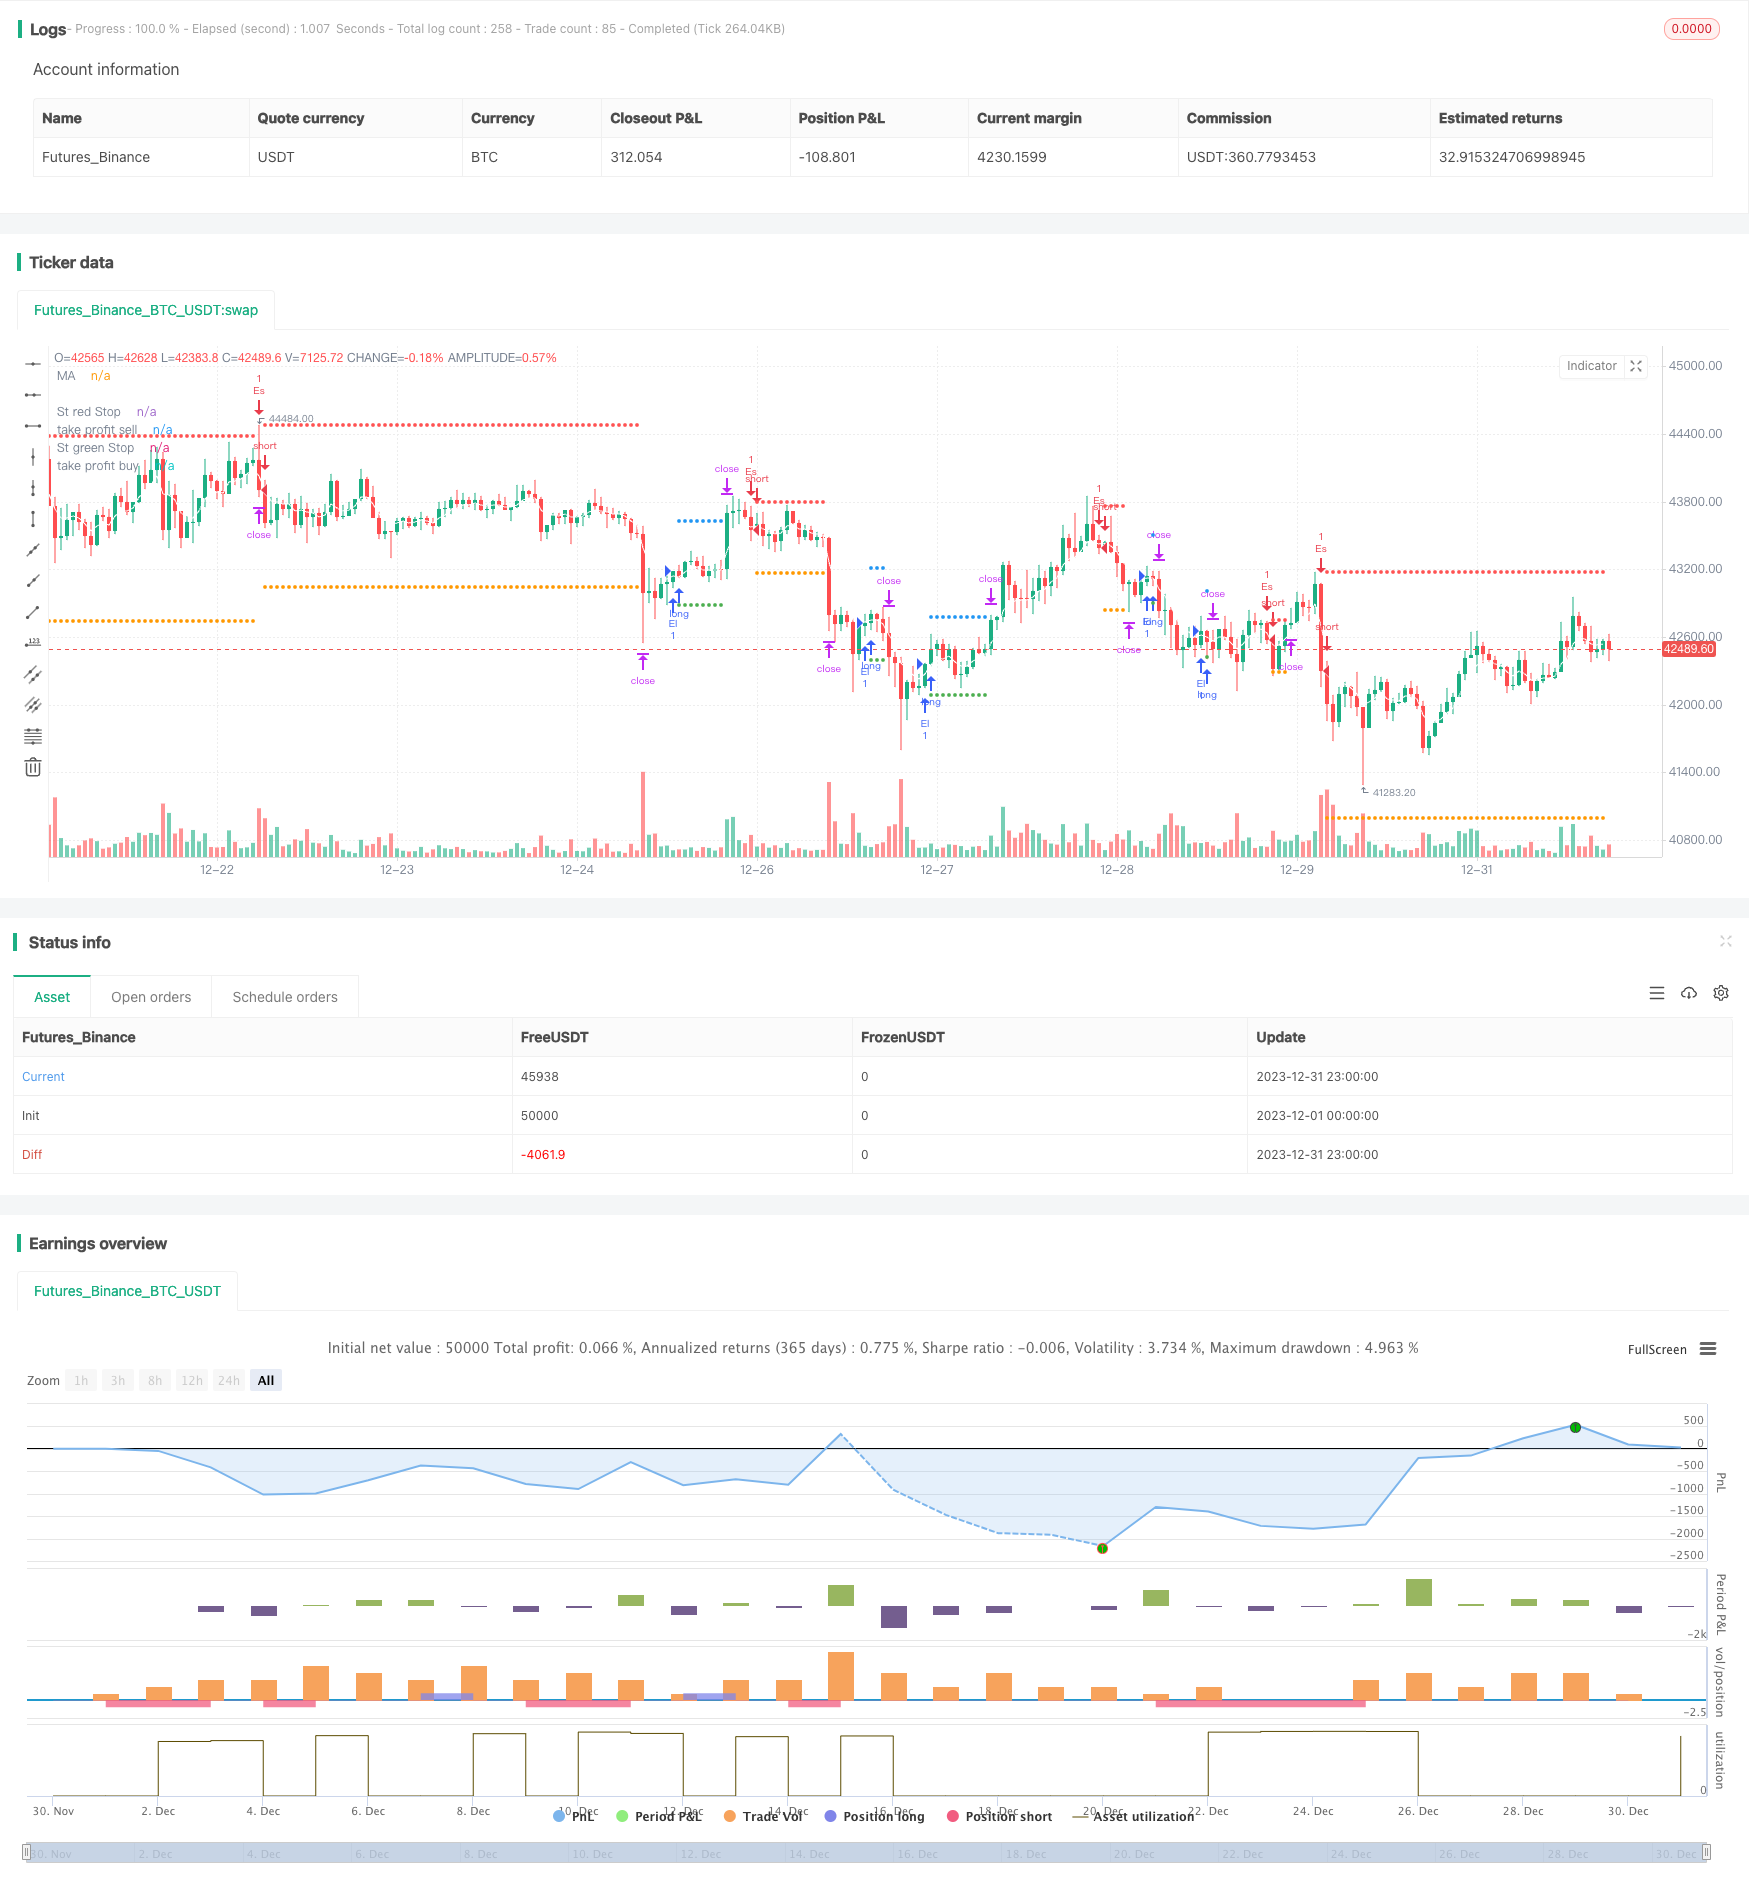
/*backtest
start: 2023-12-01 00:00:00
end: 2023-12-31 23:59:59
period: 1h
basePeriod: 15m
exchanges: [{"eid":"Futures_Binance","currency":"BTC_USDT"}]
*/

// This Pine Script™ code is subject to the terms of the Mozilla Public License 2.0 at https://mozilla.org/MPL/2.0/
// © samscripter

//@version=5
strategy("5 ema strategy",overlay = true,process_orders_on_close = true)

// Choose trade direction

t_dir = input.string("Both", title="Trade Direction",options=["Long", "Short", "Both"],group = 'Trade Direction Set')

long_side  = t_dir == "Long" or t_dir == "Both"
short_side = t_dir == "Short" or t_dir == "Both"

// number of trade
mx_num =input.int(4,title = 'number Of trade',group = 'Maximum Number Of Trade')
var hi =0.0
var lo =0.0

var group_ma1="Ema Set"

//Ema 1
on_ma=input.bool(true,"Enable EMa 1 Plot On/Off"  ,group =group_ma1)
ma_len= input.int(5, minval=1, title="Ema Length",group =group_ma1)
ma_src = input.source(close, title="Ema Source"   ,group = group_ma1)
ma_out = ta.ema(ma_src, ma_len)

// buy and sell ema condition
plot(on_ma?ma_out:na, color=color.white, title="MA")


if close>ma_out and open>ma_out and low>ma_out and high>ma_out
    lo:=low

if close<ma_out and open<ma_out and low<ma_out and high<ma_out
    hi:=high

// condition when price is crossunder lo take sell and when price crossoing hi take buy
var buyp_sl =float(na)
var sellp_sl =float(na)

//count number trade since day stra
var count_buysell=0

if  close>hi[1]
    if strategy.position_size==0 and count_buysell<mx_num and long_side
        strategy.entry('El',strategy.long,comment = 'Long')
        count_buysell:=count_buysell+1
        buyp_sl:=math.min(low,low[1])
    hi:=na
if  close<lo[1]
    if strategy.position_size==0 and count_buysell<mx_num and short_side
        strategy.entry('Es',strategy.short,comment = 'short')
        count_buysell:=count_buysell+1
        sellp_sl:=math.max(high,high[1])
    lo:=na

//take profit multiply

tpnew = input.float(title="take profit", step=0.1, defval=1.5, group='Tp/SL')


//stop loss previous candle high and previous candle low
buy_sl = ta.valuewhen(strategy.position_size != 0 and strategy.position_size[1] == 0,buyp_sl , 0)
sell_sl= ta.valuewhen(strategy.position_size != 0 and strategy.position_size[1] == 0,sellp_sl, 0)

//take profit
takeProfit_buy = strategy.position_avg_price - ((buy_sl - strategy.position_avg_price) *tpnew)
takeProfit_sell = strategy.position_avg_price - ((sell_sl - strategy.position_avg_price) *tpnew)


//  Submit exit orders
if strategy.position_size > 0
    strategy.exit(id='XL', stop=buy_sl,limit=takeProfit_buy,comment_loss = 'Long Sl',comment_profit = 'Long Tp')

if strategy.position_size < 0
    strategy.exit(id='XS', stop=sell_sl,limit=takeProfit_sell,comment_loss = 'Short Sl',comment_profit = 'Short Tp')

//plot data
plot(series=strategy.position_size < 0 ?sell_sl : na, style=plot.style_circles, color=color.red, linewidth=2, title="St red Stop")
plot(series=strategy.position_size > 0 ?buy_sl  : na, style=plot.style_circles, color=color.green, linewidth=2, title="St green Stop")


// plot take profit
plot(series=strategy.position_size < 0 ? takeProfit_sell : na, style=plot.style_circles, color=color.orange, linewidth=2, title="take profit sell")
plot(series=strategy.position_size > 0 ? takeProfit_buy: na, style=plot.style_circles, color=color.blue, linewidth=2, title="take profit buy")

if ta.change(time('D'))
    count_buysell:=0