Chiến lược lý thuyết đường trung bình động kép
Tổng quan
Chiến lược quan điểm hai đường trung bình là một chiến lược theo dõi xu hướng. Nó xây dựng nhóm đường nhanh và nhóm đường chậm bằng cách tính toán hai nhóm trung bình di chuyển và kết hợp mối quan hệ của giá với đường trung bình để đánh giá xu hướng.
Khi đường nhanh đi qua đường chậm, hãy nhìn nhiều tín hiệu. Khi đường nhanh đi qua đường chậm, hãy nhìn không. Chiến lược này kết hợp các điều kiện như hướng của đường trung bình nhanh và chậm, số lượng nến phá vỡ giá để xác định thời gian vào và ra cụ thể.
Nguyên tắc chiến lược
Chiến lược dư luận hai đường bằng nhau được định nghĩa bằng cách tính toán hai nhóm trung bình di chuyển, đại diện cho tiêu chuẩn đánh giá xu hướng ngắn hạn và dài hạn. Cụ thể, chiến lược này xác định:
- Nhóm đường trung bình nhanh, bao gồm đường trung bình nhanh xuống và đường trung bình nhanh lên, đại diện cho xu hướng ngắn hạn;
- Nhóm đường trung bình chậm, bao gồm đường trung bình chậm và đường trung bình chậm, đại diện cho xu hướng dài hạn.
Chiến lược đánh giá tính hợp lý của xu hướng ngắn hạn và dài hạn, và thời gian vào và ra cụ thể thông qua mối quan hệ giá của nhóm trung bình nhanh và nhóm trung bình chậm.
Điều kiện nhập họcNhư sau:
- Đường lên đường nhanh vượt lên đường lên đường chậm 2 đường K hoặc nhiều hơn.
- Đường xuống đường nhanh sẽ bị phá vỡ xuống đường xuống đường chậm 2 đường K hoặc nhiều hơn.
Điều kiện thi đấuNhư sau:
- Trong thời gian giữ nhiều vị trí, nhiều người tham gia khi đi qua đường trung bình nhanh dưới đường trung bình chậm.
- Trong thời gian giữ vị trí không đầu, chơi không đầu khi đi qua đường trung bình nhanh và đường trung bình chậm.
Ngoài ra, chiến lược cũng có các tính năng như Stop Loss, Stop Loss và Trace Loss để kiểm soát rủi ro.
Phân tích lợi thế
Những lợi thế chính của chiến lược bình đẳng quan điểm là:
- Với sự phân tích hai đường ngang nhau, nó có thể lọc tiếng ồn thị trường một cách hiệu quả và khóa hướng xu hướng.
- Kết hợp với đường trung bình chậm và giá, tín hiệu được đánh giá là đáng tin cậy hơn.
- Các quy tắc chiến lược đơn giản, rõ ràng, dễ hiểu và phù hợp với giao dịch định lượng.
- Các phương tiện kiểm soát rủi ro như dừng, dừng lỗ và theo dõi lỗ có thể kiểm soát rủi ro giao dịch hiệu quả.
Phân tích rủi ro
Chiến lược này cũng có một số rủi ro, đặc biệt là:
- Trong một tình huống chấn động, nó có thể tạo ra tín hiệu giả, dẫn đến giao dịch không cần thiết.
- Hệ thống đường trung bình phản ứng chậm với các sự kiện bất ngờ (ví dụ như lỗ lợi nhuận lớn / thông tin lợi nhuận) có thể dẫn đến tổn thất lớn.
- Theo dõi dừng lỗ có thể bị phá vỡ trong một số trường hợp nhất định, do đó làm tăng tổn thất.
Để kiểm soát các rủi ro trên, có thể cải thiện bằng các phương pháp như tối ưu hóa tham số đường trung bình di chuyển hoặc lọc kết hợp với các chỉ số khác.
Hướng tối ưu hóa
Chiến lược quan điểm hai chiều có thể được tối ưu hóa từ các khía cạnh sau:
- Tối ưu hóa các tham số trung bình di chuyển, điều chỉnh chu kỳ đường trung bình để thích ứng với các tình huống chu kỳ khác nhau.
- Thêm các chỉ số khác Filter, hình thành chiến lược kết hợp nhiều chỉ số, tăng độ chính xác của tín hiệu.
- Tối ưu hóa các thiết lập dừng lỗ, dừng lỗ, thiết lập các giá trị giới hạn thu hồi, kiểm soát tổn thất tối đa.
- Tiến hành mô hình học máy để dự đoán xu hướng, hỗ trợ việc xác định thời gian nhập học.
Tóm tắt
Chiến lược quan điểm hai chiều là một chiến lược theo dõi xu hướng rất thực tế. Quy tắc phán đoán của nó đơn giản, logic rõ ràng, kiểm soát rủi ro thông qua hệ thống hai chiều, cơ sở lý thuyết vững chắc. Bước tiếp theo có thể được cải thiện từ nhiều khía cạnh như tối ưu hóa tham số, kiểm soát rủi ro, để tăng thêm lợi nhuận và ổn định của chiến lược.
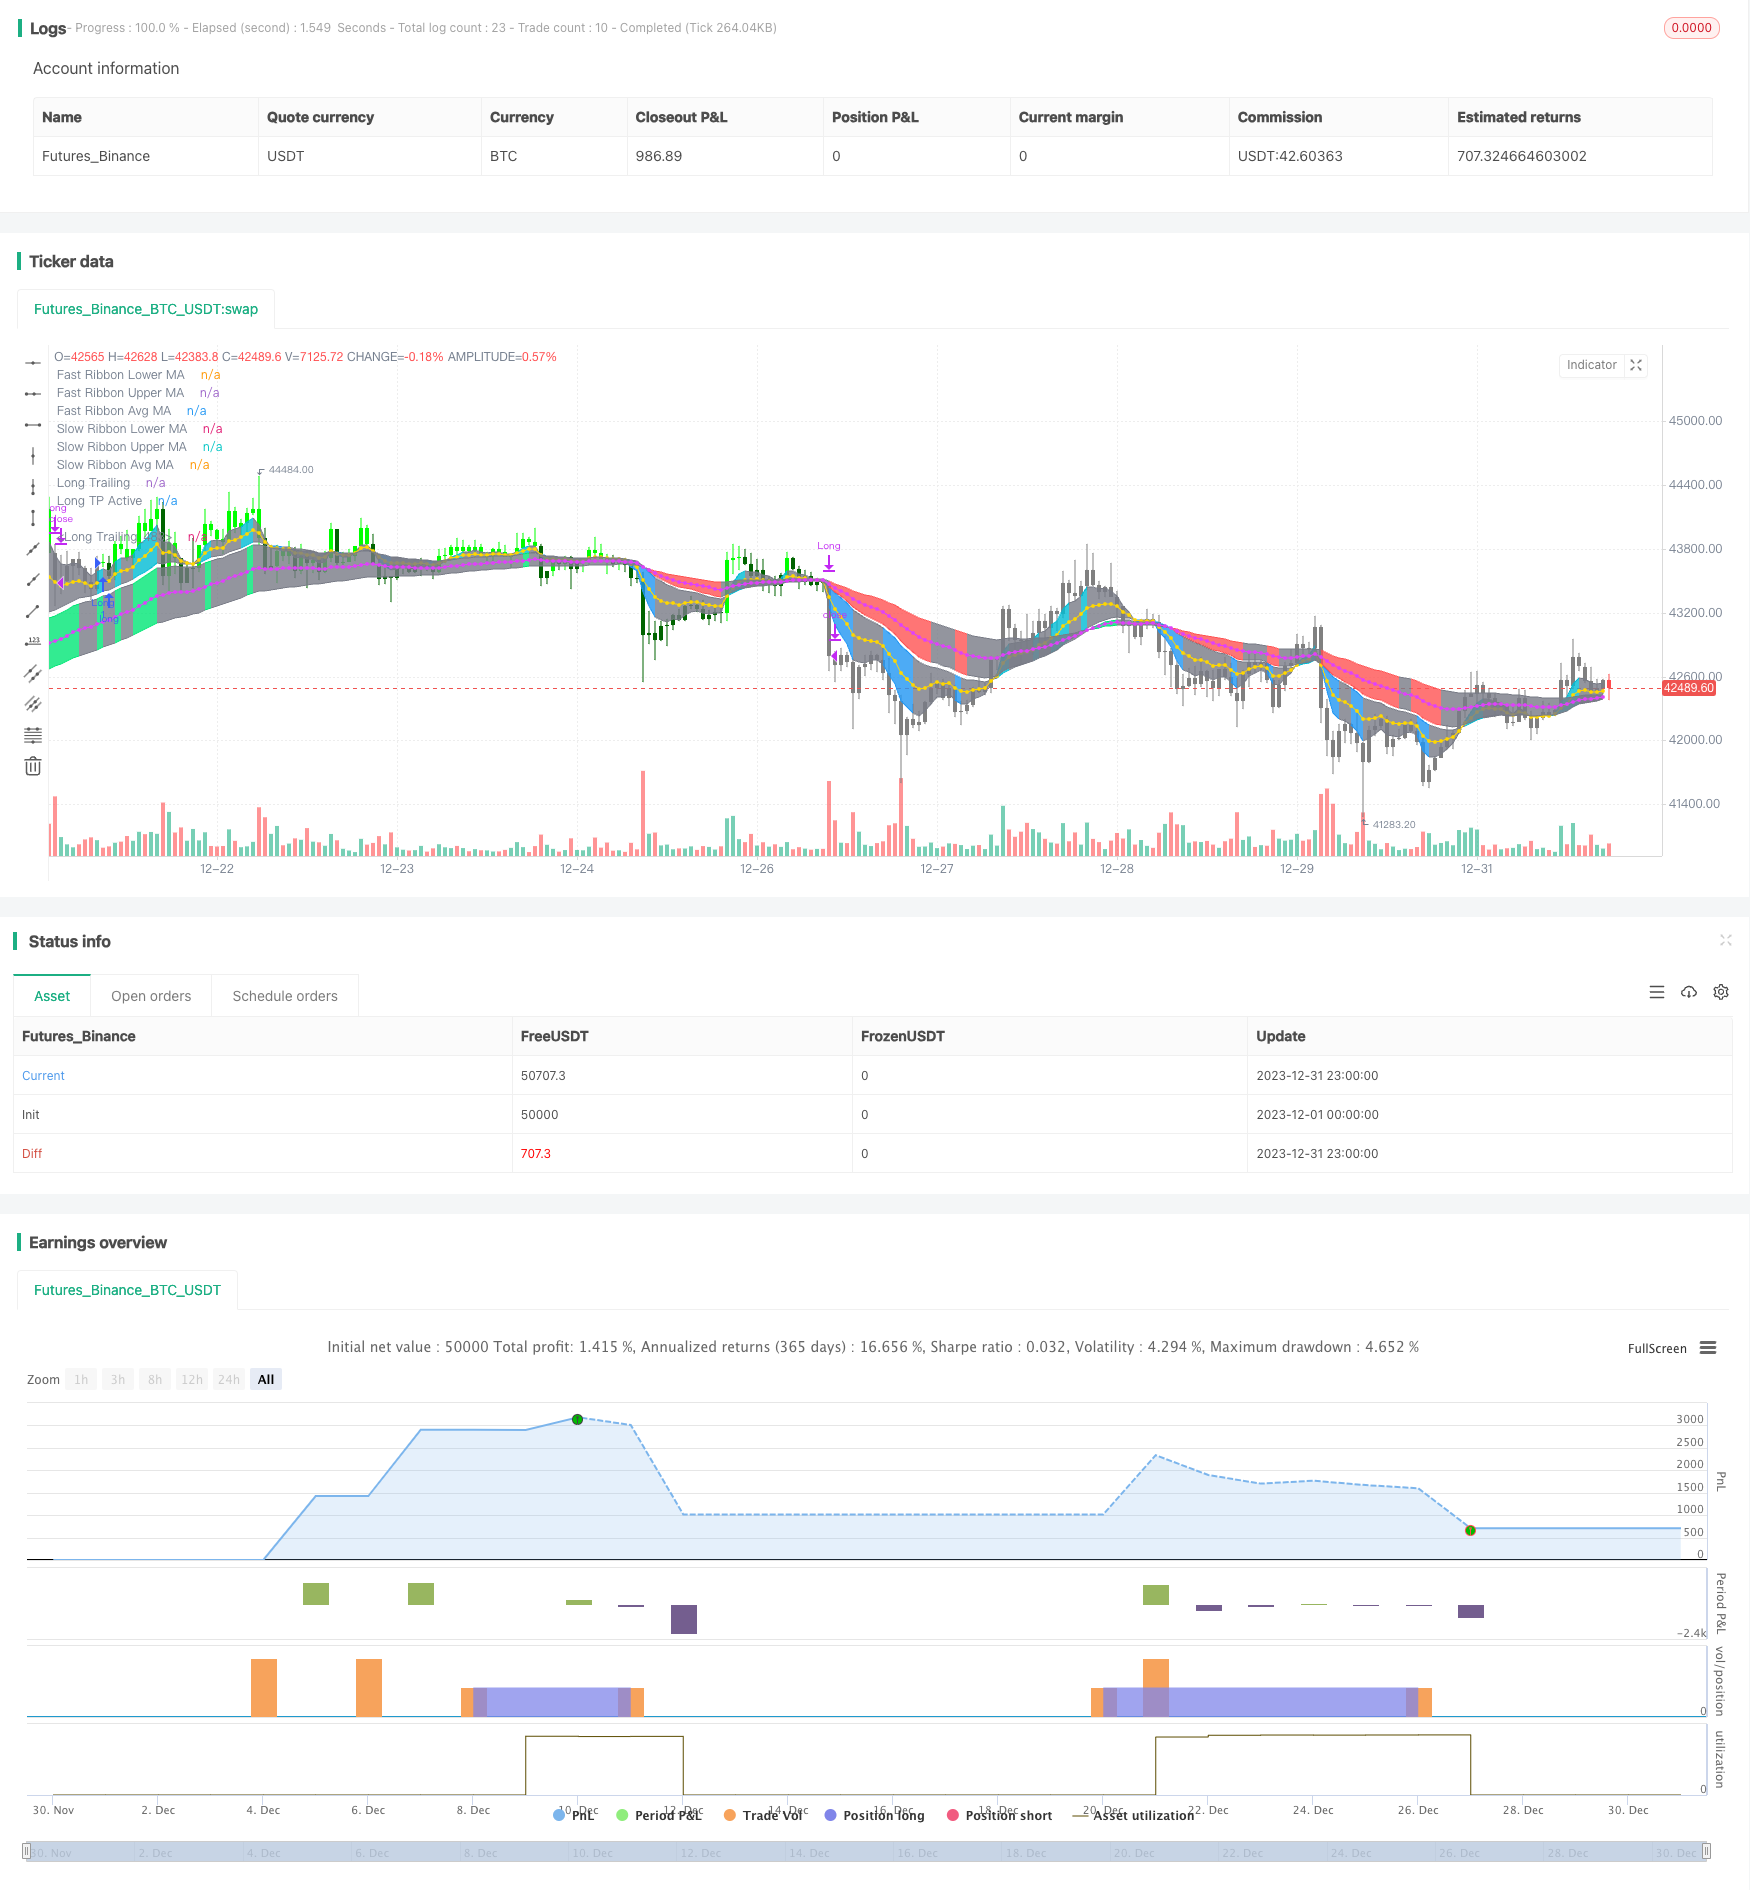
/*backtest
start: 2023-12-01 00:00:00
end: 2023-12-31 23:59:59
period: 1h
basePeriod: 15m
exchanges: [{"eid":"Futures_Binance","currency":"BTC_USDT"}]
*/

//@version=3

strategy(title="[Autoview][BackTest]Dual MA Ribbons R0.12 by JustUncleL", shorttitle="[BT]DualRibbons R0.12", overlay=true )

//study(title="[Autoview][Alerts]Dual MA Ribbons R0.12 by JustUncleL", shorttitle="[AL]DualRibbons R0.12", overlay=true)

//
//  Author:   JustUncleL
//  Revision: R0.12 Beta
//  Date:     30-Apr-2018
//
//  Description:
//  ============
//  This is an implementaion of a strategy based on two MA Ribbonn, a Fast Ribbon
//  and a Slow Ribbon.
//  The strategy revolves around a pair of scripts: One to generate alerts signals for
//  Autoview and one for Backtesting, to tune your settings.
//  The risk management options are performed within the script to set SL(StopLoss),
//  TP(TargetProfit), TSL(Trailing Stop Loss) and TTP (Trailing Target Profit).
//  The only requirement for Autoview is to Buy and Sell as directed by this script,
//  no complicated syntax is required.
//
//  The Dual Ribbons are designed to capture the inferred behaviour of traders and
//  investors by using two groups of averages:
//  > Traders MA Ribbon:
//    Lower MA and Upper MA  (Aqua=Uptrend, Blue=downtrend, Gray=Neutral), with
//    centre line Avg MA (Orange dotted line).
//  > Investors MAs Ribbon:
//    Lower MA and Upper MA  (Green=Uptrend, Red=downtrend, Gray=Neutral), with
//    centre line Avg MA (Fuchsia dotted line).
//  > Anchor time frame (0=current). This is the time frame that the MAs are
//    calculated for. This way 60m MA Ribbons can be viewed on a 15 min chart to establish
//    tighter Stop Loss conditions.
//
//   Trade Management options:
//   -------------------------
//   - Option to specify Backtest start and end time.
//   - Trailing Stop, with Activate Level (as % of price) and Trailing Stop (as % of price)
//   - Target Profit Level, (as % of price)
//   - Stop Loss Level, (as % of price)
//   - BUY green triandles and SELL dark red triangles
//   - Trade Order closed colour coded Label:
//       > Dark Red = Stop Loss Hit
//       > Green  = Target Profit Hit
//       > Purple = Trailing Stop Hit
//       > Orange = Opposite (Sell) Order Close
//
//   Trade Management Indication:
//   ----------------------------
//   - Trailing Stop Activate Price = Blue dotted line
//   - Trailing Stop Price =  Fuschia solid stepping line
//   - Target Profit Price = Lime '+' line
//   - Stop Loss Price = Red '+' line
//
//   Dealing With Renko Charts:
//   --------------------------
//   - If you choose to use Renko charts, make sure you have enabled the "IS This a RENKO Chart"
//     option, (I have not so far found a way to Detect the type of chart that is running).
//   - If you want non-repainting Renko charts you MUST use TRADITIONAL Renko Bricks. This
//     type of brick is fixed and will not change size.
//   - Also use Renko bricks with WICKS DISABLED. Wicks are not part of Renko, the whole
//     idea of using Renko bricks is not to see the wick noise.
//   - Set you chart Time Frame to the lowest possible one that will build enough bricks
//     to give a reasonable history, start at 1min TimeFrame. Renko bricks are not dependent
//     on time, they represent a movement in price. But the chart candlestick data is used
//     to create the bricks, so lower TF gives more accurate Brick creation.
//   - You want to size your bricks to 2/1000 of the pair price, so for ETHBTC the price is say 0.0805
//     then your Renko Brick size should be about 2*0.0805/1000 = 0.0002 (round up).
//   - You may find there is some slippage in value, but this can be accounted for in the Backtes
//     by setting your commission a bit higher, for Binance for example I use 0.2
//
//  References:
//  ===========
//  - MA Ribbon R#.# by JustUncleL
//  - "How to automate this strategy for free using a chrome extension" by CryptoRox
//
//  Revisions:
//  ==========
//  R0.12   - Beta 2 Version
//
//
//
// -----------------------------------------------------------------------------
// Copyright 2018 JustUncleL
//
// This program is free software: you can redistribute it and/or modify
// it under the terms of the GNU General Public License as published by
// the Free Software Foundation, either version 3 of the License, or
// any later version.
//
// This program is distributed in the hope that it will be useful,
// but WITHOUT ANY WARRANTY; without even the implied warranty of
// MERCHANTABILITY or FITNESS FOR A PARTICULAR PURPOSE.  See the
// GNU General Public License for more details.
//
// The GNU General Public License can be found here
// <http://www.gnu.org/licenses/>.
//
// -----------------------------------------------------------------------------
//


//
// Use Alternate Anchor TF for MAs
uRenko    = input(true, title="IS This a RENKO Chart")
//
anchor     = input(0,minval=0,maxval=1440,title="Alternate TimeFrame Multiplier (0=none)")
//
src          = close //input(close, title="EMA Source")
showRibbons  = input(true,title="Show Coloured MA Ribbons")
showAvgs     = input(true,title="Show Ribbon Median MA Lines")

//
// Fast Ribbon MAs
// Lower MA - type, length
typeF1    = input(defval="EMA", title="FAST MA Ribbon Type: ", options=["SMA", "EMA", "WMA", "VWMA", "SMMA", "DEMA", "TEMA", "LAGMA", "HullMA", "ZEMA", "TMA", "SSMA"])
lenF1     = input(defval=5, title="FAST Ribbon Lower MA Length", minval=1)
gammaF1   = 0.33 //input(defval=0.33,title="Fast MA - Gamma for LAGMA")

// Upper MA - type, length
typeF11   = typeF1 //input(defval="WMA", title="FAST Ribbon Upper MA Type: ", options=["SMA", "EMA", "WMA", "VWMA", "SMMA", "DEMA", "TEMA", "LAGMA", "HullMA", "ZEMA", "TMA", "SSMA"])
lenF11    = input(defval=25, title="FAST Ribbon Upper Length", minval=2)
gammaF11  = 0.77 //input(defval=0.77,title="Slow MA - Gamma for LAGMA")

// Slow Ribbon MAs
// Lower MA - type, length
typeS1   = input(defval="EMA", title="SLOW MA Ribbon Type: ", options=["SMA", "EMA", "WMA", "VWMA", "SMMA", "DEMA", "TEMA", "LAGMA", "HullMA", "ZEMA", "TMA", "SSMA"])
lenS1    = input(defval=28, title="SLOW Ribbon Lower MA Length", minval=1)
gammaS1  = 0.33 //input(defval=0.33,title="Fast MA - Gamma for LAGMA")

// Upper MA - type, length
typeS16   = typeS1 //input(defval="WMA", title="SLOW Ribbon Upper MA Type: ", options=["SMA", "EMA", "WMA", "VWMA", "SMMA", "DEMA", "TEMA", "LAGMA", "HullMA", "ZEMA", "TMA", "SSMA"])
lenS16    = input(defval=72, title="SLOW Ribbon Upper Length", minval=2)
gammaS16  = 0.77 //input(defval=0.77,title="Slow MA - Gamma for LAGMA")

// - Constants
gold = #FFD700

// - FUNCTIONS

// - variant(type, src, len, gamma)
// Returns MA input selection variant, default to SMA if blank or typo.

// SuperSmoother filter
// © 2013  John F. Ehlers
variant_supersmoother(src,len) =>
    a1 = exp(-1.414*3.14159 / len)
    b1 = 2*a1*cos(1.414*3.14159 / len)
    c2 = b1
    c3 = (-a1)*a1
    c1 = 1 - c2 - c3
    v9 = 0.0
    v9 := c1*(src + nz(src[1])) / 2 + c2*nz(v9[1]) + c3*nz(v9[2])
    v9

variant_smoothed(src,len) =>
    v5 = 0.0
    v5 := na(v5[1]) ? sma(src, len) : (v5[1] * (len - 1) + src) / len
    v5

variant_zerolagema(src,len) =>
    ema1 = ema(src, len)
    ema2 = ema(ema1, len)
    v10 = ema1+(ema1-ema2)
    v10

variant_doubleema(src,len) =>
    v2 = ema(src, len)
    v6 = 2 * v2 - ema(v2, len)
    v6

variant_tripleema(src,len) =>
    v2 = ema(src, len)
    v7 = 3 * (v2 - ema(v2, len)) + ema(ema(v2, len), len)               // Triple Exponential
    v7

//calc Laguerre
variant_lag(p,g) =>
    L0 = 0.0
    L1 = 0.0
    L2 = 0.0
    L3 = 0.0
    L0 := (1 - g)*p+g*nz(L0[1])
    L1 := -g*L0+nz(L0[1])+g*nz(L1[1])
    L2 := -g*L1+nz(L1[1])+g*nz(L2[1])
    L3 := -g*L2+nz(L2[1])+g*nz(L3[1])
    f = (L0 + 2*L1 + 2*L2 + L3)/6
    f

// return variant, defaults to SMA
variant(type, src, len, g) =>
    type=="EMA"     ? ema(src,len) :
      type=="WMA"   ? wma(src,len):
      type=="VWMA"  ? vwma(src,len) :
      type=="SMMA"  ? variant_smoothed(src,len) :
      type=="DEMA"  ? variant_doubleema(src,len):
      type=="TEMA"  ? variant_tripleema(src,len):
      type=="LAGMA" ? variant_lag(src,g) :
      type=="HullMA"? wma(2 * wma(src, len / 2) - wma(src, len), round(sqrt(len))) :
      type=="SSMA"  ? variant_supersmoother(src,len) :
      type=="ZEMA"  ? variant_zerolagema(src,len) :
      type=="TMA"   ? sma(sma(src,len),len) :
                      sma(src,len)

// - /variant

// If have anchor specified, calculate the base multiplier.
//mult  = isintraday ? anchor==0 or interval<=0 or interval>=anchor or anchor>1440? 1 : round(anchor/interval) : 1
//mult := isdwm?  1 : mult  // Only available Daily or less
mult = anchor>0 ? anchor : 1

//
high_  = uRenko? max(close,open) : high
low_   = uRenko? min(close,open) : low


//adjust MA lengths with Anchor Multiplier

//Fast MA Ribbon
emaF1 = variant(typeF1, src, lenF1*mult, gammaF1)
emaF11 = variant(typeF11, src, lenF11*mult,gammaF11)
emafast = (emaF1+emaF11)/2 // Average of Upper and Lower MAs
//
//Slow MA Ribbon
emaS1 = variant(typeS1,src, lenS1*mult,gammaS1)
emaS16 = variant(typeS16, src, lenS16*mult, gammaS16)
emaslow = (emaS1+emaS16)/2 // Average of Upper and Lower MAs
//
// Count crossover candles
xup = 0
xdn = 0
fup = 0
fdn = 0
sup = 0
sdn = 0
//
xup := (emafast-emaslow)>0 and (emafast-emaslow)>(emafast[1]-emaslow[1]) ? nz(xup[1])+1 : 0
xdn := (emafast-emaslow)<0 and (emafast-emaslow)<(emafast[1]-emaslow[1]) ? nz(xdn[1])+1 : 0
fup := (emaF1-emaF11)>0 and (emaF1-emaF11)>(emaF1[1]-emaF11[1]) ? nz(fup[1])+1 : 0
fdn := (emaF1-emaF11)<0 and (emaF1-emaF11)<(emaF1[1]-emaF11[1]) ? nz(fdn[1])+1 : 0
sup := (emaS1-emaS16)>0 and (emaS1-emaS16)>(emaS1[1]-emaS16[1]) ? nz(sup[1])+1 : 0
sdn := (emaS1-emaS16)<0 and (emaS1-emaS16)<(emaS1[1]-emaS16[1]) ? nz(sdn[1])+1 : 0

//Fast EMA Final Color Rules
colFinal = fup>=2 ? aqua : fdn>=2 ? blue : gray
//Slow EMA Final Color Rules
colFinal2 = sup>=2 ? lime : sdn>=2 ? red : gray

//Fast EMA Plots
p1=plot(showRibbons?emaF1:na, title="Fast Ribbon Lower MA", style=line, linewidth=1, color=colFinal,transp=10)
p2=plot(showRibbons?emaF11:na, title="Fast Ribbon Upper MA", style=line, linewidth=1, color=colFinal,transp=10)
plot(showAvgs?emafast:na, title="Fast Ribbon Avg MA", style=circles,join=true, linewidth=1, color=gold,transp=10)

//
fill(p1,p2,color=colFinal, transp=90)

//Slow EMA Plots
p3=plot(showRibbons?emaS1:na, title="Slow Ribbon Lower MA", style=line, linewidth=1, color=colFinal2,transp=10)
p4=plot(showRibbons?emaS16:na, title="Slow Ribbon Upper MA", style=line, linewidth=1, color=colFinal2,transp=10)
plot(showAvgs?emaslow:na, title="Slow Ribbon Avg MA", style=circles,join=true, linewidth=1, color=fuchsia,transp=10)
//
fill(p3,p4, color=colFinal2, transp=90)

// Generate Buy Sell signals,
buy = 0
sell=0
//
buy  := xup>=2 and sup>=2 and fup>=2 ? nz(buy[1])>0?buy[1]+1:1 : 0
sell := xdn>=2 and sdn>=2 and fdn>=2 ? nz(sell[1])>0?sell[1]+1 :1 : 0
//

//////////////////////////////////////////////////
//* Put Entry and special Exit conditions here *//
//////////////////////////////////////////////////
//////////////////////////////////////////////////////////////////////////////////////////
//*** This Trade Management Section of code is a modified version of that found in   ***//
//*** "How to automate this strategy for free using a chrome extension" by CryptoRox ***//
//*** Modifications made by JustUncleL.                                              ***//
//////////////////////////////////////////////////////////////////////////////////////////
//


///////////////////////////////////////////////
//* Backtesting Period Selector | Component *//
///////////////////////////////////////////////

//* https://www.tradingview.com/script/eCC1cvxQ-Backtesting-Period-Selector-Component *//
//* https://www.tradingview.com/u/pbergden/ *//
//* Modifications made by JustUncleL*//

testStartYear = input(2018, "Backtest Start Year",minval=1980)
testStartMonth = input(1, "Backtest Start Month",minval=1,maxval=12)
testStartDay = input(1, "Backtest Start Day",minval=1,maxval=31)
testPeriodStart = timestamp(testStartYear,testStartMonth,testStartDay,0,0)

testStopYear = 9999 //input(9999, "Backtest Stop Year",minval=1980)
testStopMonth = 12 // input(12, "Backtest Stop Month",minval=1,maxval=12)
testStopDay = 31 //input(31, "Backtest Stop Day",minval=1,maxval=31)
testPeriodStop = timestamp(testStopYear,testStopMonth,testStopDay,0,0)

testPeriod() => true

///////////////////////////////////////////////
//* Place Entry and Special Exit Logic here *//
///////////////////////////////////////////////

AQUA = #00FFFFFF
BLUE = #0000FFFF
RED  = #FF0000FF
LIME = #00FF00FF
GRAY = #808080FF
DARKRED   = #8B0000FF
DARKGREEN = #006400FF

// Keep current state until opposite signal detected.
bsState = 0, bsState := nz(bsState[1])
bsState := buy==1 and bsState<=0? 1 :
           sell==1 and bsState>=0? -1 :
           bsState

//Entry Conditions, when state changes direction.
longLogic  = change(bsState) and bsState==1  and (barstate.isconfirmed or barstate.ishistory)
shortLogic = change(bsState) and bsState==-1  and (barstate.isconfirmed or barstate.ishistory)

// Exit on Sell signal
longExitC = 0
shortExitC = 0
longExitC   := (emafast<emaslow and close<emaslow)
                  and (barstate.isconfirmed or barstate.ishistory) ? nz(longExitC[1])+1 : 0
shortExitC  := (emafast>emaslow and close>emaslow)
                  and (barstate.isconfirmed or barstate.ishistory) ? nz(shortExitC[1])+1 : 0

// Exit condition for no SL.
longExit = change(longExitC) and longExitC==1
shortExit = change(shortExitC) and shortExitC==1


//////////////////////////
//* Strategy Component *//
//////////////////////////

fastExit  = input(false,title="Use Opposite Trade as a Close Signal")
clrBars   = input(true,title="Colour Candles to Trade Order state")

orderType = input("LongsOnly",title="What type of Orders", options=["Longs+Shorts","LongsOnly","ShortsOnly","Flip"])

//
isLong   = (orderType != "ShortsOnly")
isShort  = (orderType != "LongsOnly")
//
long = longLogic
short = shortLogic

if orderType=="Flip"
    long := shortLogic
    short := longLogic


////////////////////////////////
//======[ Signal Count ]======//
////////////////////////////////

sectionLongs = 0
sectionLongs := nz(sectionLongs[1])
sectionShorts = 0
sectionShorts := nz(sectionShorts[1])

if long and isLong
    sectionLongs := sectionLongs + 1
    sectionShorts := 0

if short and isShort
    sectionLongs := 0
    sectionShorts := sectionShorts + 1

longCondition  = (long and isLong)
shortCondition = (short and isShort)

////////////////////////////////
//======[ Entry Prices ]======//
////////////////////////////////

last_open_longCondition = na
last_open_shortCondition = na
last_open_longCondition := longCondition ? close : nz(last_open_longCondition[1])
last_open_shortCondition := shortCondition ? close : nz(last_open_shortCondition[1])

///////////////////////////////////////////////
//======[ Position Check (long/short) ]======//
///////////////////////////////////////////////

last_longCondition = na
last_shortCondition = na
last_longCondition  := longCondition ? time : nz(last_longCondition[1])
last_shortCondition := shortCondition ? time : nz(last_shortCondition[1])

in_longCondition  = last_longCondition > last_shortCondition
in_shortCondition = last_shortCondition > last_longCondition

/////////////////////////////////
//======[ Trailing Stop ]======//
/////////////////////////////////

isTS = input(true, "Trailing Stop")
ts = input(3.0, "Trailing Stop (%)", minval=0,step=0.1, type=float) /100

last_high = na
last_low = na
last_high_short = na
last_low_long = na
last_high := not in_longCondition ? na : in_longCondition and (na(last_high[1]) or high_ > nz(last_high[1])) ? high_ : nz(last_high[1])
last_high_short := not in_shortCondition ? na : in_shortCondition and (na(last_high[1]) or high_ > nz(last_high[1])) ? high_ : nz(last_high[1])
last_low := not in_shortCondition ? na : in_shortCondition and (na(last_low[1]) or low_ < nz(last_low[1])) ? low_ : nz(last_low[1])
last_low_long := not in_longCondition ? na : in_longCondition and (na(last_low[1]) or low_ < nz(last_low[1])) ? low_ : nz(last_low[1])

long_ts = isTS and not na(last_high) and (low_ <= last_high - last_high * ts) //and (last_high >= last_open_longCondition + last_open_longCondition * tsi)
short_ts = isTS and not na(last_low) and (high_ >= last_low + last_low * ts) //and (last_low <= last_open_shortCondition - last_open_shortCondition * tsi)


///////////////////////////////
//======[ Take Profit ]======//
///////////////////////////////

isTP = input(true, "Take Profit")
tp = input(3.0, "Take Profit (%)",minval=0,step=0.1,type=float) / 100
ttp = input(1.0, "Trailing Profit (%)",minval=0,step=0.1,type=float) / 100
ttp := ttp>tp ? tp : ttp

long_tp = isTP and (last_high >= last_open_longCondition + last_open_longCondition * tp)   and (low_ <= last_high - last_high * ttp)
short_tp = isTP and (last_low <= last_open_shortCondition - last_open_shortCondition * tp) and (high_ >= last_low + last_low * ttp)

/////////////////////////////
//======[ Stop Loss ]======//
/////////////////////////////

isSL = input(false, "Stop Loss")
sl = input(3.0, "Stop Loss (%)", minval=0,step=0.1, type=float) / 100
long_sl = isSL and (low_ <= last_open_longCondition - last_open_longCondition * sl)
short_sl = isSL and (high_ >= last_open_shortCondition + last_open_shortCondition * sl)

////////////////////////////////////
//======[ Stop on Opposite ]======//
////////////////////////////////////

//NOTE Short exit signal is non-repainting, no need to force it, if Pyramiding keep going
long_sos = (fastExit or (not isTS and not isSL)) and longExit
short_sos = (fastExit or (not isTS and not isSL)) and shortExit

/////////////////////////////////
//======[ Close Signals ]======//
/////////////////////////////////

// Create a single close for all the different closing conditions, all conditions here are non-repainting
longClose = isLong and (long_tp or long_sl or long_ts or long_sos) and not longCondition
shortClose = isShort and (short_tp or short_sl or short_ts or short_sos) and not shortCondition

in_closeLong = longClose
in_closeLong := not isLong? false : longClose ? true : longCondition? false : in_closeLong[1]
in_closeShort = shortClose
in_closeShort := not isShort? false : shortClose ? true : shortCondition? false : in_closeShort[1]

///////////////////////////////
//======[ Plot Colors ]======//
///////////////////////////////

longCloseCol = na
shortCloseCol = na
longCloseCol := long_tp ? green : long_sl ? maroon : long_ts ? purple : long_sos ? orange :longCloseCol[1]
shortCloseCol := short_tp ? green : short_sl ? maroon : short_ts ? purple : short_sos ? orange : shortCloseCol[1]
//
tpColor = isTP and in_longCondition ? lime : isTP and in_shortCondition ? lime : na
slColor = isSL and in_longCondition ? red : isSL and in_shortCondition ? red : na


//////////////////////////////////
//======[ Strategy Plots ]======//
//////////////////////////////////

plot(isTS and in_longCondition and isLong and not in_closeLong?
     last_high - last_high * ts : na, "Long Trailing", fuchsia, style=2, linewidth=2,offset=1)
plot(isTP and in_longCondition and isLong and not in_closeLong and last_high < last_open_longCondition + last_open_longCondition * tp ?
     last_open_longCondition + last_open_longCondition * tp : na, "Long TP Active", tpColor, style=3,join=false, linewidth=2,offset=1)
plot(isTP and in_longCondition and isLong and not in_closeLong and last_high >= last_open_longCondition +  last_open_longCondition * tp ?
     last_high - last_high * ttp : na, "Long Trailing", black, style=2, linewidth=2,offset=1)
plot(isSL and in_longCondition and isLong and not in_closeLong and last_low_long > last_open_longCondition - last_open_longCondition * sl ?
     last_open_longCondition - last_open_longCondition * sl : na, "Long SL", slColor, style=3,join=false, linewidth=2,offset=1)
//
plot(isTS and in_shortCondition and isShort and not in_closeShort?
     last_low + last_low * ts : na, "Short Trailing", fuchsia, style=2, linewidth=2,offset=1)
plot(isTP and in_shortCondition and isShort and not in_closeShort and last_low > last_open_shortCondition - last_open_shortCondition * tp ?
     last_open_shortCondition - last_open_shortCondition * tp : na, "Short TP Active", tpColor, style=3,join=false, linewidth=2,offset=1)
plot(isTP and in_shortCondition and isShort and not in_closeShort and last_low <= last_open_shortCondition -  last_open_shortCondition * tp ?
     last_low + last_low * ttp : na, "Short Trailing", black, style=2, linewidth=2,offset=1)
plot(isSL and in_shortCondition and isShort and not in_closeShort and last_high_short < last_open_shortCondition + last_open_shortCondition * sl ?
     last_open_shortCondition + last_open_shortCondition * sl : na, "Short SL", slColor, style=3,join=false, linewidth=2,offset=1)
//
bclr = not clrBars ? na : in_closeLong and in_closeShort ? GRAY :
                          in_longCondition and not in_closeLong and isLong ? close<last_open_longCondition? DARKGREEN : LIME :
                          in_shortCondition and not in_closeShort and isShort ? close>last_open_shortCondition? DARKRED : RED : GRAY
barcolor(bclr,title="Trade State Bar Colouring")


///////////////////////////////
//======[ Alert Plots ]======//
///////////////////////////////

//plotshape(longCondition?close:na, title="Long", color=green, textcolor=green, transp=0,
//          style=shape.triangleup, location=location.belowbar, size=size.small,text="LONG",offset=0)
//plotshape(longClose and not in_closeLong[1]?close:na, title="Long Close", color=longCloseCol, textcolor=white, transp=0,
//          style=shape.labeldown, location=location.abovebar, size=size.small,text="Long\nClose",offset=0)

//plotshape(shortCondition?close:na, title="Short", color=red, textcolor=red, transp=0,
//          style=shape.triangledown, location=location.abovebar, size=size.small,text="SHORT",offset=0)
//plotshape(shortClose and not in_closeShort[1]?close:na, title="Short Close", color=shortCloseCol, textcolor=white, transp=0,
//          style=shape.labelup, location=location.belowbar, size=size.small,text="Short\nClose",offset=0)

// Autoview alert syntax - This assumes you are trading coins BUY and SELL on Binance Exchange
// WARNING*** Only use Autoview to automate a strategy after you've sufficiently backtested and forward tested the strategy.
// You can learn more about the syntax here:
//      http://autoview.with.pink/#syntax and you can watch this video here: https://www.youtube.com/watch?v=epN5Tjinuxw

// For the opens you will want to trigger BUY orders on LONGS (eg ETHBTC) with alert option "Once Per Bar Close"
// and SELL orders on SHORTS (eg BTCUSDT)
//      b=buy q=0.001 e=binance s=ethbtc t=market  ( LONG )
// or   b=sell q=0.001 e=binance s=btcusdt t=market ( SHORT )
//alertcondition(longCondition, "Open Long", "LONG")
//alertcondition(shortCondition, "Open Short", "SHORT")

// For the closes you will want to trigger these alerts on condition with alert option "Once Per Bar"
// (NOTE: with Renko you can only use "Once Per Bar Close" option)
//      b=sell q=99% e=binance s=ethbtc t=market  ( CLOSE LONGS )
// or   b=buy q=99% e=binance s=btcusdt t=market  ( CLOSE SHORTS )
// This gets it as it happens and typically results in a better exit live than in the backtest.
// It works really well for counteracting some market slippage
//alertcondition(longClose and not in_closeLong[1], "Close Longs", "CLOSE LONGS")
//alertcondition(shortClose and not in_closeShort[1], "Close Shorts", "CLOSE SHORTS")

////////////////////////////////////////////
//======[ Strategy Entry and Exits ]======//
////////////////////////////////////////////

if testPeriod() and isLong
    strategy.entry("Long", 1, when=longCondition)
    strategy.close("Long", when=longClose and not in_closeLong[1])

if testPeriod() and isShort
    strategy.entry("Short", 0,  when=shortCondition)
    strategy.close("Short", when=shortClose and not in_closeShort[1])

// --- Debugs
//plotchar(longExit,location=location.bottom)
//plotchar(longCondition,location=location.bottom)
//plotchar(in_longCondition,location=location.bottom)
//plotchar(longClose,location=location.bottom)
//plotchar(in_closeLong,location=location.bottom)
// --- /Debugs

///////////////////////////////////
//======[ Reset Variables ]======//
///////////////////////////////////

if longClose or not in_longCondition or not isLong
    last_high := na
    last_high_short := na
    sectionLongs := 0

if longClose and isLong and not in_closeLong[1] and bsState==1
    bsState := 0

if shortClose or not in_shortCondition or not isShort
    last_low := na
    last_low_long := na
    sectionShorts := 0

if shortClose and isShort and not in_closeShort[1] and bsState==-1
    bsState := 0


//plotchar(bsState,location=location.bottom)
// EOF