Chiến lược theo dõi động lượng qua các khung thời gian
Tổng quan
Chiến lược này thực hiện theo dõi động lực trên các khung thời gian bằng cách kết hợp 123 reversal và MACD. 123 reversal xác định điểm đảo ngược xu hướng ngắn hạn, MACD xác định xu hướng trung hạn dài hạn, cả hai kết hợp để thực hiện một số tín hiệu đa luồng của xu hướng trung hạn trong khi khóa xu hướng ngắn hạn.
Nguyên tắc chiến lược
Chiến lược này bao gồm hai phần:
123 phần đảo ngược: Hai đường K hiện tại tạo ra điểm cao / thấp và tạo ra tín hiệu mua / bán khi chỉ số ngẫu nhiên thấp hơn / cao hơn 50.
Phần MACD: Đường nhanh tạo ra tín hiệu mua khi đi qua đường chậm, đường nhanh tạo ra tín hiệu bán khi đi qua đường chậm.
Cuối cùng kết hợp cả hai, tức là khi MACD cũng tạo ra tín hiệu đồng chiều trong khi 123 quay ngược, phát ra tín hiệu cuối cùng.
Phân tích lợi thế
Chiến lược này kết hợp các xu hướng ngắn hạn và trung hạn, có thể khóa xu hướng trung hạn trong biến động ngắn hạn, do đó có tỷ lệ thắng cao hơn. Đặc biệt là trong tình huống chấn động, có thể lọc một phần tiếng ồn bằng cách đảo ngược 123, do đó cải thiện sự ổn định.
Ngoài ra, bằng cách điều chỉnh các tham số, bạn có thể cân bằng tỷ lệ của tín hiệu đảo ngược và tín hiệu xu hướng để thích ứng với môi trường thị trường khác nhau.
Phân tích rủi ro
Chiến lược này có độ trễ theo thời gian, đặc biệt là khi sử dụng MACD chu kỳ dài, có thể bỏ lỡ các hoạt động ngắn hạn. Ngoài ra, tín hiệu đảo ngược tự nó có một mức độ ngẫu nhiên, dễ bị mắc kẹt.
Có thể rút ngắn chu kỳ MACD một cách thích hợp, hoặc tăng stop loss để kiểm soát rủi ro.
Hướng tối ưu hóa
Chiến lược này có thể được tối ưu hóa theo các khía cạnh sau:
Điều chỉnh 123 tham số đảo ngược, tối ưu hóa hiệu quả đảo ngược
Điều chỉnh tham số MACD để tối ưu hóa phán đoán xu hướng
Thêm các bộ lọc cho các chỉ số phụ trợ khác để tăng hiệu quả
Tăng chiến lược ngăn chặn tổn thất, kiểm soát rủi ro
Tóm tắt
Chiến lược này tích hợp nhiều tham số và các chỉ số kỹ thuật của nhiều khung thời gian, cân bằng các ưu điểm của giao dịch đảo ngược và giao dịch xu hướng bằng cách theo dõi động lực trên các khung thời gian. Có thể điều chỉnh hiệu quả cân bằng thông qua các tham số và có thể giới thiệu nhiều chỉ số hoặc dừng để tối ưu hóa, là một ý tưởng chiến lược rất tiềm năng.
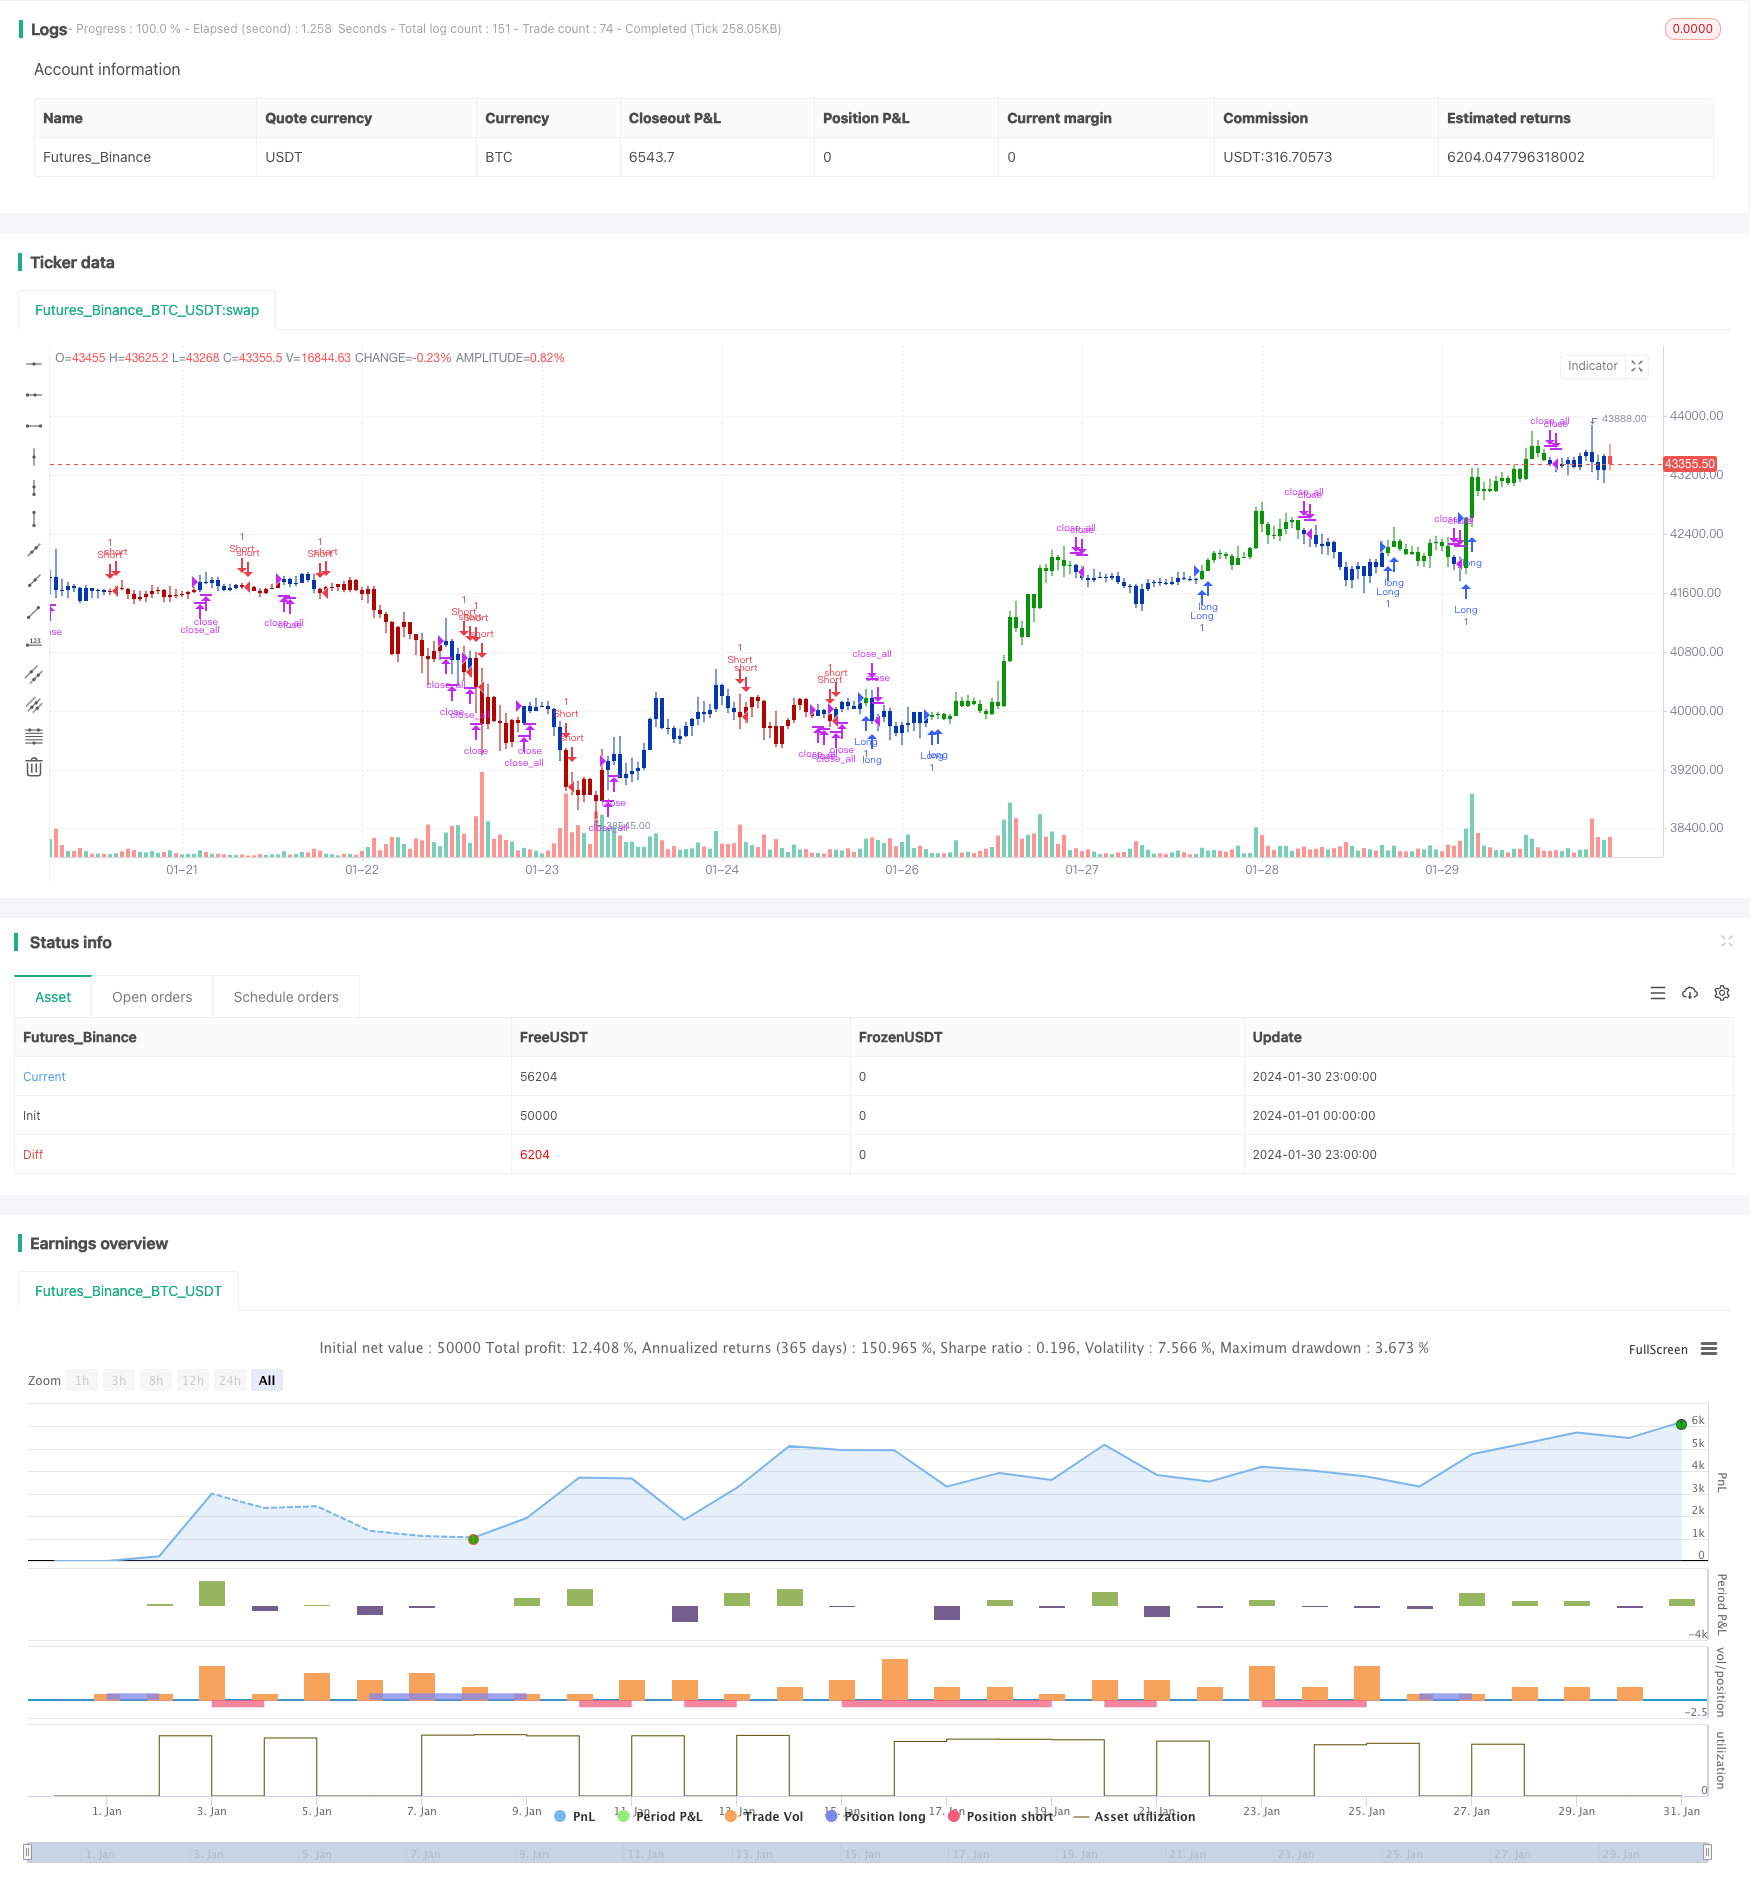
/*backtest
start: 2024-01-01 00:00:00
end: 2024-01-31 00:00:00
period: 1h
basePeriod: 15m
exchanges: [{"eid":"Futures_Binance","currency":"BTC_USDT"}]
*/

//@version=4
////////////////////////////////////////////////////////////
//  Copyright by HPotter v1.0 28/01/2021
// This is combo strategies for get a cumulative signal.
//
// First strategy
// This System was created from the Book "How I Tripled My Money In The
// Futures Market" by Ulf Jensen, Page 183. This is reverse type of strategies.
// The strategy buys at market, if close price is higher than the previous close
// during 2 days and the meaning of 9-days Stochastic Slow Oscillator is lower than 50.
// The strategy sells at market, if close price is lower than the previous close price
// during 2 days and the meaning of 9-days Stochastic Fast Oscillator is higher than 50.
//
// Second strategy
// MACD – Moving Average Convergence Divergence. The MACD is calculated
// by subtracting a 26-day moving average of a security's price from a
// 12-day moving average of its price. The result is an indicator that
// oscillates above and below zero. When the MACD is above zero, it means
// the 12-day moving average is higher than the 26-day moving average.
// This is bullish as it shows that current expectations (i.e., the 12-day
// moving average) are more bullish than previous expectations (i.e., the
// 26-day average). This implies a bullish, or upward, shift in the supply/demand
// lines. When the MACD falls below zero, it means that the 12-day moving average
// is less than the 26-day moving average, implying a bearish shift in the
// supply/demand lines.
// A 9-day moving average of the MACD (not of the security's price) is usually
// plotted on top of the MACD indicator. This line is referred to as the "signal"
// line. The signal line anticipates the convergence of the two moving averages
// (i.e., the movement of the MACD toward the zero line).
// Let's consider the rational behind this technique. The MACD is the difference
// between two moving averages of price. When the shorter-term moving average rises
// above the longer-term moving average (i.e., the MACD rises above zero), it means
// that investor expectations are becoming more bullish (i.e., there has been an
// upward shift in the supply/demand lines). By plotting a 9-day moving average of
// the MACD, we can see the changing of expectations (i.e., the shifting of the
// supply/demand lines) as they occur.
//
// WARNING:
// - For purpose educate only
// - This script to change bars colors.
////////////////////////////////////////////////////////////
Reversal123(Length, KSmoothing, DLength, Level) =>
    vFast = sma(stoch(close, high, low, Length), KSmoothing)
    vSlow = sma(vFast, DLength)
    pos = 0.0
    pos := iff(close[2] < close[1] and close > close[1] and vFast < vSlow and vFast > Level, 1,
	         iff(close[2] > close[1] and close < close[1] and vFast > vSlow and vFast < Level, -1, nz(pos[1], 0)))
	pos

MACD(fastLength,slowLength,signalLength) =>
    pos = 0.0
    fastMA = ema(close, fastLength)
    slowMA = ema(close, slowLength)
    macd = fastMA - slowMA
    signal = sma(macd, signalLength)
    pos:= iff(signal < macd , 1,
	       iff(signal > macd, -1, nz(pos[1], 0)))
    pos

strategy(title="Combo Backtest 123 Reversal & MACD Crossover", shorttitle="Combo", overlay = true)
line1 = input(true, "---- 123 Reversal ----")
Length = input(14, minval=1)
KSmoothing = input(1, minval=1)
DLength = input(3, minval=1)
Level = input(50, minval=1)
//-------------------------
fastLength = input(8, minval=1)
slowLength = input(16,minval=1)
signalLength=input(11,minval=1)
xSeria = input(title="Source", type=input.source, defval=close)
reverse = input(false, title="Trade reverse")
posReversal123 = Reversal123(Length, KSmoothing, DLength, Level)
posMACD = MACD(fastLength,slowLength, signalLength)
pos = iff(posReversal123 == 1 and posMACD == 1 , 1,
	   iff(posReversal123 == -1 and posMACD == -1, -1, 0))
possig = iff(reverse and pos == 1, -1,
          iff(reverse and pos == -1 , 1, pos))
if (possig == 1)
    strategy.entry("Long", strategy.long)
if (possig == -1)
    strategy.entry("Short", strategy.short)
if (possig == 0)
    strategy.close_all()
barcolor(possig == -1 ? #b50404: possig == 1 ? #079605 : #0536b3 )