Chiến lược đảo ngược dừng theo xu hướng
Tổng quan
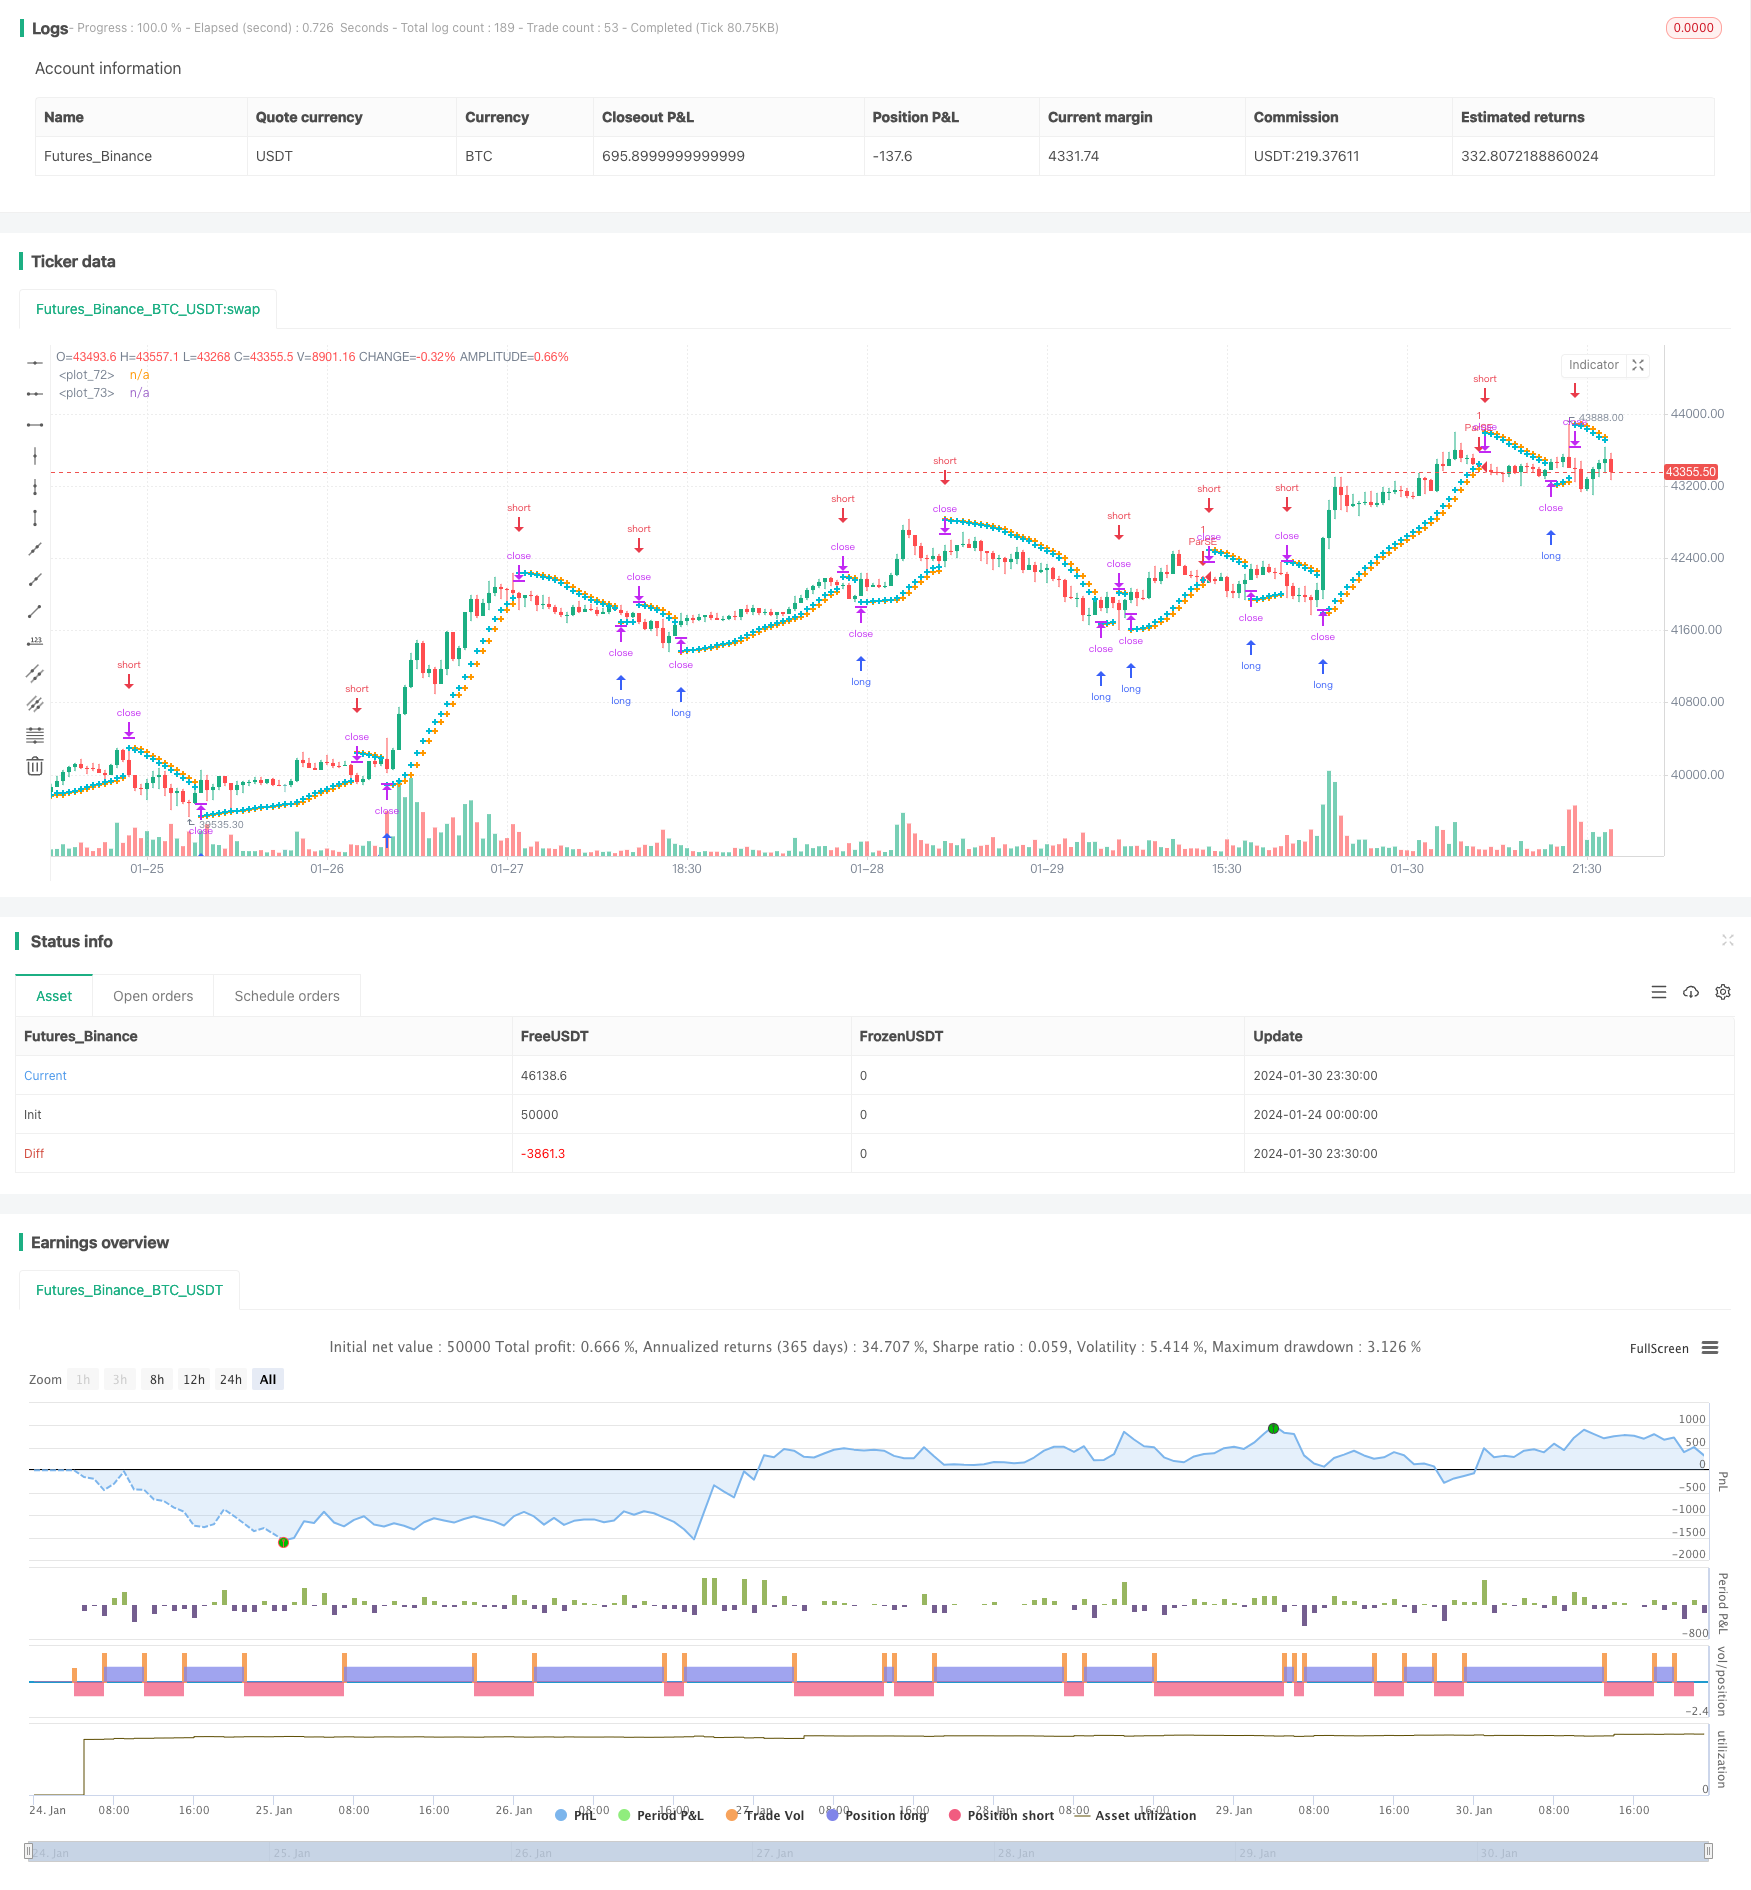
Chiến lược đảo ngược dừng theo xu hướng là một chiến lược sử dụng chỉ số Parabolic SAR để xác định xu hướng và vào vị trí đảo ngược khi xu hướng đảo ngược. Chiến lược này kết hợp các cơ chế dừng và dừng để kiểm soát rủi ro.
Nguyên tắc chiến lược
Chiến lược này sử dụng chỉ số Parabolic SAR để đánh giá xu hướng thị trường hiện tại. Tên đầy đủ của Parabolic SAR là Parabolic Stop and Reverse , biểu thị đường dừng lỗ đảo ngược. Các đường chỉ số của nó giống như một loạt các đường parabola trên biểu đồ giá, các điểm đường parabola đại diện cho điểm đảo ngược có thể.
Khi điểm SAR giảm và thấp hơn giá, nó đại diện cho xu hướng giảm giá; khi điểm SAR tăng và cao hơn giá, nó đại diện cho xu hướng giảm giá. Chiến lược này là đánh giá hướng xu hướng hiện tại dựa trên vị trí của điểm SAR.
Cụ thể, khi điểm SAR đang có xu hướng tăng và cao hơn giá, chiến lược sẽ thực hiện một vị trí khống chế; khi điểm SAR đang có xu hướng giảm và thấp hơn giá, chiến lược sẽ thực hiện nhiều vị trí. Đó là, khi điểm SAR cho thấy xu hướng đảo ngược, hãy vào vị trí đảo ngược.
Ngoài ra, chiến lược này cũng có các cơ chế dừng lỗ và dừng. Khi thực hiện nhiều lần, có thể thiết lập giá dừng lỗ để hạn chế tổn thất; đồng thời có thể thiết lập giá dừng để thanh toán khi giá đạt được mục tiêu lợi nhuận nhất định.
Phân tích lợi thế
Chiến lược này kết hợp các chỉ số xu hướng và cơ chế dừng / dừng có những lợi thế chính sau:
- Có khả năng nắm bắt cơ hội đảo ngược xu hướng và thực hiện các hoạt động đảo ngược.
- Sau khi thiết lập dừng lỗ và dừng, bạn có thể chủ động kiểm soát rủi ro và lợi nhuận.
- Parabolic SAR là một chỉ số đảo ngược xu hướng khá phổ biến và có hiệu quả tốt hơn.
- Các quy tắc chiến lược rất đơn giản, rõ ràng, dễ hiểu và dễ thực hiện.
Phân tích rủi ro
Chiến lược này cũng có một số rủi ro cần lưu ý:
- Chỉ số Parabolic SAR không hoàn hảo, đôi khi nó phát ra tín hiệu sai.
- Cài đặt giá dừng lỗ hoặc dừng chân cần phải hợp lý, nếu không có thể dừng lỗ hoặc dừng chân quá sớm.
- Phí giao dịch cũng ảnh hưởng đến lợi nhuận cuối cùng.
- Sự thay đổi này có thể chỉ diễn ra trong một thời gian ngắn.
Đối với những rủi ro này, có thể giải quyết bằng cách điều chỉnh các tham số tối ưu hóa, hoặc phối hợp với các bộ lọc các chỉ số khác.
Hướng tối ưu hóa
Chiến lược này có thể được tối ưu hóa theo các hướng sau:
- Tối ưu hóa các tham số của Parabolic SAR, tìm kiếm sự kết hợp tham số tốt nhất.
- Thử các chiến lược dừng lỗ khác nhau, chẳng hạn như dừng lỗ theo dõi.
- Thêm chỉ số hoặc điều kiện để lọc tín hiệu giao dịch đảo ngược.
- Thêm kiểm soát vị trí, mở rộng hoặc thu hẹp vị trí tùy theo tình hình thị trường.
- Các tham số điều chỉnh cho các loại giao dịch khác nhau.
Tóm tắt
Chiến lược này theo dõi xu hướng dừng lỗ và đảo ngược, nói chung là một chiến lược giao dịch cổ điển. Nó có chức năng nhận diện xu hướng đảo ngược, đồng thời hỗ trợ kiểm soát rủi ro bằng phương tiện dừng lỗ và ngăn chặn.
/*backtest
start: 2024-01-24 00:00:00
end: 2024-01-31 00:00:00
period: 30m
basePeriod: 15m
exchanges: [{"eid":"Futures_Binance","currency":"BTC_USDT"}]
*/

//@version=4
strategy("Parabolic SAR Strategy", overlay=true)
start = input(0.02)
increment = input(0.02)
maximum = input(0.2)
var bool uptrend = na
var float EP = na
var float SAR = na
var float AF = start
var float nextBarSAR = na
if bar_index > 0
	firstTrendBar = false
	SAR := nextBarSAR
	if bar_index == 1
		float prevSAR = na
		float prevEP = na
		lowPrev = low[1]
		highPrev = high[1]
		closeCur = close
		closePrev = close[1]
		if closeCur > closePrev
			uptrend := true
			EP := high
			prevSAR := lowPrev
			prevEP := high
		else
			uptrend := false
			EP := low
			prevSAR := highPrev
			prevEP := low
		firstTrendBar := true
		SAR := prevSAR + start * (prevEP - prevSAR)
	if uptrend
		if SAR > low
			firstTrendBar := true
			uptrend := false
			SAR := max(EP, high)
			EP := low
			AF := start
	else
		if SAR < high
			firstTrendBar := true
			uptrend := true
			SAR := min(EP, low)
			EP := high
			AF := start
	if not firstTrendBar
		if uptrend
			if high > EP
				EP := high
				AF := min(AF + increment, maximum)
		else
			if low < EP
				EP := low
				AF := min(AF + increment, maximum)
	if uptrend
		SAR := min(SAR, low[1])
		if bar_index > 1
			SAR := min(SAR, low[2])
	else
		SAR := max(SAR, high[1])
		if bar_index > 1
			SAR := max(SAR, high[2])
	nextBarSAR := SAR + AF * (EP - SAR)
	if barstate.isconfirmed
		if uptrend
			strategy.entry("ParSE", strategy.short, stop=nextBarSAR, comment="ParSE")
			strategy.cancel("ParLE")
		else
			strategy.entry("ParLE", strategy.long, stop=nextBarSAR, comment="ParLE")
			strategy.cancel("ParSE")
plot(SAR, style=plot.style_cross, linewidth=3, color=color.orange)
plot(nextBarSAR, style=plot.style_cross, linewidth=3, color=color.aqua)
//Stop Loss Inputs
use_short_stop_loss = input(false, title="Short Stop Loss", group="Stop Loss and Take Profit", inline="Short_SL")
short_stop_loss = input(title="(%)", type=input.float, minval=0.0, step=0.1,
     defval=5, group="Stop Loss and Take Profit", inline="Short_SL") * 0.01
use_long_stop_loss = input(false, title="Long Stop Loss", group="Stop Loss and Take Profit", inline="Long_SL")
long_stop_loss = input(title="(%)", type=input.float, minval=0.0, step=0.1,
     defval=5, group="Stop Loss and Take Profit", inline="Long_SL") * 0.01

//Take Profit Inputs
use_short_take_profit = input(false, title="Short Take Profit", group="Stop Loss and Take Profit", inline="Short_TP")
short_take_profit = input(title="(%)", type=input.float, minval=0.0, step=0.1,
     defval = 20, group="Stop Loss and Take Profit", inline="Short_TP") * .01
use_long_take_profit = input(false, title="Long Take Profit", group="Stop Loss and Take Profit", inline="Long_TP")
long_take_profit = input(title="(%)", type=input.float, minval=0.0, step=0.1,
     defval = 20, group="Stop Loss and Take Profit", inline="Long_TP") * .01


longStopPrice  = strategy.position_avg_price * (1 - long_stop_loss)
shortStopPrice = strategy.position_avg_price * (1 + short_stop_loss)
longLimitPrice = strategy.position_avg_price * (1 + long_take_profit)
shortLimitPrice = strategy.position_avg_price * (1 - short_take_profit)


if (strategy.position_size > 0.0)
    if (use_long_stop_loss and not use_long_take_profit)
        strategy.exit("Long", stop = longStopPrice)
    if (use_long_take_profit and not use_long_stop_loss)
        strategy.exit("Long", limit = longLimitPrice)
    if (use_long_take_profit and use_long_stop_loss)
        strategy.exit("Long", stop = longStopPrice, limit=longLimitPrice)
if (strategy.position_size < 0.0)
    if (use_short_stop_loss and not use_short_take_profit)
        strategy.exit("Short", stop = shortStopPrice)
    if (use_short_take_profit and not use_short_stop_loss)
        strategy.exit("Short", limit = shortLimitPrice)
    if (use_short_take_profit and use_short_stop_loss)
        strategy.exit("Short", stop = shortStopPrice, limit = shortLimitPrice)

//plot(strategy.equity, title="equity", color=color.red, linewidth=2, style=plot.style_areabr)