Chiến lược giao dịch định lượng đường trung bình động kép
Tổng quan
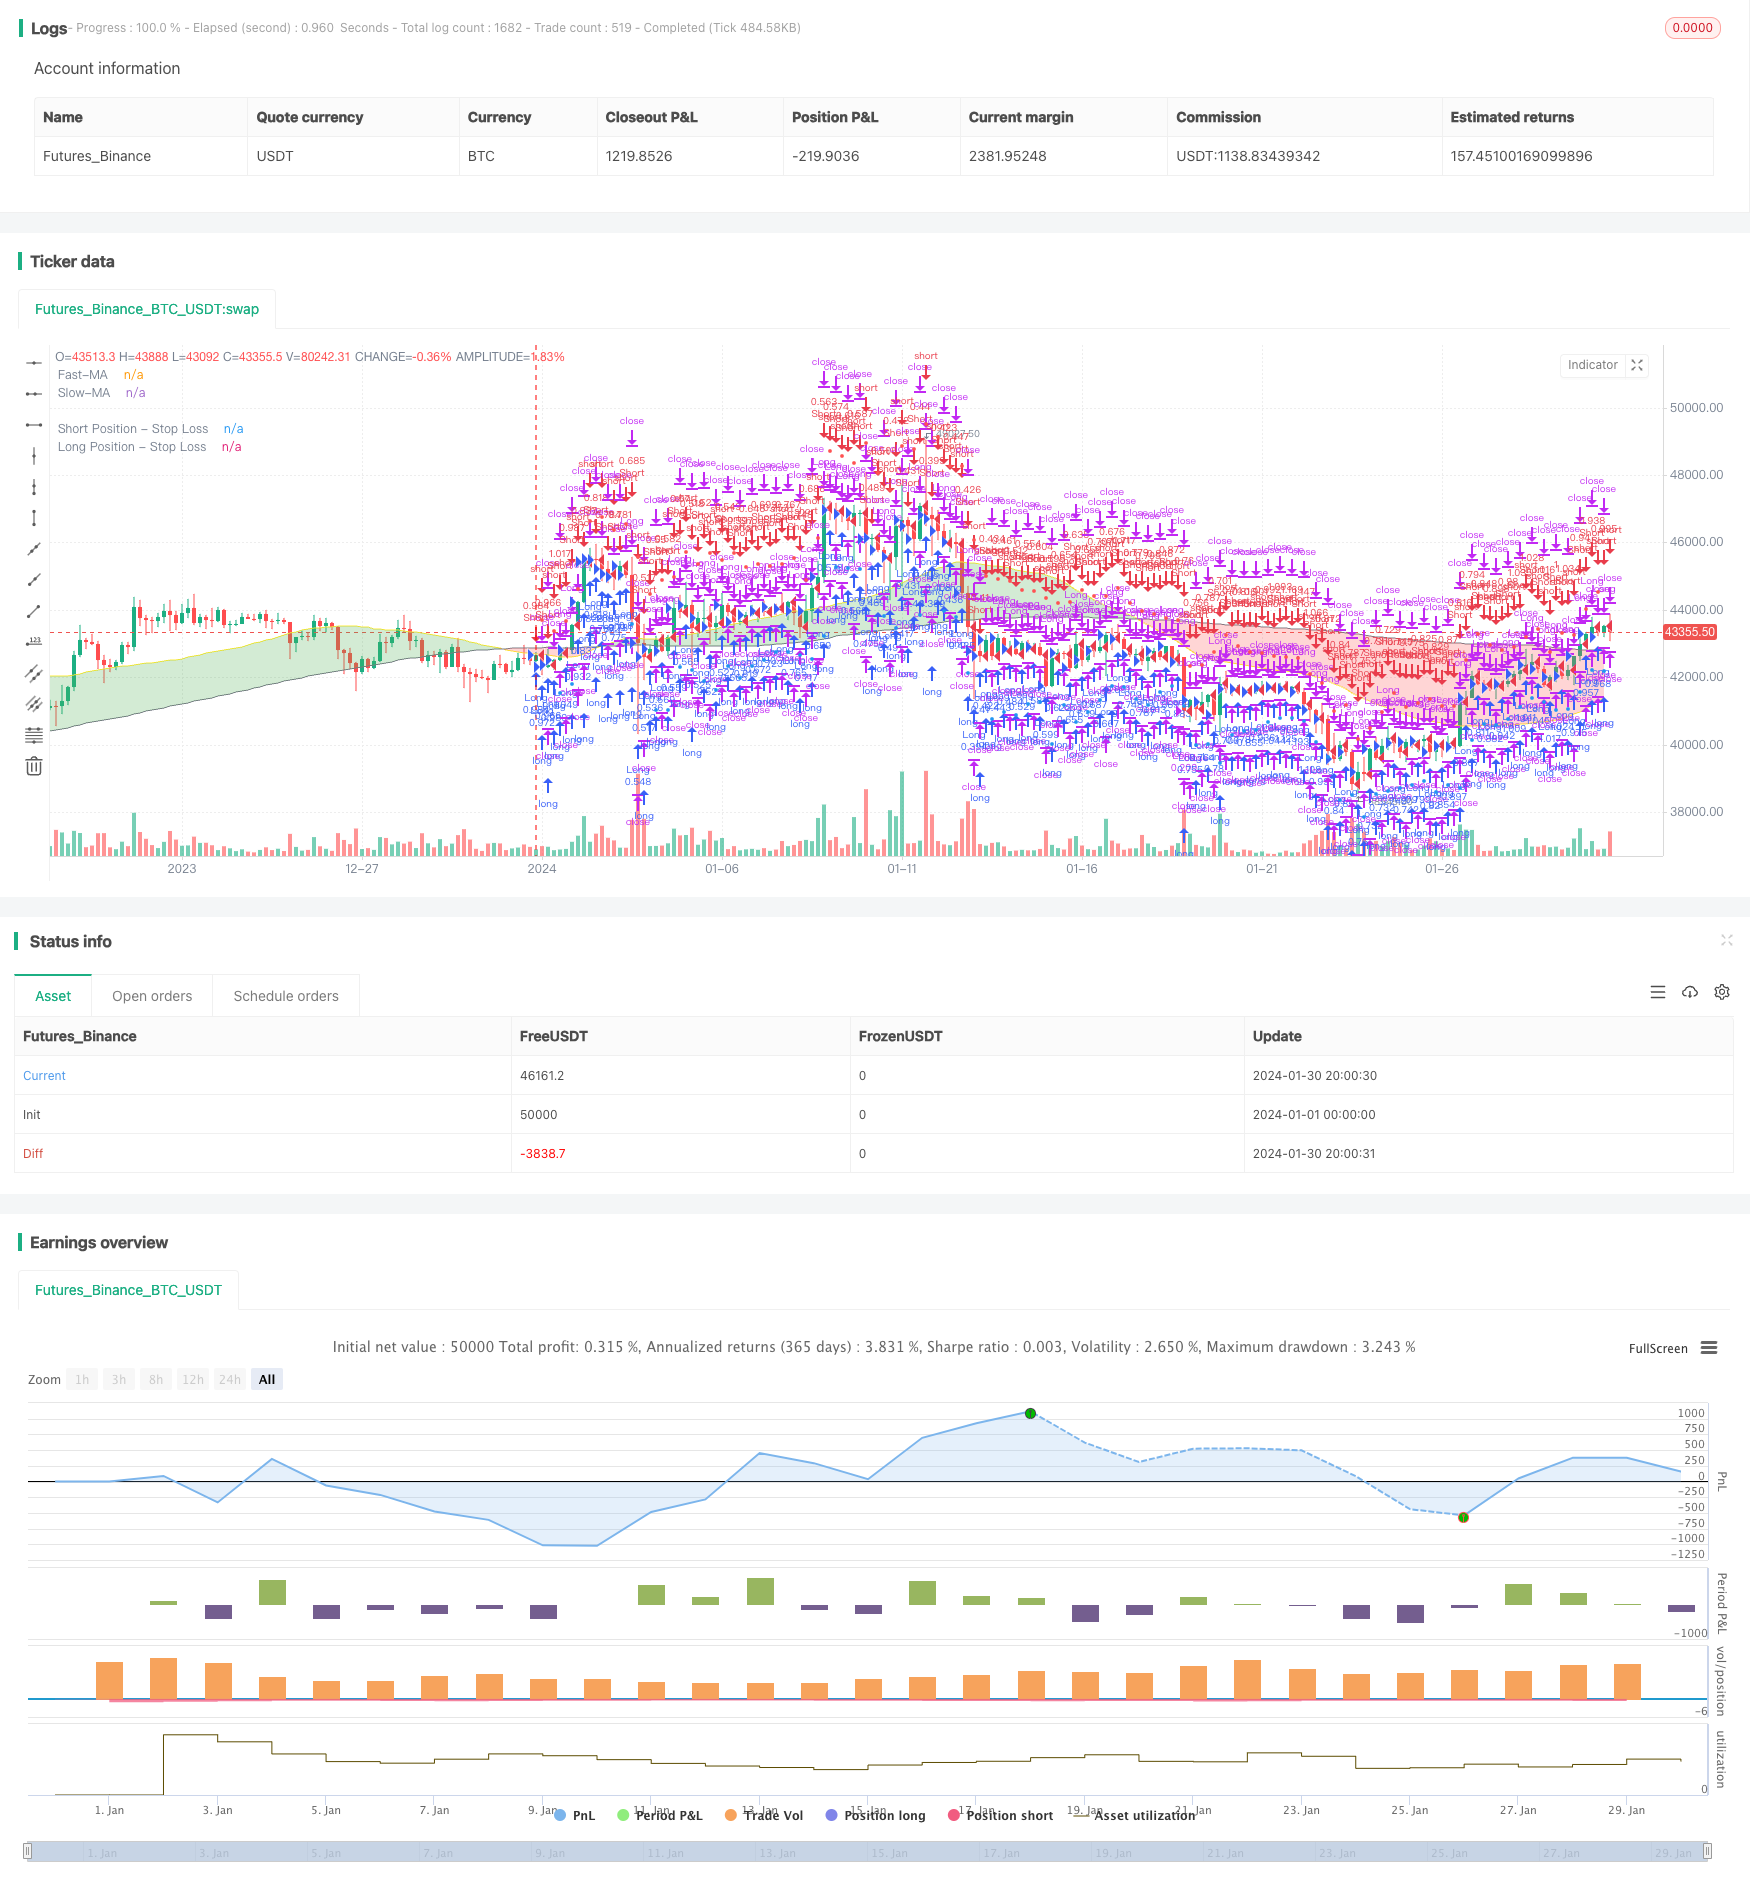
Chiến lược này thuộc loại chiến lược theo dõi xu hướng bằng cách tính toán các đường trung bình di chuyển nhanh và đường trung bình di chuyển chậm, và kết hợp với chỉ số đường phân cách để đưa ra phán đoán mua và bán. Làm nhiều khi vượt qua đường trung bình di chuyển chậm trên đường trung bình di chuyển nhanh; làm trống khi vượt qua đường trung bình di chuyển chậm dưới đường trung bình di chuyển nhanh.
Nguyên tắc chiến lược
- Tính toán trung bình di chuyển nhanh và trung bình di chuyển chậm. Các tham số di chuyển có thể được tùy chỉnh.
- So sánh hai đường trung bình di chuyển để xác định xu hướng của thị trường. Khi đường trung bình di chuyển nhanh vượt qua đường trung bình di chuyển chậm, nó được coi là thị trường đa đầu; khi đường trung bình di chuyển nhanh vượt qua đường trung bình di chuyển chậm, nó được coi là thị trường trống.
- Một tín hiệu mua chỉ được tạo ra khi giá đóng cửa trên đường nhanh đi qua đường chậm và giá đóng cửa cao hơn đường nhanh; một tín hiệu bán chỉ được tạo ra khi giá đóng cửa dưới đường nhanh đi qua đường chậm và giá đóng cửa thấp hơn đường nhanh.
- Sử dụng chỉ số đường parabola để lọc phá vỡ giả. Chỉ khi đường nhanh xuyên qua đường chậm và giá đóng cửa cao hơn đường nhanh và giá cổ phiếu cao hơn đường parabola, tín hiệu mua cuối cùng sẽ được tạo ra; và ngược lại.
- Đặt mức dừng lỗ theo mức chịu tổn thất tối đa. Tính toán giá dừng lỗ cụ thể kết hợp với chỉ số ATR
Lợi thế chiến lược
- Sử dụng đường trung bình di chuyển để xác định xu hướng thị trường, tránh giao dịch thường xuyên trong thị trường không rõ ràng
- Điều kiện lọc kép có hiệu quả trong việc tránh các vấn đề đột phá giả thường gặp
- Kiểm soát lỗ đơn hiệu quả kết hợp với chiến lược dừng lỗ
Rủi ro chiến lược
- Chiến lược chỉ số dễ tạo ra tín hiệu sai
- Không tính đến rủi ro tiền tệ
- Có thể đã bỏ lỡ những bước đi khác nhau từ đầu.
Đối với các vấn đề trên, có thể tối ưu hóa từ các khía cạnh sau:
- Tối ưu hóa các tham số trung bình di chuyển để phù hợp hơn với các giống cụ thể
- Có thể lọc tín hiệu kết hợp với các chỉ số hoặc mô hình khác
- Xem xét rủi ro tiền tệ của bảo hiểm thời gian thực hoặc tự động chuyển đổi tài khoản môi giới
Hướng tối ưu hóa
- Tối ưu hóa các tham số trung bình di chuyển để nắm bắt xu hướng tốt hơn
- Tăng sự kết hợp của mô hình, tăng độ chính xác của tín hiệu
- Xác thực nhiều chu kỳ thời gian, tránh bị mắc kẹt
- Tối ưu hóa chiến lược dừng lỗ và tăng cường sự ổn định của chiến lược
Tóm tắt
Chiến lược này là một trong những chiến lược theo dõi xu hướng điển hình của hai đường trung bình di chuyển và các chỉ số kết hợp. Xác định xu hướng thị trường bằng cách so sánh hai đường trung bình di chuyển nhanh và chậm; và kết hợp với nhiều chỉ số lọc để tránh tín hiệu giả tạo ra tín hiệu giao dịch. Đồng thời, chiến lược có chức năng dừng lỗ để kiểm soát tổn thất đơn.
/*backtest
start: 2024-01-01 00:00:00
end: 2024-01-31 00:00:00
period: 4h
basePeriod: 15m
exchanges: [{"eid":"Futures_Binance","currency":"BTC_USDT"}]
*/

// This source code is subject to the terms of the Mozilla Public License 2.0 at https://mozilla.org/MPL/2.0/
// © sosacur01

//@version=5
strategy(title="2 MA | Trend Following", overlay=true, pyramiding=1, commission_type=strategy.commission.percent, commission_value=0.2, initial_capital=10000)

//==========================================


//BACKTEST RANGE
useDateFilter = input.bool(true, title="Filter Date Range of Backtest",
     group="Backtest Time Period")
backtestStartDate = input(timestamp("1 jan 2000"),
     title="Start Date", group="Backtest Time Period",
     tooltip="This start date is in the time zone of the exchange " +
     "where the chart's instrument trades. It doesn't use the time " +
     "zone of the chart or of your computer.")
backtestEndDate = input(timestamp("1 Jul 2100"),
     title="End Date", group="Backtest Time Period",
     tooltip="This end date is in the time zone of the exchange " +
     "where the chart's instrument trades. It doesn't use the time " +
     "zone of the chart or of your computer.")
inTradeWindow = true
if not inTradeWindow and inTradeWindow[1]
    strategy.cancel_all()
    strategy.close_all(comment="Date Range Exit")

//--------------------------------------

//LONG/SHORT POSITION ON/OFF INPUT
LongPositions   = input.bool(title='On/Off Long Postion', defval=true, group="Long & Short Position")
ShortPositions  = input.bool(title='On/Off Short Postion', defval=true, group="Long & Short Position")

//---------------------------------------

//SLOW MA INPUTS
averageType1   = input.string(defval="SMA", group="Slow MA Inputs", title="Slow MA Type", options=["SMA", "EMA", "WMA", "HMA", "RMA", "SWMA", "ALMA", "VWMA", "VWAP"])
averageLength1 = input.int(defval=160, group="Slow MA Inputs", title="Slow MA Length", minval=50)
averageSource1 = input(close, title="Slow MA Source", group="Slow MA Inputs")


//SLOW MA TYPE
MovAvgType1(averageType1, averageSource1, averageLength1) =>
	switch str.upper(averageType1)
        "SMA"  => ta.sma(averageSource1, averageLength1)
        "EMA"  => ta.ema(averageSource1, averageLength1)
        "WMA"  => ta.wma(averageSource1, averageLength1)
        "HMA"  => ta.hma(averageSource1, averageLength1)
        "RMA"  => ta.rma(averageSource1, averageLength1)
        "SWMA" => ta.swma(averageSource1)
        "ALMA" => ta.alma(averageSource1, averageLength1, 0.85, 6)
        "VWMA" => ta.vwma(averageSource1, averageLength1)
        "VWAP" => ta.vwap(averageSource1)
        => runtime.error("Moving average type '" + averageType1 +
             "' not found!"), na


//----------------------------------

//FAST MA INPUTS
averageType2   = input.string(defval="SMA", group="Fast MA Inputs", title="Fast MA Type", options=["SMA","EMA","WMA","HMA","RMA","SWMA","ALMA","VWMA","VWAP"])
averageLength2 = input.int(defval=40, group="Fast MA Inputs", title="Fast MA Length", maxval=40)
averageSource2 = input(close, title="Fast MA Source", group="Fast MA Inputs")

//FAST MA TYPE
MovAvgType2(averageType2, averageSource2, averageLength2) =>
	switch str.upper(averageType2)
        "SMA"  => ta.sma(averageSource2, averageLength2)
        "EMA"  => ta.ema(averageSource2, averageLength2)
        "WMA"  => ta.wma(averageSource2, averageLength2)
        "HMA"  => ta.hma(averageSource2, averageLength2)
        "RMA"  => ta.rma(averageSource2, averageLength2)
        "SWMA" => ta.swma(averageSource2)
        "ALMA" => ta.alma(averageSource2, averageLength2, 0.85, 6)
        "VWMA" => ta.vwma(averageSource2, averageLength2)
        "VWAP" => ta.vwap(averageSource2)
        => runtime.error("Moving average type '" + averageType2 +
             "' not found!"), na

//---------------------------------------------------

//MA VALUES
FASTMA = MovAvgType2(averageType2, averageSource2, averageLength2)
SLOWMA = MovAvgType1(averageType1, averageSource1, averageLength1)

//BUY/SELL TRIGGERS
bullish_trend = FASTMA > SLOWMA and close > FASTMA
bearish_trend = FASTMA < SLOWMA and close < FASTMA

//MAs PLOT
plot1 = plot(SLOWMA,color=color.gray, linewidth=1, title="Slow-MA")
plot2 = plot(FASTMA,color=color.yellow, linewidth=1, title="Fast-MA")
fill(plot1, plot2, color=SLOWMA>FASTMA ? color.new(color.red, 70) : color.new(color.green, 70), title="EMA Clouds")

//-----------------------------------------------------

//PARABOLIC SAR USER INPUT
usepsarFilter = input.bool(title='Use Parabolic Sar?', defval=true, group = "Parabolic SAR Inputs")
psar_display  = input.bool(title="Display Parabolic Sar?", defval=false, group="Parabolic SAR Inputs")
start         = input.float(title="Start", defval=0.02, group="Parabolic SAR Inputs", step=0.001)
increment     = input.float(title="Increment", defval=0.02, group="Parabolic SAR Inputs", step=0.001)
maximum       = input.float(title="Maximum", defval=0.2, group="Parabolic SAR Inputs", step=0.001)

//SAR VALUES
psar        = request.security(syminfo.tickerid, "D", ta.sar(start, increment, maximum))

//BULLISH & BEARISH PSAR CONDITIONS
bullish_psar = (usepsarFilter ? low > psar : bullish_trend )
bearsish_psar = (usepsarFilter ? high < psar : bearish_trend)

//SAR PLOT
psar_plot    = if low > psar
    color.rgb(198, 234, 199, 13)
else
    color.rgb(219, 134, 134, 48)

plot(psar_display ? psar : na, color=psar_plot, title="Par SAR")

//-------------------------------------

//ENTRIES AND EXITS
long_entry  = if inTradeWindow and bullish_trend  and bullish_psar and LongPositions
    true
long_exit   = if inTradeWindow and bearish_trend
    true

short_entry = if inTradeWindow  and bearish_trend and bearsish_psar and ShortPositions
    true
short_exit  = if inTradeWindow  and bullish_trend
    true

//--------------------------------------

//RISK MANAGEMENT - SL, MONEY AT RISK, POSITION SIZING
atrPeriod                = input.int(14, "ATR Length", group="Risk Management Inputs")
sl_atr_multiplier        = input.float(title="Long Position - Stop Loss - ATR Multiplier", defval=2, group="Risk Management Inputs", step=0.5)
sl_atr_multiplier_short  = input.float(title="Short Position - Stop Loss - ATR Multiplier", defval=2, group="Risk Management Inputs", step=0.5)
i_pctStop                = input.float(2, title="% of Equity at Risk", step=.5, group="Risk Management Inputs")/100

//ATR VALUE
_atr = ta.atr(atrPeriod)

//CALCULATE LAST ENTRY PRICE
lastEntryPrice = strategy.opentrades.entry_price(strategy.opentrades - 1)

//STOP LOSS - LONG POSITIONS
var float sl = na

//CALCULTE SL WITH ATR AT ENTRY PRICE - LONG POSITION
if (strategy.position_size[1] != strategy.position_size)
    sl := lastEntryPrice - (_atr * sl_atr_multiplier)

//IN TRADE - LONG POSITIONS
inTrade = strategy.position_size > 0

//PLOT SL - LONG POSITIONS
plot(inTrade ? sl : na, color=color.blue, style=plot.style_circles, title="Long Position - Stop Loss")

//CALCULATE ORDER SIZE - LONG POSITIONS
positionSize = (strategy.equity * i_pctStop) / (_atr * sl_atr_multiplier)

//============================================================================================

//STOP LOSS - SHORT POSITIONS
var float sl_short = na

//CALCULTE SL WITH ATR AT ENTRY PRICE - SHORT POSITIONS
if (strategy.position_size[1] != strategy.position_size)
    sl_short := lastEntryPrice + (_atr * sl_atr_multiplier_short)

//IN TRADE SHORT POSITIONS
inTrade_short = strategy.position_size < 0

//PLOT SL - SHORT POSITIONS
plot(inTrade_short ? sl_short : na, color=color.red, style=plot.style_circles, title="Short Position - Stop Loss")

//CALCULATE ORDER - SHORT POSITIONS
positionSize_short = (strategy.equity * i_pctStop) / (_atr * sl_atr_multiplier_short)


//===============================================

//LONG STRATEGY
strategy.entry("Long", strategy.long, comment="Long", when = long_entry, qty=positionSize)
if (strategy.position_size > 0)
    strategy.close("Long", when = (long_exit), comment="Close Long")
    strategy.exit("Long", stop = sl, comment="Exit Long")

//SHORT STRATEGY
strategy.entry("Short", strategy.short, comment="Short", when = short_entry, qty=positionSize_short)
if (strategy.position_size < 0)
    strategy.close("Short", when = (short_exit), comment="Close Short")
    strategy.exit("Short", stop = sl_short, comment="Exit Short")

//ONE DIRECTION TRADING COMMAND (BELLOW ONLY ACTIVATE TO CORRECT BUGS)