Chiến lược dừng lỗ và dừng lãi trung bình động của ba chỉ số
Tổng quan
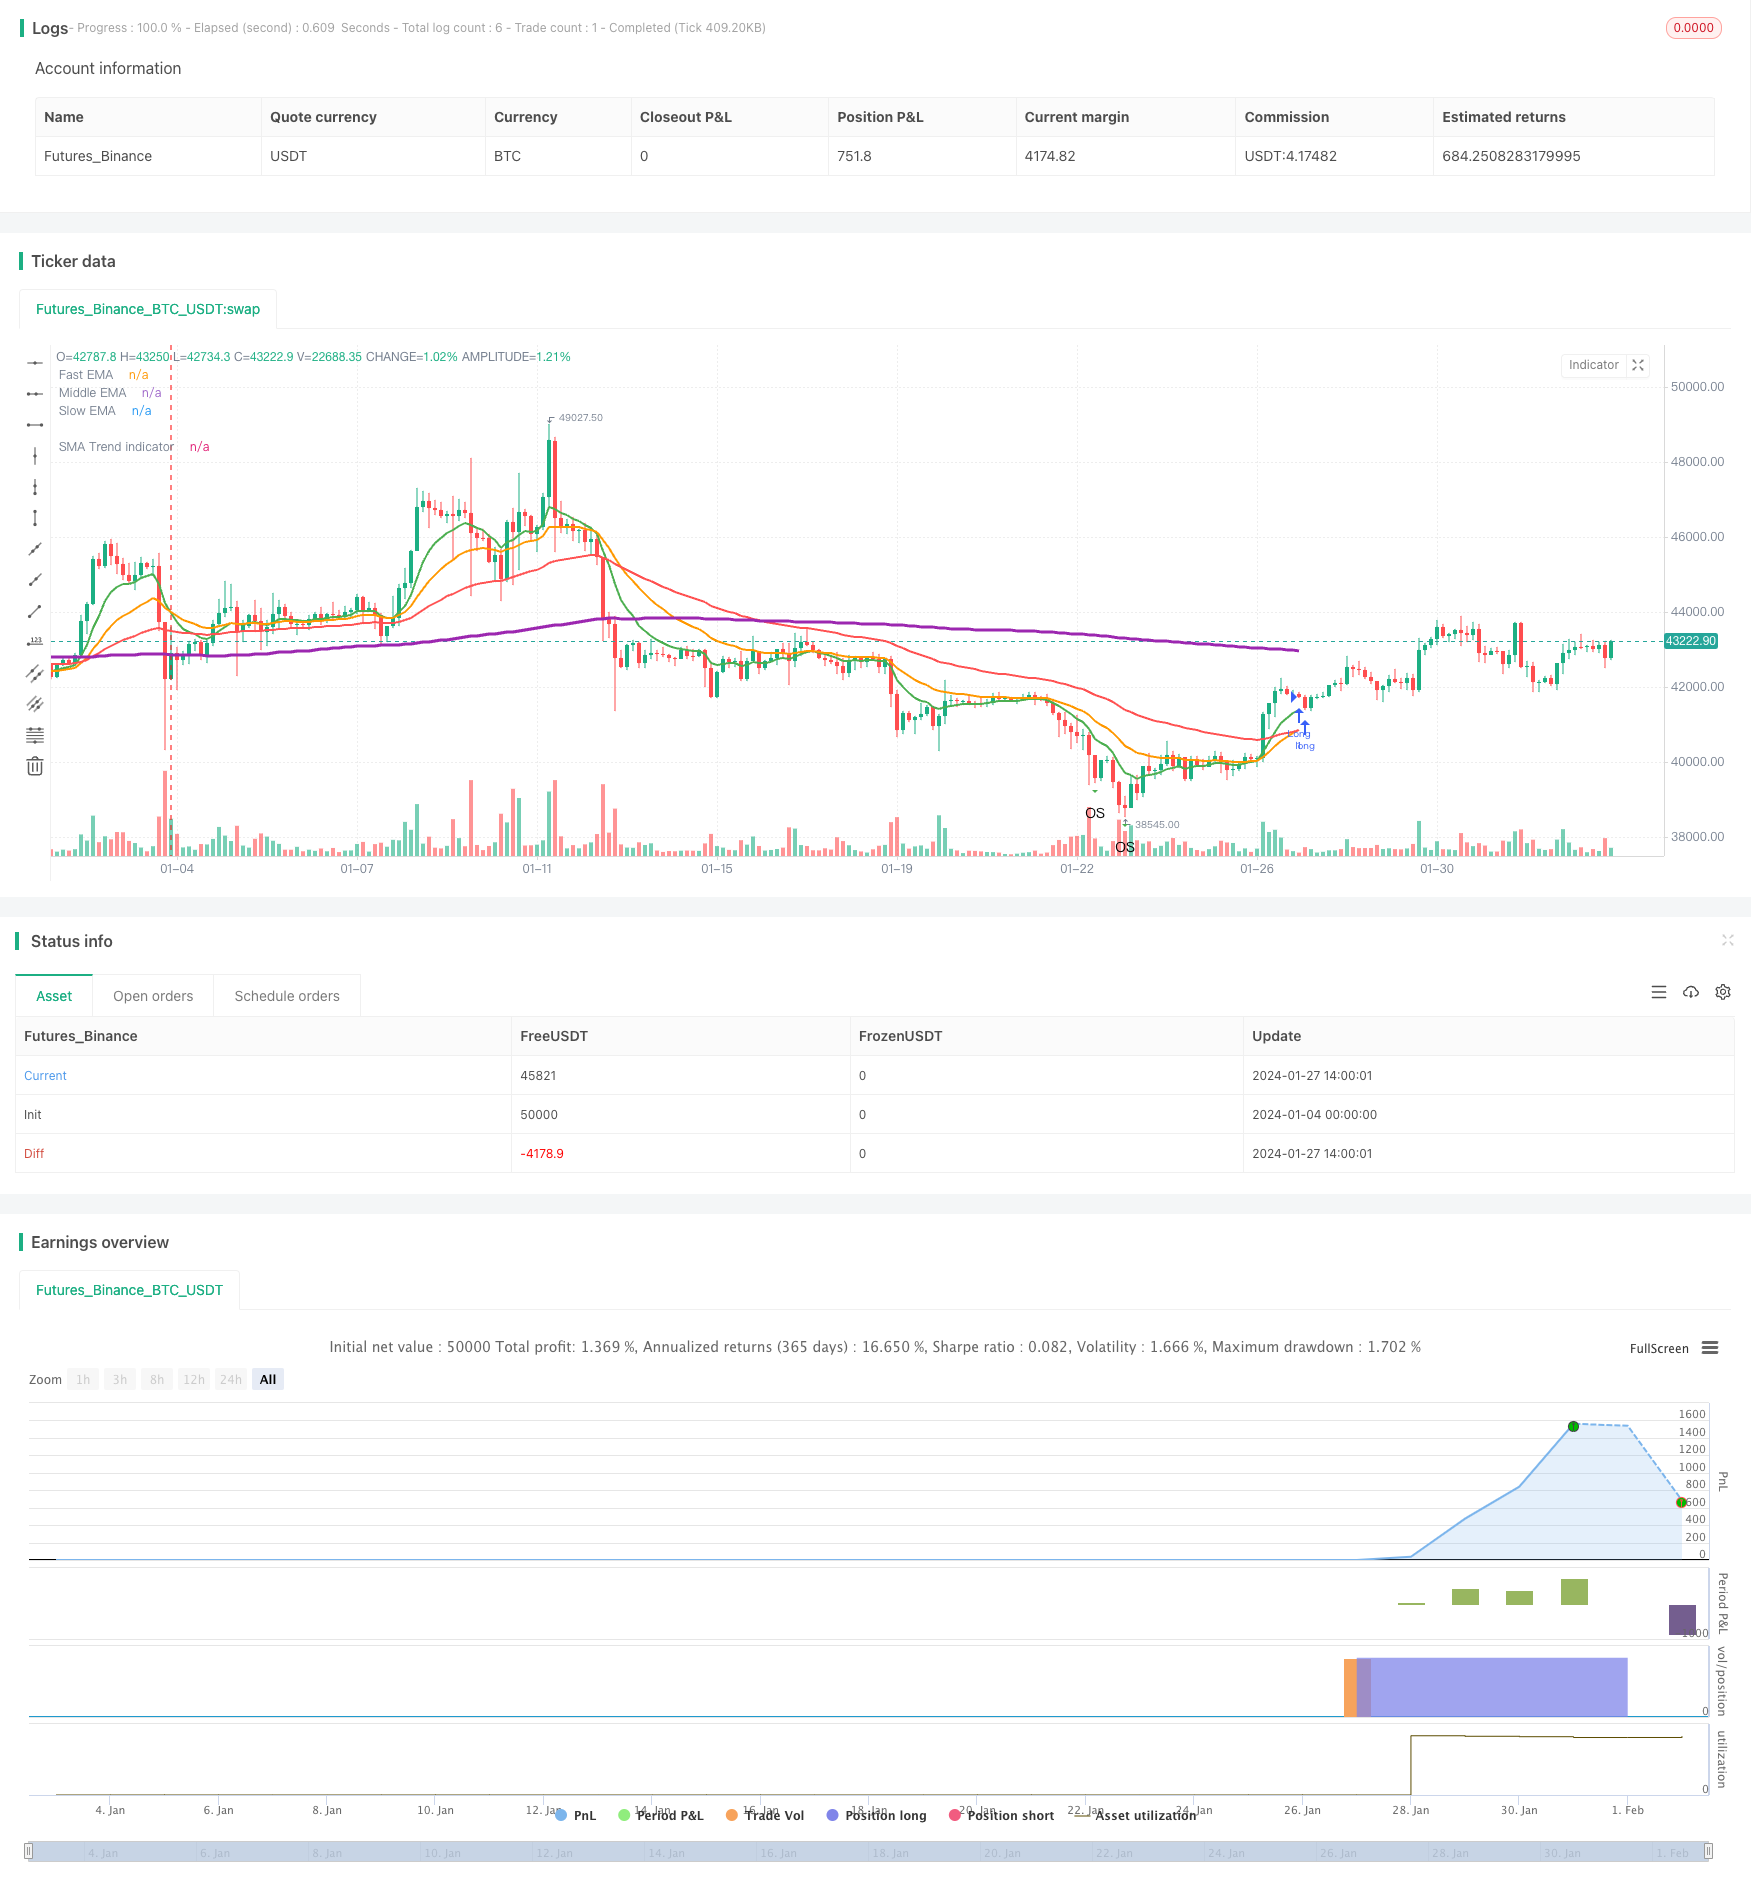
Chiến lược dừng lỗ của ba chỉ số trung bình là một chiến lược theo dõi xu hướng để đưa ra thị trường dựa trên trung bình di chuyển của chỉ số trong ba chu kỳ khác nhau. Nó đồng thời sử dụng các chỉ số sóng thực trung bình để thiết lập điểm dừng lỗ và quản lý rủi ro.
Nguyên tắc chiến lược
Chiến lược này sử dụng ba đường trung bình di chuyển chỉ số: đường nhanh, đường trung và đường chậm. Khi đường trung đi qua đường chậm, làm nhiều; Khi đường nhanh đi qua đường trung, bằng phẳng. Đây là một chiến lược theo dõi xu hướng điển hình, định hướng xu hướng bằng cách chuyển đổi nhiều không gian của ba đường đồng bằng.
Trong khi đó, chiến lược này sử dụng chỉ số sóng thực trung bình để tính toán điểm dừng lỗ. Cụ thể, nhiều điểm dừng đơn là giá nhập cảnh + sóng thực trung bình*Tỷ lệ dừng; một điểm dừng rỗng là giá nhập cảnh - Độ sóng thực trung bình*Hệ số dừng. Nguyên tắc dừng lỗ tương tự như dừng. Điều này có thể hạn chế hiệu quả rủi ro đơn phương.
Phân tích lợi thế
- Các chỉ số quyết định được thực hiện một cách trực quan, rõ ràng và dễ hiểu.
- Nó có hệ thống và dễ dàng đo lường.
- Theo dõi xu hướng và kiểm soát rủi ro.
Phân tích rủi ro
- Có một số sự chậm trễ, không thể bắt kịp sự chuyển đổi.
- Những người này có thể bị tổn thương do các cơn động đất.
- Cài đặt tham số cần được tối ưu hóa, nếu không sẽ không hiệu quả.
Các biện pháp đối phó rủi ro bao gồm: Giảm chu kỳ trung bình một cách thích hợp, tối ưu hóa hệ số dừng lỗ, thêm các chỉ số quyết định khác để hỗ trợ phán đoán.
Hướng tối ưu hóa
- Kết hợp nhiều chỉ số đường trung bình để tìm tham số tốt nhất.
- Thêm các chỉ số kỹ thuật khác như MACD, RSI, v.v.
- Sử dụng thuật toán học máy để tự động tối ưu hóa tham số.
- Định mức dừng lỗ dựa trên động lực của tần số sóng thực.
- Kết hợp với các chỉ số cảm xúc để tránh giao dịch quá tải.
Tóm tắt
Chiến lược này nói chung là một chiến lược theo dõi xu hướng có hiệu quả ổn định, thiết lập tham số đơn giản, dễ thực hiện. Bạn có thể hạn chế rủi ro đơn phương bằng cách dừng dừng động của bước sóng thực trung bình.
/*backtest
start: 2024-01-04 00:00:00
end: 2024-02-03 00:00:00
period: 3h
basePeriod: 15m
exchanges: [{"eid":"Futures_Binance","currency":"BTC_USDT"}]
*/

//@version=4
//© Densz
strategy("3EMA with TP & SL (ATR)", overlay=true )

// INPUTS
startTime           =       input(title="Start Time", type = input.time, defval = timestamp("01 Jan 2017 00:00 +0000"))
endTime             =       input(title="End Time", type = input.time, defval = timestamp("01 Jan 2022 00:00 +0000"))

slowEMALength       =       input(title="Slow EMA Length", type = input.integer, defval = 55)
middleEMALength     =       input(title="Middle EMA Length", type = input.integer, defval = 21)
fastEMALength       =       input(title="Fast EMA Length", type = input.integer, defval = 9)

trendMALength       =       input(title="Trend indicator MA Length", type = input.integer, defval = 200)

atrLength           =       input(title="ATR Length", type = input.integer, defval = 14)
tpATRMult           =       input(title="Take profit ATR multiplier", type = input.integer, defval = 3)
slATRMult           =       input(title="Stop loss ATR multiplier", type = input.integer, defval = 2)

rsiLength           =       input(title="RSI Length", type = input.integer, defval = 14)

// Indicators
slowEMA             =       ema(close, slowEMALength)
middEMA             =       ema(close, middleEMALength)
fastEMA             =       ema(close, fastEMALength)
atr                 =       atr(atrLength)

rsiValue            =       rsi(close, rsiLength)
isRsiOB             =       rsiValue >= 80
isRsiOS             =       rsiValue <= 20

sma200              =       sma(close, trendMALength)

inDateRange         =       true

// Plotting
plot(slowEMA, title="Slow EMA", color=color.red, linewidth=2, transp=50)
plot(middEMA, title="Middle EMA", color=color.orange, linewidth=2, transp=50)
plot(fastEMA, title="Fast EMA", color=color.green, linewidth=2, transp=50)

plot(sma200, title="SMA Trend indicator", color=color.purple, linewidth=3, transp=10)
plotshape(isRsiOB, title="Overbought", location=location.abovebar, color=color.red, transp=0, style=shape.triangledown, text="OB")
plotshape(isRsiOS, title="Oversold", location=location.belowbar, color=color.green, transp=0, style=shape.triangledown, text="OS")

float takeprofit    =       na
float stoploss      =       na

var line tpline     =       na
var line slline     =       na

if strategy.position_size != 0
    takeprofit := takeprofit[1]
    stoploss := stoploss[1]
    line.set_x2(tpline, bar_index)
    line.set_x2(slline, bar_index)
    line.set_extend(tpline, extend.none)
    line.set_extend(slline, extend.none)

// STRATEGY
goLong  = crossover(middEMA, slowEMA) and inDateRange
closeLong = crossunder(fastEMA, middEMA) and inDateRange


if goLong
    takeprofit := close + atr * tpATRMult
    stoploss := close - atr * slATRMult
    // tpline := line.new(bar_index, takeprofit, bar_index, takeprofit, color=color.green, width=2, extend=extend.right, style=line.style_dotted)
    // slline := line.new(bar_index, stoploss, bar_index, stoploss, color=color.red, width=2, extend=extend.right, style=line.style_dotted)
    // label.new(bar_index, takeprofit, "TP", style=label.style_labeldown)
    // label.new(bar_index, stoploss, "SL", style=label.style_labelup)
    strategy.entry("Long", strategy.long, when = goLong)
    strategy.exit("TP/SL", "Long", stop=stoploss, limit=takeprofit)
if closeLong
    takeprofit := na
    stoploss := na
    strategy.close(id = "Long", when = closeLong)

if (not inDateRange)
    strategy.close_all()