Chiến lược thời gian chỉ báo kép biến động động lượng siêu xu hướng
Tổng quan
Chiến lược này kết hợp các chỉ số siêu xu hướng và lý thuyết sóng Elliott để xây dựng một công cụ giao dịch kỹ thuật vững chắc. Nó sử dụng phân tích xu hướng nhiều tầng để cung cấp một cái nhìn toàn diện hơn về thị trường, có thể nắm bắt sớm sự đảo ngược xu hướng tiềm ẩn của thị trường và biến động giá quan trọng.
Nguyên tắc chiến lược
Ý tưởng cốt lõi nằm ở phương pháp đa tầng của nó:
- Sử dụng 4 chỉ số siêu xu hướng, mỗi chỉ số sử dụng chiều dài và nhân ATR khác nhau để đánh giá xu hướng từ ngắn hạn đến dài hạn
- Bằng cách kết hợp các chỉ số, bạn có thể tìm thấy một tín hiệu làm nhiều hơn và làm trống.
- Sử dụng phương pháp nhận dạng mô hình của sóng Elliott để nhận ra các mô hình tương tự của hành vi thị trường và xác nhận tín hiệu giao dịch
Theo đó, việc sử dụng nhiều chỉ số cũng như tăng khả năng nhận dạng mô hình giúp cho chiến lược trở nên vững chắc hơn.
Phân tích lợi thế
- Thiết kế đa chỉ số, cung cấp toàn diện đánh giá
- Lý thuyết sóng truyền cảm hứng, nhận dạng mô hình tăng sự ổn định
- Điều chỉnh hướng trong thời gian thực để thích ứng với sự thay đổi của thị trường
- Các tham số có thể được cấu hình cho các giống và thời gian khác nhau
Phân tích rủi ro
- Cài đặt tham số phụ thuộc vào kinh nghiệm và cần điều chỉnh để xác định sự kết hợp tham số tốt nhất
- Thiết kế đa chỉ số phức tạp hơn, tăng tải tính toán
- Không thể hoàn toàn tránh được tín hiệu sai
Có thể xác định các tham số tối ưu bằng cách tối ưu hóa tham số; sử dụng điện toán đám mây để tăng hiệu suất tính toán; thiết lập dừng lỗ để kiểm soát rủi ro.
Hướng tối ưu hóa
Có thể tối ưu hóa theo các khía cạnh sau:
- Thêm mô-đun điều chỉnh tham số thích ứng, điều chỉnh tham số theo các điều kiện thị trường động
- Thêm mô hình học máy để giúp đánh giá độ tin cậy của tín hiệu giao dịch
- Xác định mô hình thị trường kết hợp các yếu tố bên ngoài như chỉ số cảm xúc, sự kiện tin tức
- Hỗ trợ nhiều mẫu tham số giống, giảm công việc kiểm tra
Điều này sẽ giúp các tham số chiến lược thông minh hơn, phán đoán chính xác hơn và ứng dụng thực tế dễ dàng hơn.
Tóm tắt
Chiến lược tổng hợp xem xét hai chiều của xu hướng và mô hình, đảm bảo tính vững chắc của phán đoán và tăng tính linh hoạt của chiến lược. Việc đặt nhiều chỉ số và tham số đảm bảo khả năng áp dụng trên toàn thị trường. Nếu tiếp tục giới thiệu các phương pháp thông minh và tự động hóa, chiến lược sẽ tăng cường đáng kể mức độ chiến đấu thực tế.
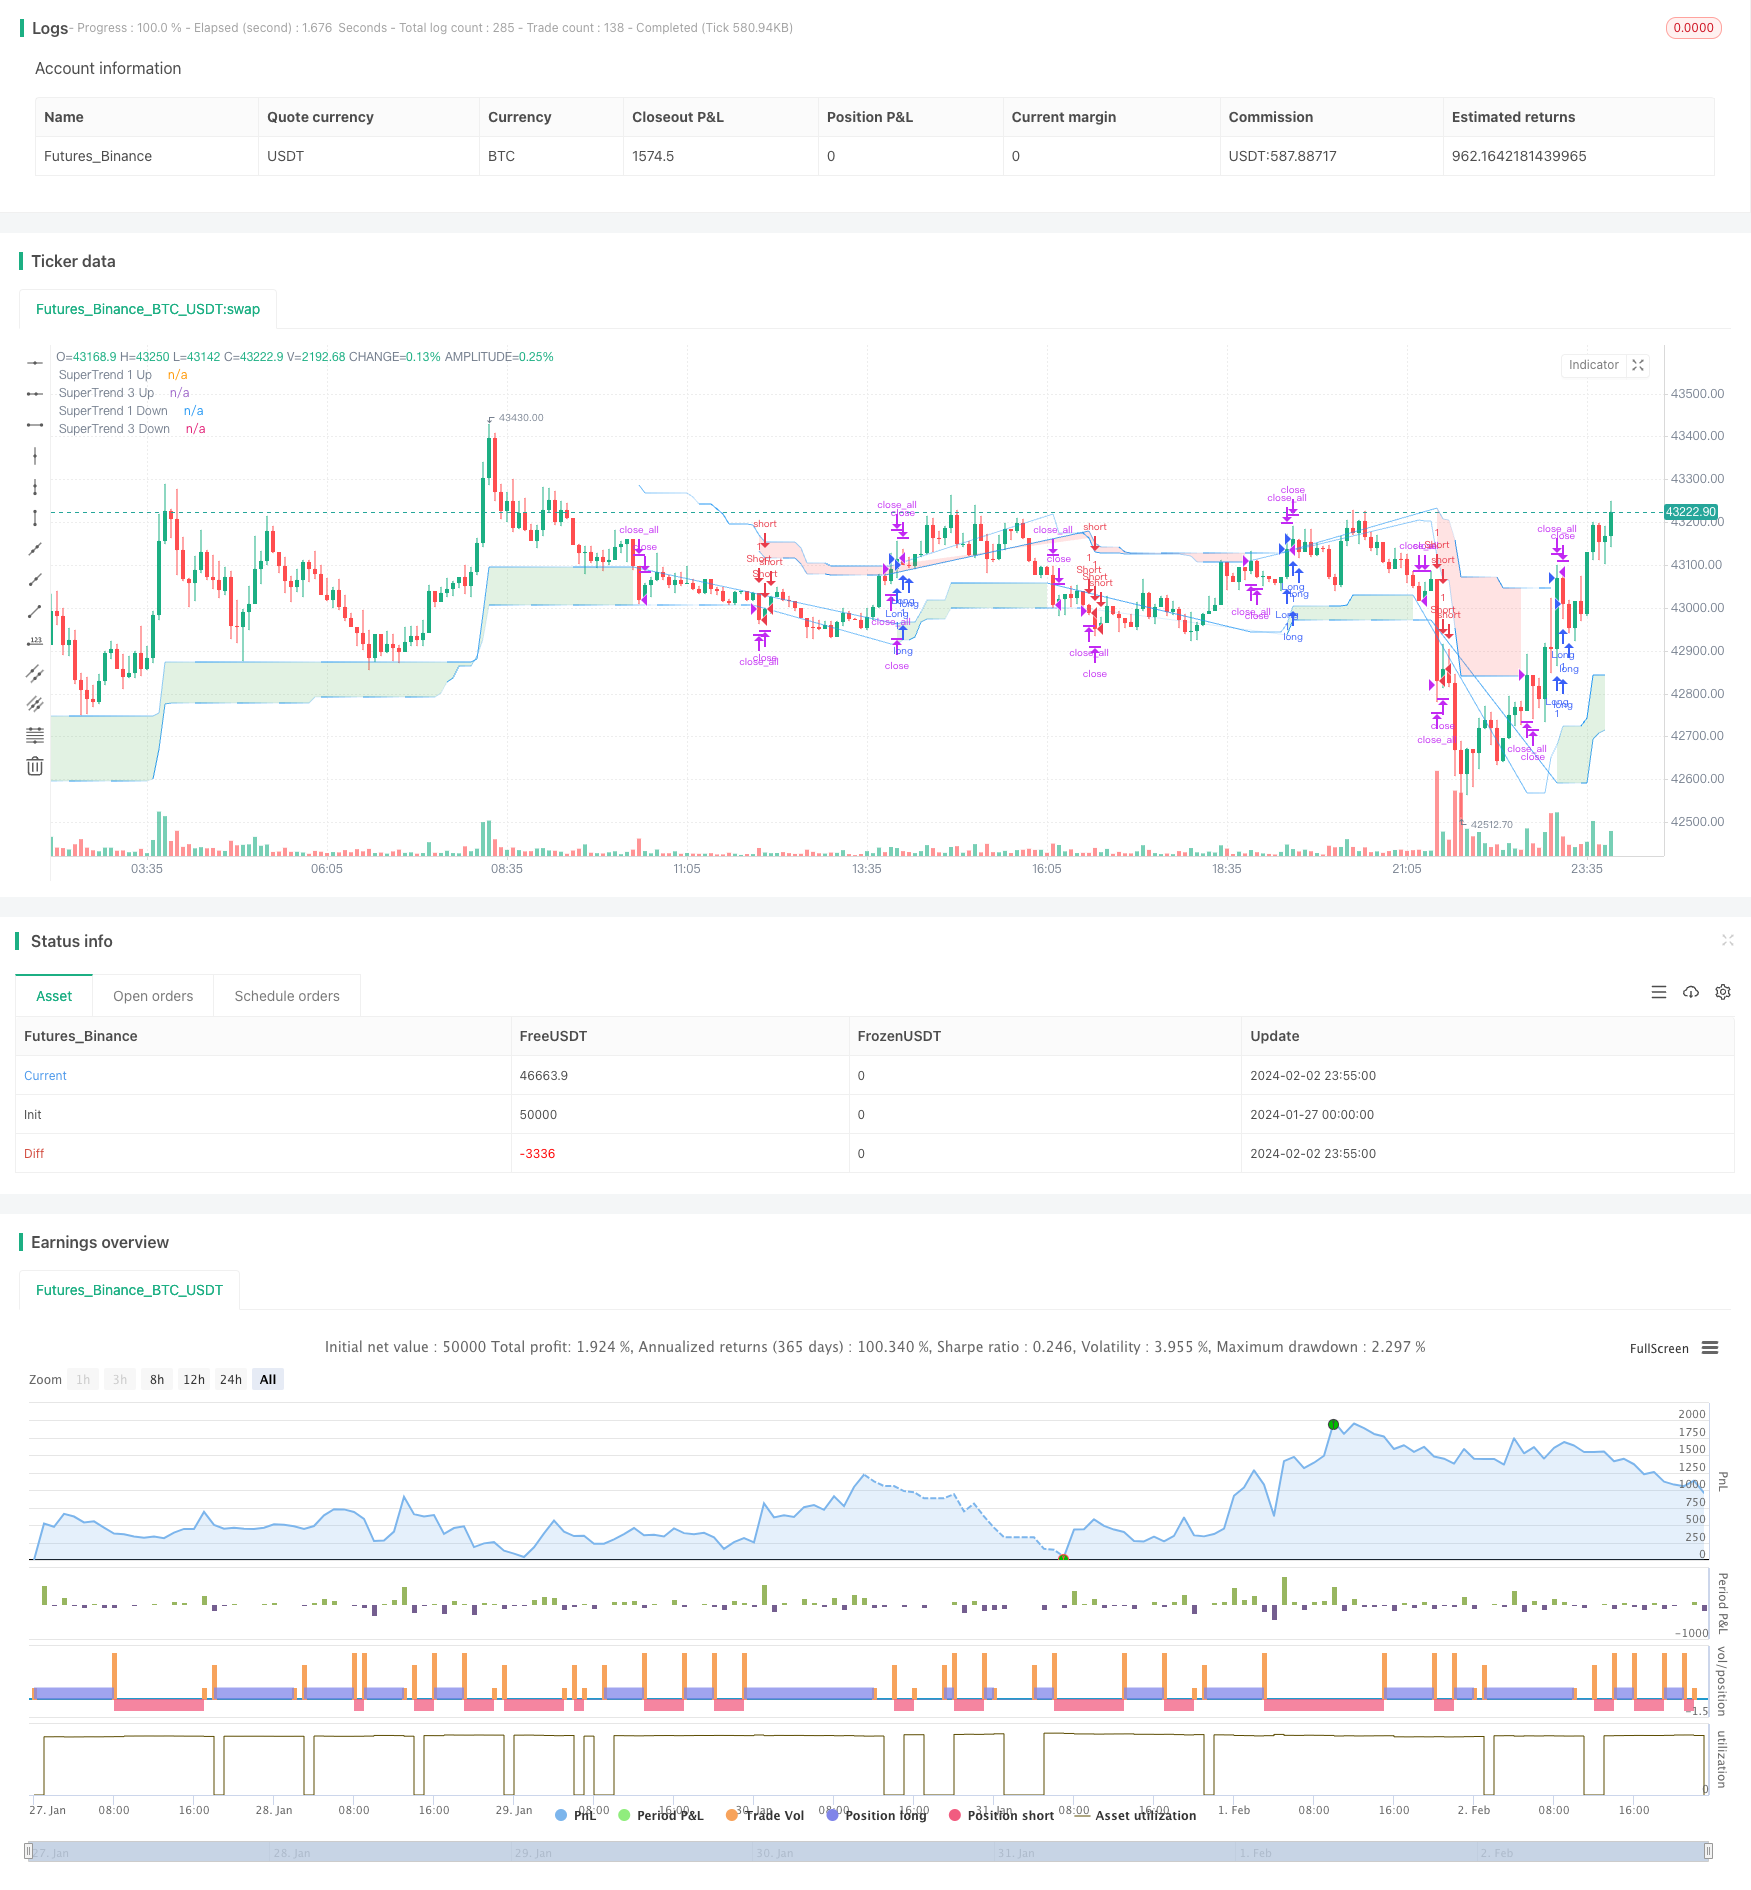
/*backtest
start: 2024-01-27 00:00:00
end: 2024-02-03 00:00:00
period: 5m
basePeriod: 1m
exchanges: [{"eid":"Futures_Binance","currency":"BTC_USDT"}]
*/

//@version=5
strategy("Elliott's Quadratic Momentum - Strategy [presentTrading]",shorttitle = "EQM Strategy [presentTrading]", overlay=true )

// Inputs for selecting trading direction
tradingDirection = input.string("Both", "Select Trading Direction", options=["Long", "Short", "Both"])


// SuperTrend Function
supertrend(src, atrLength, multiplier) =>
    atr = ta.atr(atrLength)
    up = hl2 - (multiplier * atr)
    dn = hl2 + (multiplier * atr)
    trend = 1
    trend := nz(trend[1], 1)
    up := src > nz(up[1], 0) and src[1] > nz(up[1], 0) ?   math.max(up, nz(up[1], 0)) : up
    dn := src < nz(dn[1], 0) and src[1] < nz(dn[1], 0) ? math.min(dn, nz(dn[1], 0)) : dn
    trend := src > nz(dn[1], 0) ?  1 : src < nz(up[1], 0)? -1 : nz(trend[1], 1)
    [up, dn, trend]

// Inputs for SuperTrend settings
atrLength1 = input(7, title="ATR Length for SuperTrend 1")
multiplier1 = input(4.0, title="Multiplier for SuperTrend 1")
atrLength2 = input(14, title="ATR Length for SuperTrend 2")
multiplier2 = input(3.618, title="Multiplier for SuperTrend 2")
atrLength3 = input(21, title="ATR Length for SuperTrend 3")
multiplier3 = input(3.5, title="Multiplier for SuperTrend 3")
atrLength4 = input(28, title="ATR Length for SuperTrend 3")
multiplier4 = input(3.382, title="Multiplier for SuperTrend 3")

// Calculate SuperTrend
[up1, dn1, trend1] = supertrend(close, atrLength1, multiplier1)
[up2, dn2, trend2] = supertrend(close, atrLength2, multiplier2)
[up3, dn3, trend3] = supertrend(close, atrLength3, multiplier3)
[up4, dn4, trend4] = supertrend(close, atrLength4, multiplier4)


// Entry Conditions based on SuperTrend and Elliott Wave-like patterns
longCondition = trend1 == 1 and trend2 == 1 and trend3 == 1 and trend4 == 1
shortCondition = trend1 == -1 and trend2 == -1 and trend3 == -1 and trend4 == - 1

// Strategy Entry logic based on selected trading direction
if tradingDirection == "Long" or tradingDirection == "Both"
    if longCondition
        strategy.entry("Long", strategy.long)
        // [Any additional logic for long entry]

if tradingDirection == "Short" or tradingDirection == "Both"
    if shortCondition
        strategy.entry("Short", strategy.short)
        // [Any additional logic for short entry]


// Exit conditions - Define your own exit strategy
// Example: Exit when any SuperTrend flips
if trend1 != trend1[1] or trend2 != trend2[1] or trend3 != trend3[1] or trend4 != trend4[1]
    strategy.close_all()

// Function to apply gradient effect
gradientColor(baseColor, length, currentBar) =>
    var color res = color.new(baseColor, 100)
    if currentBar <= length
        res := color.new(baseColor, int(100 * currentBar / length))
    res

// Apply gradient effect
color1 = gradientColor(color.blue, atrLength1, bar_index % atrLength1)
color4 = gradientColor(color.blue, atrLength4, bar_index % atrLength3)


// Plot SuperTrend with gradient for upward trend
plot1Up = plot(trend1 == 1 ? up1 : na, color=color1, linewidth=1, title="SuperTrend 1 Up")
plot4Up = plot(trend4 == 1 ? up4 : na, color=color4, linewidth=1, title="SuperTrend 3 Up")

// Plot SuperTrend with gradient for downward trend
plot1Down = plot(trend1 == -1 ? dn1 : na, color=color1, linewidth=1, title="SuperTrend 1 Down")
plot4Down = plot(trend4 == -1 ? dn4 : na, color=color4, linewidth=1, title="SuperTrend 3 Down")

// Filling the area between the first and third SuperTrend lines for upward trend
fill(plot1Up, plot4Up, color=color.new(color.green, 80), title="SuperTrend Upward Band")

// Filling the area between the first and third SuperTrend lines for downward trend
fill(plot1Down, plot4Down, color=color.new(color.red, 80), title="SuperTrend Downward Band")